 Open Access Article
Creative Commons Attribution 3.0 Unported Licence
Biocomposite consisting of miscanthus fiber and biodegradable binary blend matrix: compatibilization and performance evaluation
Rajendran Muthurajab,
Manjusri Misra *ab and
Amar Kumar Mohanty
 *ab
*ab
aSchool of Engineering, University of Guelph, Thornbrough Building, 50 Stone Road East, Guelph, Ontario N1G2W1, Canada. E-mail: mohanty@uoguelph.ca; mmisra@uoguelph.ca
bBioproducts Discovery and Development Centre (BDDC), Department of Plant Agriculture, University of Guelph, Crop Science Building, 50 Stone Road East, Guelph, Ontario N1G2W1, Canada
First published on 23rd May 2017
Abstract
Biocomposites were fabricated from miscanthus fibers and a blend composed of poly(butylene succinate) (PBS)/poly(butylene adipate-co-terephthalate) (PBAT) matrix by extrusion and injection molding. Due to the reinforcing effect of miscanthus fibers, the tensile, flexural, and storage modulus of the composites were increased with increasing fiber content from 30 to 50 wt%. Young's modulus of the composite was evaluated by parallel, series, Hirsch and Halpin–Tsai models. It was found that the Hirsch model has good agreement with the experimental modulus of the composites. There was a sharp reduction in tensile strength and impact strength after the incorporation of miscanthus fibers into PBS/PBAT blend matrix. These reductions were due to the incompatibility between the fibers and the matrix. Therefore, maleic anhydride (MAH) functionalized PBS/PBAT blend was prepared and used as compatibilizer to improve the compatibility between the fibers and the matrix. The composites prepared with 5 wt% MAH functionalized compatibilizer showed significant improvement in mechanical properties compared to their uncompatibilized counterparts. The morphological analysis of the composites displayed good fiber–matrix interaction in the presence of compatibilizer whereas composites showed poor interface between the phases without compatibilizer. The shear thinning behavior of the composites was increased compared to neat PBS/PBAT blend. The increased shear thinning behavior of the composite was attributed to the reduced polymer chain entanglement in the presence of fibers. The miscanthus fibers reinforced PBS/PBAT composites can offer significant benefit in terms of economic competitiveness and functional performances.
1. Introduction
Non-biodegradable polymeric materials are known to persist in the environment a long time after disposal. Therefore, scientific communities are interested in biodegradable polymeric materials for short-lifespan products. Biodegradable polymers can easily be compostable in the presence of naturally occurring microbes to CO2 and H2O under aerobic conditions.1 Poly(butylene succinate) (PBS) is commercially available biodegradable polymer. Generally, the PBS is synthesized from nonrenewable resource based monomers. Recently, the PBS is produced from renewable resource based succinic acid2,3 with about 54% biobased content (calculated according to ASTM D6866).2 Some of the PBS mechanical properties are inappropriate for many applications.4 The PBS mechanical properties were considerably improved by blending with commercially available biodegradable polymer i.e., poly(butylene adipate-co-terephthalate) (PBAT).3–5 However, these polymers are currently having poor cost-performance as compared to conventional polymers. This poor cost performance is due to limited production of these biodegradable polymers.6 This shortcoming can be overcome by reinforcing some low cost natural fibers into the polymer matrices.7Natural fibers have economic advantages compared to synthetic fibers in addition to being biodegradable, renewable, and lightweight. Miscanthus is a non-food typical lignocellulosic biomass. Miscanthus fibers are advantageous because it is low cost, high yield crop with low input conditions and a low maturation time.8,9 Due to these benefits the best strategy is to combine biodegradable polymers with miscanthus fibers in order to create sustainable biocomposites. Natural fibers are inherently hydrophilic in nature and are as such incompatible with the hydrophobic polymer matrices. This incompatibility leads to deteriorate the mechanical performance of the resulting biocomposites. Therefore, various strategies have been developed to improve the fibers–matrix interface.10 Some of these strategies include using a compatibilizing agent/compatibilizer to enhance interfacial bonding between the phases in the composites.11–15 Keener et al.16 used commercially available and economically produced maleic anhydride (MAH) grafted polypropylene (PP) compatibilizer to improve the interfacial interaction between the agrofiber and PP composites. Similarly, Tserki et al.11 studied the effect of synthesized MAH grafted poly(butylene succinate-co-butylene adipate) (PBSA) compatibilizer on the performances of the PBSA/cotton fiber composites. These researchers showed a considerable improvement in all the mechanical properties as compared to corresponding uncompatibilized composites. Although, only a few studies have investigated the miscanthus fiber reinforced biodegradable polymer composites.4,8,9,17,18 In our previous study18 we have used MAH grafted PBS compatibilizer to improve the compatibility between PBS matrix and miscanthus fiber. Due to the increased compatibility between the matrix and fiber, it was found that the mechanical performances of the resulting composites were superior compared to the uncompatibilized counterparts. However, the PBS/miscanthus composites showed the maximum notched Izod impact strength of 53 J m−1 (ref. 18) which is not sufficient for some applications. Generally, blend matrix based composites could offer tailored properties, or an optimum stiffness–toughness balance for the resulting composites. The biocomposites made from different agro fibers (miscanthus, switchgrass and soy hull) and a binary blend matrix of polylactic acid (PLA)/polyhydroxybutyrate-valerate (PHBV) has been reported.9 Miscanthus fiber based biocomposites showed superior mechanical and thermo-mechanical properties compared to switchgrass and soy hull based PLA/PHBV blend matrix based biocomposites. Similarly, biocomposites have been prepared with PHBV/PBAT blend matrix and different lignocellulosic fibers (soy stalk, corn stalk, wheat straw, switchgrass, and miscanthus).8 Among these PHBV/PBAT biocomposites, the miscanthus fiber reinforced PHBV/PBAT based biocomposites had better performances, as compared to other lignocellulose fibers as studied.
This study aimed to prepare sustainable biocomposites with blend of PBS/PBAT matrix and miscanthus fibers. This study also aims to enhance the compatibility between miscanthus fibers and PBS/PBAT matrix. The effect of MAH grafted PBS/PBAT blend compatibilizer on the resulting biocomposites has been investigated by means of mechanical, thermo-mechanical, morphological, and rheological properties.
2. Materials and methodology
2.1. Materials
Chopped miscanthus fibers with length of 4.65 ± 2.5 mm and diameter of 0.074 ± 0.024 mm were obtained from New Energy Farms, Ontario, Canada.4 It is used as received without any further purification and/or modification. Commercially available PBAT (Biocosafe 2003F) and PBS (Biocosafe 1903) granules were procured from Xinfu Pharmaceutical Co., Ltd, China. Dicumyl peroxide (DCP) with 99% purity was purchased from Acros Organics, USA, and maleic anhydride (MAH) was obtained from Sigma-Aldrich, USA.2.2. Compatibilizer preparation
Maleic anhydride grafted PBS/PBAT (60/40 wt%) blend (MAHgPBS/PBAT) was prepared in Thermo Scientific Haake PolyLab™ at 160 °C with 5 phr of MAH and 1 phr of DCP by using procedure similarly reported earlier.182.3. Characterization of MAH grafted samples
The MAH grafting on the PBS/PBAT blend was confirmed by Fourier transform infrared (FTIR) spectroscopy (Thermo Scientific Nicolet 6700). The analysis was carried out with a resolution of 4 cm−1 and 36 consecutive readings. Due to the MAH grafting on the PBS/PBAT backbone, FTIR spectra (spectra not provided) showed two new peaks (1857 and 1782 cm−1) in the MAH grafted sample compared to neat PBS/PBAT blend. The MAH grafting percentage was measured by acid–base titration method, and the MAH grafting percentage of the MAHgPBS/PBAT was 2.05%. A detailed acid–base titration procedure was reported in our previous study.18 The melt flow index (MFI) of the MAHgPBS/PBAT compatibilizer was 81 ± 24 g/10 min (MFI measured according to ASTM D1238).2.4. Composites preparation
Before melt processing, all the components were dried at 80 °C for at least 12 h in an oven to remove excess moisture from the polymers and fibers. According to our previous research findings, PBS/PBAT blend with 60/40 wt% ratio3 was taken as matrix for composites fabrication in the present study. Hereafter, PBS/PBAT blend 60/40 wt% will be referred as PBS/PBAT blend. The PBS/PBAT blend matrix based composites were prepared by varying 30, 40 and 50 wt% of miscanthus fibers in extrusion followed by injection molding. These composites were also prepared with 5 wt% MAH grafted PBS/PBAT (MAHgPBS/PBAT) compatibilizer. The extrusion and injection molding were carried out in a DSM Xplore®, The Netherlands. The capacity of DSM extruder and injection molding machine was 15 and 12 cm3, respectively. The extrusion was done in a twin screw extruder (co-rotating) with a screw aspect ratio of 18 and a screw length of 150 mm. All the formulations were processed at 140 °C with extrusion time of 2 min, and screw rotation per minute of 100. Injection molding was done at 140 °C with an injection pressure of 5 bar for 5 s and mold temperature of 30 °C.2.5. Mechanical properties
Prior to measure the mechanical properties, the injection molded samples were conditioned two days at room temperature. The flexural and tensile properties were measured in Instron-3382 (Universal testing machine). Flexural properties were measured at a speed of 14 mm min−1 in a three point bending mode. The tensile test was performed at a speed of 5 mm min−1 for all the composite specimens and 50 mm min−1 for PBS/PBAT blend. The tensile test was performed as per ASTM D638 and the flexural test was carried out as per ASTM D790. The Izod impact test bars were notched in TMI motorized notching cutter. As per ASTM D256 standard, the notched Izod impact strength was measured in TMI Impact Tester (Model 43-02) with a 5 ft-lb pendulum. The reported mechanical data are an average value of at least five samples for each formulation.2.6. Density
An electronic densimeter (Alfa Mirage, model MD-300S) was used to measure the density of the PBS/PBAT blend and its composites. The density measurement was performed by Archimedes principle. The rule of mixture equation (eqn (1)) was used to measure the density of the miscanthus fibers.| ρc = Vfρf + Vmρm | (1) |
2.7. Dynamic mechanical analysis (DMA)
Dynamic mechanical properties were measured in a DMA Q800, TA instruments Inc, USA. The storage modulus and tan delta results were obtained as a function of temperature with a temperature ramp of 3 °C min−1. The dynamic mechanical properties were performed in a dual cantilever clam with a 15 μm oscillating amplitude and 1 Hz vibrating frequency. As per ASTM D648 standard, the heat deflection temperature (HDT) of the samples was measured using same DMA machine. The HDT measurements were conducted in a three point bending clamp with heating rate of 2 °C min−1.2.8. Differential scanning calorimetry (DSC)
DSC analyses were performed under nitrogen environment in DSC Q200, TA Instruments Inc., USA. The heating rate and cooling rate of the DSC experiments were 10 and 5 °C min−1, respectively. The samples were heated from −50 to 180 °C, followed by cooling to −50 °C. Then the samples were reheated from −50 to 180 °C. The reported results were collected from the second heating and first cooling scans while the first heating scans were used to remove thermal history of the samples.2.9. Morphological analysis
The impact fractured specimen morphology was observed by Inspect S50-FEI Company scanning electron microscopy (SEM). To prevent charging of the specimens during imaging, all the specimens were gold sputter coated prior to observe the morphology.2.10. Rheology
The rheological property was measured at 140 °C in Anton-Paar Rheometer (model MCR 301). The experiments were performed in 25 mm diameter parallel-plate with 1 mm gap between the plates. The complex viscosity of the samples was measured from 629 to 0.1 rad s−1 by frequency sweep test. Disc shape injection molded samples were used to study the complex viscosity.3. Results and discussion
3.1. Mechanical properties
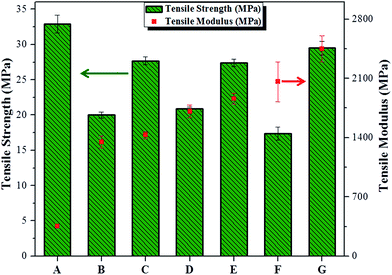
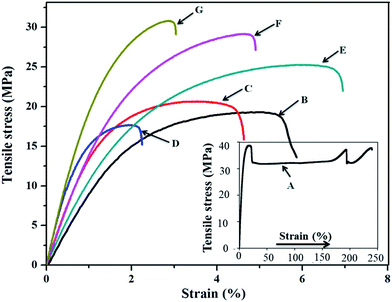
Fig. 1 represents the tensile properties of the PBS/PBAT blend and its composites with and without MAHgPBS/PBAT compatibilizer. When the fiber content increased from 30 to 50 wt% in PBS/PBAT blend, the tensile modulus of the resulting composites gradually increased. This is due to the restriction of polymer chain mobility in the presence of rigid fibers.19 The uncompatibilized composite prepared with 40 wt% fiber did not show significant difference in tensile strength compared to uncompatibilized composite prepared with 30 wt% fiber. However, a reduction in tensile strength of PBS/PBAT composites was observed with increasing fiber content up to 50 wt%. This is due to the incompatibility between the matrix–fibers. There are many researchers have reported such reduction of properties in natural fiber composites.9,19 It is well documented that the compatibilizers could connect the fibers and the matrix through chemical bonds like covalent bonds and/or hydrogen bonds.15 Therefore, MAH grafted compatibilizers have great potential to improve the performance of composites through interfacial interaction between the fiber and matrix. The tensile strength of the composites with compatibilizer showed significant improvement in comparison to their corresponding uncompatibilized composites. For example, PBS/PBAT/miscanthus fibers (50 wt%)/compatibilizer (5 wt%) showed 69% tensile strength improvement as compared to corresponding composite without compatibilizer. This improvement is attributed to good interaction between the fiber–matrix. Another possible reason for the improved tensile strength of the compatibilized composites is physical entanglements which can occur between the phases.20Fig. 2 shows the stress–strain curves of the composites with and without compatibilizer. The stress–strain curve of the PBS/PBAT blend clearly shows three types of deformation i.e., elastic deformation, plastic deformation and strain hardening. However, the stress–strain curves of all the composite samples show elastic as well as plastic deformation after maximum stress reached. The percentage elongation of all the composite samples was lower compared to neat PBS/PBAT blend. This reduction is commonly observed for most of the fiber reinforced composites.11,18 However, all the compatibilized composites exhibited slightly higher elongation at break compared to their corresponding uncompatibilized composites. This implies that the interfacial adhesion was improved between the phases.21,22
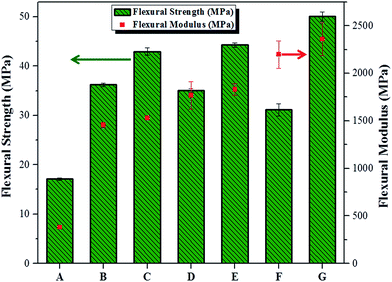
Flexural properties variation with miscanthus fiber content in PBS/PBAT blend matrix is shown in Fig. 3. The PBS/PBAT blend had the flexural modulus of 380 MPa while the flexural strength of 17 MPa. Similar to the tensile modulus, the addition of miscanthus fibers into PBS/PBAT blend leads to a remarkable improvement in the flexural modulus of the resulting composites. Similar occurrence has been reported in flexural modulus with increasing filler content in polymer matrices.23,24 Moreover, the addition of miscanthus fibers into polymer matrix resulted in superior flexural properties than its matrix.25 As mentioned before, the polymer chain mobility has been hindered in the presence of fibers, consequently the composites become stiffer and have a higher flexural strength as compared to their matrix.15 There was no flexural strength difference observed in the uncompatibilized composites prepared with 30 and 40 wt% fiber. Among the PBS/PBAT/miscanthus composites, the uncompatibilized PBS/PBAT composite with 50 wt% miscanthus fibers showed a least flexural strength. This could be associated with the agglomeration of fibers in the matrix.23 The flexural strength of the uncompatibilized composites is still superior in comparison to PBS/PBAT blend matrix. This phenomenon once again proves that the miscanthus fibers have good reinforcing capabilities in the polymer matrix. The flexural strength of the compatibilized composites was superior to their uncompatibilized counterparts. The compatibilized composite with 50 wt% miscanthus fiber exhibited the highest increase (192%) of flexural strength compared with PBS/PBAT matrix.
The results in Table 1 represent the Izod impact strength of PBS/PBAT/miscanthus composites with and without compatibilizer. The PBS/PBAT blend had non-break impact strength. Similar to tensile strength, the PBS/PBAT blend matrix showed substantial reduction in impact strength when miscanthus fibers incorporated from 30 to 50 wt%. The weak interface between the components is responsible for the deteriorated impact strength of the composites. All the composites showed small area under stress–strain curves (Fig. 2) compared to PBS/PBAT blend which suggest that the ductility of the PBS/PBAT blend matrix is reduced after incorporation of miscanthus fibers. It can be noted that the uncompatibilized composite with 50 wt% fiber showed lower impact strength compared to uncompatibilized composites prepared with fiber content of 30 and 40 wt%. This could be due to the high fiber content which lead to agglomeration and weaken the resulting composites under impact load.9 However, composites with 5 wt% compatibilizer showed a considerable amount of impact strength increment compared to their corresponding uncompatibilized composites. The improved impact strength of the compatibilized composite has consistent with the increased area under stress–strain curves (Fig. 2) compared to the corresponding uncompatibilized composites. The compatibilized composites with 30, 40 and 50 wt% fibers showed 59, 62, and 36% improvement in impact strength when compared to their corresponding uncompatibilized composites, respectively. These improvements are due to enhanced interfacial bonding between the matrix–fiber. Better interfacial adhesion helps to promote stress transfer from one phase to another phase through chemical bonds.26 Furthermore, there is a possibility of mechanical interlocking in the compatibilized composites, which may occur between the compatibilizer–fiber and/or between the compatibilizer–matrix. Overall, the observed mechanical performances of the PBS/PBAT/miscanthus composites with compatibilizer suggest that the compatibility between the fiber–matrix has been greatly improved.
| Samples | Notched Izod impact strength (J m−1) |
|---|---|
| PBS/PBAT blend | Non-break |
| PBS/PBAT blend + 30 wt% miscanthus | 64.50 ± 3.59 |
| PBS/PBAT blend + 40 wt% miscanthus | 54.36 ± 2.94 |
| PBS/PBAT blend + 50 wt% miscanthus | 46.57 ± 1.64 |
| PBS/PBAT blend + 30 wt% miscanthus + 5 wt% compatibilizer | 102.47 ± 4.36 |
| PBS/PBAT blend + 40 wt% miscanthus + 5 wt% compatibilizer | 88.15 ± 2.59 |
| PBS/PBAT blend + 50 wt% miscanthus + 5 wt% compatibilizer | 63.42 ± 3.12 |
3.2. Theoretical approximation of Young's modulus of the PBS/PBAT/miscanthus composites
There are several mathematical models that have been proposed to predict composites property.27 Parallel, series, Hirsch's, and Halpin–Tsai models are very often used to determine the randomly oriented rigid short fiber composite Young's modulus, in parallel and series models are shown in eqn (2) and (3), respectively.Parallel model
| Mc = MfVf + MmVm | (2) |
Series model
 | (3) |
In both parallel and series models, Mc, Mm and Mf represent the Young's modulus of the composites, matrix, and fibers while Vf and Vm represent the volume fractions of fiber and matrix, respectively.
 | (4) |
 | (5) |
 | (6) |
 | (7) |
 | (8) |
| ξ = 2(l/d) | (9) |
Aspect ratio of the reinforcement is l/d. In a fiber composite with random fiber orientation (Erandom), the elastic modulus can also be determined using the Tsai Pagano model and it is written as:
| Erandom = 3/8EL + 5/8ET | (10) |
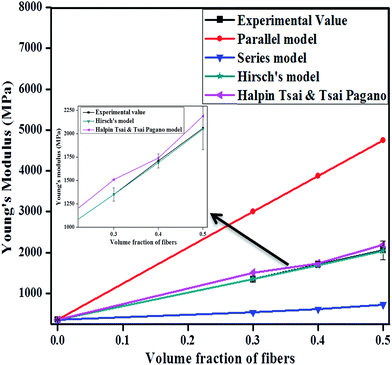
Fig. 4 compares the experimental and the theoretical elastic modulus of the PBS/PBAT blend based miscanthus fiber composites. With increasing fiber content, the experimental as well as the theoretical elastic modulus of the composites were increased. However, the predicated modulus using parallel and series models are significantly deviated from experimental modulus values. These deviations could be due to the model operating under the assumption that there is no interaction between the fiber–matrix in the composites.28 According to the literature,28,29 there is possibility for interaction between the components in the composite. Therefore, the predicted modulus by parallel and series models is not following the experimental modulus. It was observed that the experimental moduli of the composites had good agreement with theoretically calculated moduli by the Hirsch model. In the Hirsch model, the parameter x determines the stress transfer between the components in the composites. In order to determine a linear-fit value with experimental values, the x values varied from 0 to 1 in the eqn (4). A best-fit was found between experimental and theoretical values when the x value 0.33 in eqn (4). The obtained x value is slightly higher than the carbon fiber reinforced PHBV (x = 0.1)30 and PLA (x = 0.2) composites.31 The observed high x value (0.33) suggests that the PBS/PBAT/miscanthus composites have an effective stress transfer between the phases compared to carbon fiber reinforced PLA and PHBV composites.30,31 The experimental modulus of the miscanthus fibers was 9.49 GPa.32 This modulus was used to predict the theoretical modulus of the PBS/PBAT/miscanthus composites by H–T model. The predicated moduli using the H–T model are slightly deviated from the experimental modulus values. This behavior could be attributed to the modulus difference in the nodes, internodes, stem and leaves of the miscanthus fiber.32
3.3. Density
The lower density of natural fibers in comparison to glass fibers and mineral fillers enables a reduction in weight of the composite material for many applications. The density values of the PBS/PBAT blend and its composites are shown in Table 2. The densities of the miscanthus fiber reinforced PBS/PBAT composites are above 1.30 g cm−3, which is higher than PBS/PBAT blend density (1.25 g cm−3). Moreover, the composites density was gradually increased with increasing fiber content up to 50 wt%. This is mainly due to the higher density of the miscanthus fiber (1.41 g cm−3). The calculated density of miscanthus fiber is 1.41 g cm−3 which is similar to some other natural fibers that are reported in the literature.33,34 There is no significant difference observed in the compatibilized and corresponding uncompatibilized composites densities. The observed densities of compatibilized and uncompatibilized PBS/PBAT composites are much lower than the density of glass fibers (2.55 g cm−3)35 and glass fibers reinforced PP, polyamide 66 and thermoplastic polyurethane composites.36| Samples | HDT (°C) | Density (g cm−3) |
|---|---|---|
| PBS/PBAT blend | 74.34 ± 0.63 | 1.25 ± 0.002 |
| PBS/PBAT blend + 30 wt% miscanthus | 98.98 ± 0.79 | 1.30 ± 0.001 |
| PBS/PBAT blend + 40 wt% miscanthus | 98.73 ± 3.31 | 1.32 ± 0.003 |
| PBS/PBAT blend + 50 wt% miscanthus | 105.09 ± 1.21 | 1.34 ± 0.003 |
| PBS/PBAT blend + 30 wt% miscanthus + 5 wt% compatibilizer | 99.76 ± 2.98 | 1.31 ± 0.001 |
| PBS/PBAT blend + 40 wt% miscanthus + 5 wt% compatibilizer | 100.95 ± 4.95 | 1.32 ± 0.003 |
| PBS/PBAT blend + 50 wt% miscanthus + 5 wt% compatibilizer | 105.68 ± 3.62 | 1.34 ± 0.002 |
3.4. Dynamic mechanical properties
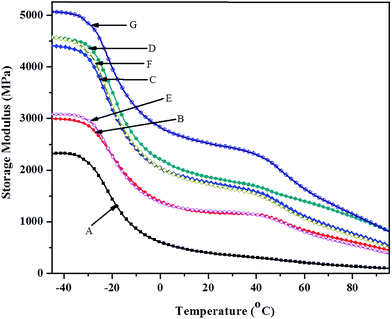
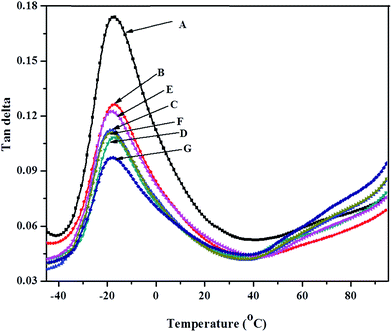
Fig. 5 shows the storage modulus (E′) for PBS/PBAT blend and its composites with respect to temperatures. Due to the reinforcing effect of miscanthus fibers, the storage modulus values of both compatibilized and uncompatibilized composites were significantly higher as compared to the neat PBS/PBAT blend. The E′ values of the PBS/PBAT blend and its composites were higher below the glass transition temperature (Tg) which is −19 °C. However, the E′ values of all the composite samples observed an abrupt decrease at the Tg of PBS/PBAT blend matrix. This is due to the polymer chain mobility increases above the Tg of PBS/PBAT blend matrix. In Fig. 5, the PBS/PBAT blend and its composites showed two relaxations at −19 °C and 40 °C. According to the literature, these low and high transitions are related to β-relaxation and α-relaxation, respectively.37,38 The low-temperature transition is related to the β-relaxation of the amorphous fractions of the polymers and is considered the glass transition. The higher temperature peak corresponds to the α-relaxation related to the polymer crystalline fractions.37,38 Similar findings have been observed in natural fiber reinforced composites by Mofokeng et al.37 and Amash and Zugenmaier.38The molecular transitions and energy dissipation of polymeric materials can be determined by damping factor (tan![[thin space (1/6-em)]](https://www.rsc.org/images/entities/char_2009.gif) δ) peaks. Fig. 6 shows the tan
δ) peaks. Fig. 6 shows the tan![[thin space (1/6-em)]](https://www.rsc.org/images/entities/char_2009.gif) δ peaks of PBS/PBAT blend and its composites. The tan
δ peaks of PBS/PBAT blend and its composites. The tan![[thin space (1/6-em)]](https://www.rsc.org/images/entities/char_2009.gif) δ peak value of the PBS/PBAT blend is not changed considerably after the addition of miscanthus fiber. This observation is consistent with PLA/what straw composites.39 After incorporation of miscanthus fibers into PBS/PBAT matrix, the height of the tan
δ peak value of the PBS/PBAT blend is not changed considerably after the addition of miscanthus fiber. This observation is consistent with PLA/what straw composites.39 After incorporation of miscanthus fibers into PBS/PBAT matrix, the height of the tan![[thin space (1/6-em)]](https://www.rsc.org/images/entities/char_2009.gif) δ peak of the PBS/PBAT blend was reduced. This height reduction is due to the restriction of the polymer chains mobility in the presence of fibers. In the neat polymer systems, the polymer chain segments are free from restraints, thus have high intensity tan
δ peak of the PBS/PBAT blend was reduced. This height reduction is due to the restriction of the polymer chains mobility in the presence of fibers. In the neat polymer systems, the polymer chain segments are free from restraints, thus have high intensity tan![[thin space (1/6-em)]](https://www.rsc.org/images/entities/char_2009.gif) δ peak when compared to the composites. In the present study, compatibilized composites had slightly higher damping effect than corresponding uncompatibilized composites. Generally, the molecular motion at the interfacial region is reduced when the adhesion between the fiber and matrix is improved.40,41 Due to the restricted chain mobility at the interface, the PBS/PBAT/miscanthus composites with compatibilizer showed higher damping effect compared to uncompatibilized counterparts. Similar observation has been reported in natural fiber composites with maleated compatibilizer.40,41 As seen in Fig. 6, the broadness of the tan
δ peak when compared to the composites. In the present study, compatibilized composites had slightly higher damping effect than corresponding uncompatibilized composites. Generally, the molecular motion at the interfacial region is reduced when the adhesion between the fiber and matrix is improved.40,41 Due to the restricted chain mobility at the interface, the PBS/PBAT/miscanthus composites with compatibilizer showed higher damping effect compared to uncompatibilized counterparts. Similar observation has been reported in natural fiber composites with maleated compatibilizer.40,41 As seen in Fig. 6, the broadness of the tan![[thin space (1/6-em)]](https://www.rsc.org/images/entities/char_2009.gif) δ peak is increased with increasing fiber loading. This is due to the increased heterogeneity of the samples.
δ peak is increased with increasing fiber loading. This is due to the increased heterogeneity of the samples.
3.5. Heat deflection temperature
According to ASTM D648, the temperature at which the test specimen deforms 250 μm under a stress of 0.455 MPa is called heat deflection temperature (HDT) of polymeric materials. HDT plays a vital role in selecting polymeric materials for specific applications because it represents the maximum working limit temperature of materials. The HDT value of the PBS/PBAT/miscanthus composites with and without compatibilizer is shown in Table 2. All the composites have higher HDT value than the PBS/PBAT blend matrix. The HDT value of the 30, 40 and 50 wt% fiber reinforced PBS/PBAT composites was around 99, 99 and 105 °C, respectively. It has been suggested that the HDT improvement of the composites with miscanthus fiber composite is attributed to the reinforcing effect in the matrix.9,18 Only a marginal HDT improvement was observed when the fiber content increased from 30 to 50 wt% in the PBS/PBAT blend. This could be because the HDT value of the composites is very near to the melting point (∼115 °C) of the matrix. The HDT values of the compatibilized composites were not significantly different as compared to their corresponding uncompatibilized composites. From these observations, it can conclude that the PBS/PBAT composite with 30 wt% miscanthus fiber reached an optimum HDT value.3.6. Differential scanning calorimetry
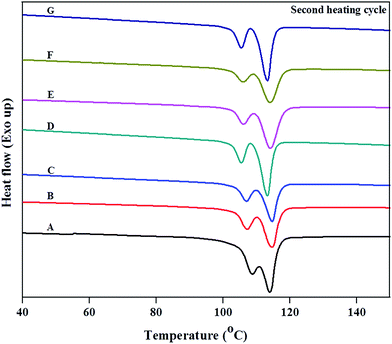
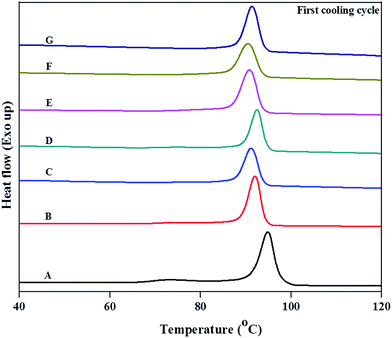
The melting (Tm) and crystallization (Tc) temperature curves of the PBS/PBAT blend and its composites with and without compatibilizer are shown in Fig. 7 and 8. Table 3 summarizes the detailed DSC second heating and first cooling cycle result of the samples. Both composites and PBS/PBAT blend showed bimodal endothermic peaks (Fig. 7), which correspond to two different types of crystal lamella formed during cooling. In the presence of miscanthus fibers, the melting temperature (114 °C) of PBS/PBAT blend is not affected significantly, as shown in Fig. 7. Due to the reduced volume fraction of polymer, the melting enthalpy (ΔHm) values of both compatibilized and uncompatibilized composites were reduced in comparison to blend of PBS/PBAT (Table 3). The double melting peak of PBS/PBAT blend has become more separated in the composite samples. This can be attributed to the enhanced heterogeneous crystal formation with the addition of miscanthus fiber into matrix. As shown in Fig. 8, the crystallization temperature of PBS/PBAT blend was 94.85 °C. The crystallization temperature of PBS/PBAT blend matrix is slightly decreased after incorporation of miscanthus fibers. This is due to the miscanthus fibers restricting the polymer chain diffusion to the surface of the nuclei.42 This result is in accordance with the bamboo fiber composites,43 pineapple leaf composites44 and kneaf fiber composites.13 Lee and Wang,45 however, reported that the PBS crystallization rate can be enhanced with the addition of natural fibers. Their finding contradicts to the present study. This discrepancy could be due to the differences in the nature of the fibers.44 The compatibilized composites did not show any significant difference in crystallization enthalpy (ΔHc) compared to uncompatibilized composites (Table 3). However, both compatibilized and uncompatibilized PBS/PBAT/miscanthus composites had a lower crystallization enthalpy value than matrix. This can be attributed to the amount of PBS/PBAT blend present in the composites.| Samples | Tc (°C) | ΔHc (J g−1) | Tm (°C) | ΔHm (J g−1) |
|---|---|---|---|---|
| PBS/PBAT blend | 94.85 | 36.11 | 113.94 | 40.37 |
| PBS/PBAT blend + 30 wt% miscanthus | 92.03 | 26.22 | 114.51 | 27.72 |
| PBS/PBAT blend + 40 wt% miscanthus | 91.18 | 21.51 | 114.63 | 20.96 |
| PBS/PBAT blend + 50 wt% miscanthus | 92.46 | 21.06 | 113.86 | 20.74 |
| PBS/PBAT blend + 30 wt% miscanthus + 5 wt% compatibilizer | 90.81 | 27.09 | 114.09 | 27.42 |
| PBS/PBAT blend + 40 wt% miscanthus + 5 wt% compatibilizer | 90.56 | 26.30 | 113.95 | 21.26 |
| PBS/PBAT blend + 50 wt% miscanthus + 5 wt% compatibilizer | 91.34 | 26.03 | 113.39 | 22.99 |
3.7. Morphology of composites
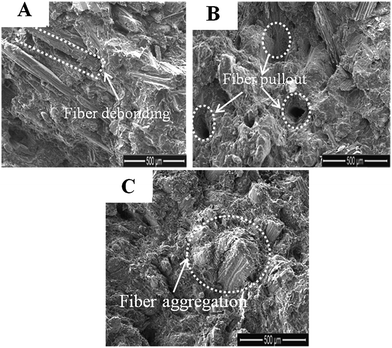
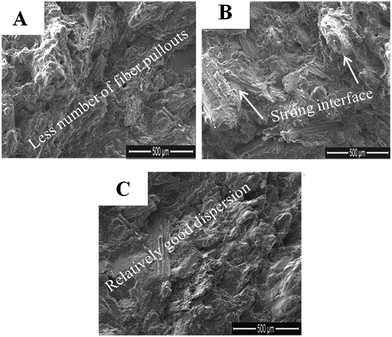
The fracture surface micrographs of uncompatibilized and compatibilized composites with different weight percentage of fiber load are shown in Fig. 9 and 10. As we mentioned before, a composite with dissimilar polarity constituents resulted in weak interfacial adhesion between the constituents. The uncompatibilized composites morphology (Fig. 9) showed worse fiber dispersion, fiber debonding, fiber pullouts, and fiber aggregation. This is an evidence of weak interfacial interaction between the fiber–matrix and thus reduced performance of the resulting composites.14 Contrastingly, the morphology of the compatibilized composites (Fig. 10) showed less fiber pullouts with good fibers–matrix adhesion compared to the uncompatibilized composites. Similar types of morphology have been reported for the compatibilized natural fiber composites.12,18,46 The improved fiber–matrix adhesion is consistent with enhanced mechanical properties of the compatibilized composites. The morphological analysis concludes that the fiber–matrix adhesion has improved with the help of MAH grafted PBS/PBAT compatibilizer.3.8. Rheological property
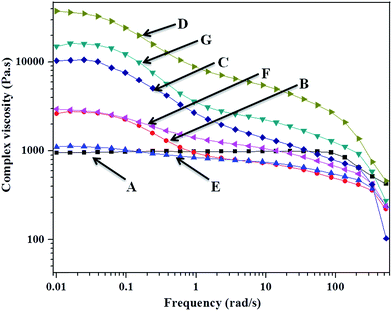
Rheological properties can offer a detailed structural–property relationship of polymer composites. Therefore, the effect of miscanthus fiber content and compatibilizer on the complex viscosity of the PBS/PBAT blend based composites was investigated (Fig. 11). The PBS/PBAT blend showed Newtonian flow behavior at lower frequency whereas slight shear thinning behavior was observed at higher frequency. Such a phenomenon was commonly found in polymer melts because the polymer chain entanglement density drastically reduced with increasing frequency. Additionally, the average end-to-end distance of the polymer chains increased at higher frequency range. Complex viscosity of the composites is higher at lower frequency as compared to the matrix. Theoretically, the addition of fillers/fibers into the thermoplastic polymer matrix will lead to increase viscosity of the melt. This is due to the rigidity of the fibers which restricts the polymer chain mobility in the melt state, thus causing viscosity improvement in the composites.47 In addition, increase in viscosity can be seen with increase in the fiber loading. This may be due to agglomeration of fibers and the increased fiber–fiber interaction in the composites. A steady viscosity reduction was observed in all the composite samples with increasing frequency. This viscosity reduction is due to the reduced fiber–fiber interaction at higher shear rate. Twite-Kabamba et al.48 reported that the maleated compatibilizer can act as plasticizer in composites to reduce the viscosity of the compatibilized composites compared to composites without compatibilizer. Similar observation has been made in polypropylene/sisal fiber composites with maleated compatibilizer.49 In the present study, the complex viscosity of the compatibilized composites was slightly lower compared to the uncompatibilized counterparts in the tested frequency range. This could be due to the plasticization effect of the lower molecular weight compatibilizer in the matrix.48,50 The maleated compatibilizer viscosity should, thereby, be considered when analyzing compatibilized composites melt viscosity.4. Conclusions
Biocomposites were prepared from miscanthus fibers and PBS/PBAT blend matrix by a melt process. The moduli of the prepared composites were increased remarkably compared to the matrix. These improvements suggest that the miscanthus fiber acts as effective reinforcement in the resulting composites. Due to the lack of interfacial interaction between the components, the PBS/PBAT composites showed lower tensile and impact strength compared to PBS/PBAT matrix. In order to overcome this issue in the resulting PBS/PBAT composites, a reactive compatibilizer (MAHgPBS/PBAT) was introduced into the composites. It was found that the mechanical performances of the composites with compatibilizer were noticeably increased compared to their corresponding uncompatibilized composites. This is mainly because of the improved interfacial interaction between the components, which were demonstrated by SEM analysis. The DSC analysis revealed that the crystallization temperature of the PBS/PBAT/miscanthus fiber composites was slightly reduced compared to the matrix. This is attributed to the miscanthus fiber restricting the mobility and diffusion of polymer chains to the surface of the nuclei. The density of all the composites was lower when compared to the glass fibers. Overall, it can be concluded that the prepared PBS/PBAT matrix based composites are a possible candidate to substitute non-biodegradable composites in applications where biodegradability is essential.Acknowledgements
The authors are thankful to the Ontario Ministry of Agriculture, Food and Rural Affairs (OMAFRA), Canada/University of Guelph-Bioeconomy for Industrial Uses Research Program Theme (Project # 200004, 200005 and 200425); the Ontario Ministry of Economic Development and Innovation (MEDI), Canada, Ontario Research Fund, Research Excellence Round 4 program (ORF-RE04) (Project # 050231 and 050289); the Natural Sciences and Engineering Research Council (NSERC), Canada-Discovery Grants (Project # 401111); and the NSERC NCE AUTO21 (Project # 460372 and 460373) for the financial support to carry out this research work.References
- E. Chiellini and R. Solaro, Adv. Mater., 1996, 8, 305–313 CrossRef CAS.
- E. Zini and M. Scandola, Polym. Compos., 2011, 32, 1905–1915 CrossRef CAS.
- R. Muthuraj, M. Misra and A. K. Mohanty, J. Polym. Environ., 2014, 22, 336–349 CrossRef CAS.
- R. Muthuraj, M. Misra, F. Defersha and A. K. Mohanty, Composites, Part A, 2016, 83, 120–129 CrossRef CAS.
- R. Muthuraj, M. Misra and A. K. Mohanty, J. Appl. Polym. Sci., 2015, 132, 42189–42201 CrossRef.
- P. Bordes, E. Pollet and L. Avérous, Prog. Polym. Sci., 2009, 34, 125–155 CrossRef CAS.
- M. Avella, E. Martuscelli and M. Raimo, J. Mater. Sci., 2000, 35, 523–545 CrossRef CAS.
- V. Nagarajan, A. K. Mohanty and M. Misra, ACS Sustainable Chem. Eng., 2013, 1, 325–333 CrossRef CAS.
- M. R. Nanda, M. Misra and A. K. Mohanty, Macromol. Mater. Eng., 2013, 298, 779–788 CrossRef CAS.
- H.-S. Kim, S. Kim, H.-J. Kim and H.-S. Yang, Thermochim. Acta, 2006, 451, 181–188 CrossRef CAS.
- V. Tserki, P. Matzinos and C. Panayiotou, J. Appl. Polym. Sci., 2003, 88, 1825–1835 CrossRef CAS.
- H.-S. Kim, B.-H. Lee, S. Lee, H.-J. Kim and J. Dorgan, J. Therm. Anal. Calorim., 2011, 104, 331–338 CrossRef CAS.
- M. Avella, G. Bogoeva-Gaceva, A. Buzõarovska, M. Emanuela Errico, G. Gentile and A. Grozdanov, J. Appl. Polym. Sci., 2007, 104, 3192–3200 CrossRef CAS.
- M. Z. A. Thirmizir, Z. A. M. Ishak, R. M. Taib, S. Rahim and S. M. Jani, J. Appl. Polym. Sci., 2011, 122, 3055–3063 CrossRef CAS.
- J. M. Lee, Z. A. Mohd Ishak, R. Mat Taib, T. T. Law and M. Z. Ahmad Thirmizir, J. Polym. Environ., 2013, 21, 293–302 CrossRef CAS.
- T. J. Keener, R. K. Stuart and T. K. Brown, Composites, Part A, 2004, 35, 357–362 CrossRef.
- K. Zhang, M. Misra and A. K. Mohanty, ACS Sustainable Chem. Eng., 2014, 2, 2345–2354 CrossRef CAS.
- R. Muthuraj, M. Misra and A. K. Mohanty, ACS Sustainable Chem. Eng., 2015, 3, 2767–2776 CrossRef CAS.
- C. Nyambo, A. K. Mohanty and M. Misra, Biomacromolecules, 2010, 11, 1654–1660 CrossRef CAS PubMed.
- A. Arbelaiz, B. Fernández, J. A. Ramos, A. Retegi, R. Llano-Ponte and I. Mondragon, Compos. Sci. Technol., 2005, 65, 1582–1592 CrossRef CAS.
- H. Wang, X. Sun and P. Seib, J. Appl. Polym. Sci., 2001, 82, 1761–1767 CrossRef CAS.
- J.-F. Zhang and X. Sun, Biomacromolecules, 2004, 5, 1446–1451 CrossRef CAS PubMed.
- Z. A. M. Ishak, B. N. Yow, B. L. Ng, H. P. S. A. Khalil and H. D. Rozman, J. Appl. Polym. Sci., 2001, 81, 742–753 CrossRef.
- S. Shibata, Y. Cao and I. Fukumoto, Polym. Test., 2005, 24, 1005–1011 CrossRef CAS.
- K. Kirwan, R. M. Johnson, D. K. Jacobs, G. F. Smith, L. Shepherd and N. Tucker, Ind. Crops Prod., 2007, 26, 14–27 CrossRef CAS.
- C. Varga, N. Miskolczi, L. Bartha and G. Lipóczi, Mater. Des., 2010, 31, 185–193 CrossRef CAS.
- G. Kalaprasad, K. Joseph, S. Thomas and C. Pavithran, J. Mater. Sci., 1997, 32, 4261–4267 CrossRef CAS.
- S. Jacob, M. Misra and A. K. Mohanty, J. Mater. Sci., 2012, 47, 6056–6065 CrossRef CAS.
- S. Joseph, M. S. Sreekala, Z. Oommen, P. Koshy and S. Thomas, Compos. Sci. Technol., 2002, 62, 1857–1868 CrossRef CAS.
- J. P. Reddy, S. Ahankari, M. Misra and A. Mohanty, Macromol. Mater. Eng., 2013, 298, 789–795 CrossRef CAS.
- R. Chen, M. Misra and A. K. Mohanty, J. Thermoplast. Compos. Mater., 2014, 27, 1286–1300 CrossRef CAS.
- A. Bourmaud and S. Pimbert, Composites, Part A, 2008, 39, 1444–1454 CrossRef.
- A. K. Mohanty, M. Misra and L. T. Drzal, Compos. Interfaces, 2001, 8, 313–343 CrossRef CAS.
- H. Ku, H. Wang, N. Pattarachaiyakoop and M. Trada, Composites, Part B, 2011, 42, 856–873 CrossRef.
- A. K. Mohanty, M. Misra and L. T. Drzal, J. Polym. Environ., 2002, 10, 19–26 CrossRef CAS.
- http//www.plasticomp.com/mass-reduction-light-weighting-carbon-fiber/, accessed Oct, 2016.
- J. P. Mofokeng, A. S. Luyt, T. Tábi and J. Kovács, J. Thermoplast. Compos. Mater., 2012, 25, 927–948 CrossRef CAS.
- A. Amash and P. Zugenmaier, Polymer, 2000, 41, 1589–1596 CrossRef CAS.
- C. Nyambo, A. K. Mohanty and M. Misra, Macromol. Mater. Eng., 2011, 296, 710–718 CrossRef CAS.
- S.-M. Lai, F.-C. Yeh, Y. Wang, H.-C. Chan and H.-F. Shen, J. Appl. Polym. Sci., 2003, 87, 487–496 CrossRef CAS.
- Y. Wang, F.-C. Yeh, S.-M. Lai, H.-C. Chan and H.-F. Shen, Polym. Eng. Sci., 2003, 43, 933–945 CAS.
- S. Singh, A. K. Mohanty, T. Sugie, Y. Takai and H. Hamada, Composites, Part A, 2008, 39, 875–886 CrossRef.
- S. Singh, A. K. Mohanty, T. Sugie, Y. Takai and H. Hamada, Composites, Part A, 2008, 39, 875–886 CrossRef.
- S. Luo and A. N. Netravali, Polym. Compos., 1999, 20, 367–378 CrossRef CAS.
- S.-H. Lee and S. Wang, Composites, Part A, 2006, 37, 80–91 CrossRef CAS.
- C.-S. Wu, Polym. Degrad. Stab., 2012, 97, 2388–2395 CrossRef CAS.
- N. Marcovich, M. Reboredo, J. Kenny and M. Aranguren, Rheol. Acta, 2004, 43, 293–303 CrossRef CAS.
- E. Twite-Kabamba, A. Mechraoui and D. Rodrigue, Polym. Compos., 2009, 30, 1401–1407 CrossRef CAS.
- N. Le Moigne, M. van den Oever and T. Budtova, Polym. Eng. Sci., 2013, 53, 2582–2593 CAS.
- F. Martí-Ferrer, F. Vilaplana, A. Ribes-Greus, A. Benedito-Borrás and C. Sanz-Box, J. Appl. Polym. Sci., 2006, 99, 1823–1831 CrossRef.
| This journal is © The Royal Society of Chemistry 2017 |

