
 Open Access Article
 This Open Access Article is licensed under a Creative Commons Attribution-Non Commercial 3.0 Unported Licence
Unveiling the interaction of DNA–octadecylamine at the air–water interface by ultraviolet-visible reflection spectroscopy
A. Mora-Boza ,
T. Lopes-Costa,
F. Gámez and
J. M. Pedrosa*
,
T. Lopes-Costa,
F. Gámez and
J. M. Pedrosa*
Department of Physical, Chemical and Natural Systems, Universidad Pablo de Olavide, 41013 Seville, Spain. E-mail: jmpedpoy@upo.es
First published on 17th January 2017
Abstract
In this work, ultraviolet-visible reflection spectroscopy is proposed as a technique that, in combination with classical surface pressure–area isotherms, allows to study in situ the adsorption of DNA to octadecylamine monolayers. The presence of the polynucleotide molecules at the interface, typically demonstrated by an expansion and a change in the profile of the ODA isotherms, has been confirmed here by a reflection peak at 260 nm. Increasing DNA concentrations in the subphase from 2 to 8 μM is accompanied by an increment in the expansion of the isotherm showing in all cases an abrupt phase transitions at high surface pressures that is also observed in lateral compressibility representations. This phase transition has been attributed to a squeezing out of DNA phenomenon as demonstrated by the normalization of the corresponding reflection spectra. In addition, hysteresis and reversibility in the formation of the monolayer has been identified, making possible the realization of successive compression–decompression cycles without reaching the collapse of the monolayer. It can be inferred that the DNA molecules expelled out of the monolayer at high surface pressures can enter again during the decompression process. Reflection spectroscopy has been also found to be a valuable tool to investigate the dependence of the adsorption process with both time and DNA concentration in the subphase.
I. Introduction
Nowadays, studies about interaction between polynucleotides and phospholipids are key for understanding the relation between these two cellular components. Phospholipids are the main components of biomembranes, which play an important role for cellular survival. Cellular membranes are the first contact with extracellular medium for the cell and nuclear membranes are essential in order to regulate the traffic into the nucleus, where transcriptional mechanism and gene regulation is developed. Polynucleotides are also indispensable cell components since they acts as genetic information carriers. For this reason, the comprehension of its interaction with biomembranes from a physicochemical viewpoint involves a large progress in gene therapy, polynucleotides transfection and vector engineering. In particular, the disadvantages of viral vectors in gene therapy (strong immune response, toxicity, cellular unspecificity, genomic instability or potential mutagenesis) have turned non-viral vectors into an alternative for the future.1,2 Non-viral vectors, known as lipoplexes are complexes formed by DNA and lipids and are able to cross cellular barriers without the costs derived from viral vectors. Moreover, these binary systems have non-limiting size, are easy to produce and exhibit a high diversity of supramolecular structures and composition.1 Although a large number of studies have demonstrated that these vectors have a suitable efficiency, its stability is not high enough yet. Hence, the commonly used cationic lipids have been combined with neutral lipids known as helper in order to improve their transfection efficiency, regulate their toxicity and increase their half-life.3An interesting avenue in the study of such systems is the use of model membranes as phospholipids monolayers (Langmuir films) spread onto an aqueous subphase containing the polynucleotides. This method allows to determine the main interactions that predominate in the system and to describe the behaviour of the biomembrane model in the presence of DNA or RNA.2,4 However, deeper insight into these interactions is essential to describe the behavior of the components in the presence of the other through the application of interaction models able to interprete the results obtained by additional characterization techniques. In Langmuir films studies, the first signal that provides information about DNA–lipids interaction is the expansion of the isotherm in comparison to that of the pure lipid. During the last years, many authors have observed this phenomenon with different lipids and polynucleotides. For instance, octadecylamine (ODA) has been widely used alone or mixed with other lipids because fatty amines provide a well-balanced charge fitting the requirement for preparing Langmuir–Blodgett films of anionic compounds as DNA.5 To cite few examples, Ramakrishnan et al.6 observed in their studies a very large and rapid expansion of ODA/DOTAP Langmuir monolayers. Erokhina et al.7 observed that the molecular area of ODA monolayers was significantly increased from 21 to 40 Å2 with respect to DNA-free subphases. This fact was interpreted as a consequence of the hydrogen-bonding interaction between ODA and DNA. However, Sastry et al.8 assigned this feature to a diffusion and complexation of DNA molecules with the lipid monolayer, and Gromelski et al.1 reported that the isotherm shape is only affected in the presence of divalent cations, and is squeezed out at high pressure. Among the different hypotheses about the main type of interactions between lipids and the DNA, we must highlight the following ones: adsorption and penetration of DNA into the monolayer,1,6,9–16 electrostatical bounding of DNA molecules to the lipid monolayer without any penetration at the air–water interface7,8,17–19 and conformational transition of DNA in cation-mediated interaction with anionic liposomes.20–23
Many of the aforementioned studies use additional characterization techniques in order to support or complete the isotherm results, both in the monolayer (ellipsometry, X-ray reflectivity or Brewster angle microscopy BAM)1,7,9 or in transferred Langmuir–Blodgett films (Fourier transform infrared spectroscopy, polarized or fluorescence spectroscopies).6,8 In particular, in our previous work a combined BAM and Langmuir films study led us to propose a squeezing out mechanism over other reported possibilities like DNA folding or multilayer formation. However, only indirect evidences were extracted from those experiments in relation with the intrinsic ODA–DNA interaction, specially in the low molecular area region where BAM images become contrastless and highly brilliant.9 Hence, in this work, we have investigated the adsorption of calf thymus DNA to octadecylamine monolayers in a more direct way by means of reflection spectroscopy. To the best of our knowledge, this technique has not been used before to characterize polynucleotides interacting with lipid monolayers. Reflection spectroscopy is a powerful tool in the investigation of orientation, adsorption and chemistry of chromophores in monolayers at the air–water-interface.24 In this technique, chromophores in the aqueous subphase do not contribute to the reflection signals from the surface. Their adsorption to lipid monolayers, however, can be easily studied by measuring the reflection spectrum of the adsorbate. Therefore, the presence of DNA at the interface has been directly demonstrated and the adsorption process to the monolayer has been characterized under lateral compression. Additionally, the amount of adsorbed polynucleotide as a function of the bulk concentration, and the adsorption kinetics have been studied using the difference in reflectivity as measuring parameter.
II. Material and methods
A. Chemicals
All chemicals are of reagent grade and have been used without further purification. Octadecylamine (ODA, 97% purity) and chloroform were supplied by Sigma Aldrich. ODA was dissolved in chloroform to a total concentration of 0.3 g l−1 solution. Calf thymus DNA was also supplied by Sigma Aldrich (lyophilized salt none detected, ≤5% protein (BCA)). DNA solutions were prepared with ultrapure water, which was purified using a Milli-pore Direct-Q system (≥18.2 MΩ cm). DNA absorbance was measured with a Cary 100Bio spectrophotometer, and its concentration was calculated assuming an extinction coefficient of 6600 M−1 cm−1 at 260 nm. Six solutions with different concentrations of DNA were prepared from a stock solution: 1.31, 2.62, 3.93, 5.24, 7.86 and 10.48 μM respectively.B. Instrumentation
Surface pressure–area isotherms were recorded in a NIMA 702BAM Langmuir trough equipped with two Teflon barriers with a total area of 982 cm2. Surface pressure was measured assuming a zero contact angle with a 10 mm wide Wilhelmy balance made with Whatmans's Chr1 chromatography paper. The trough was first cleaned with chloroform and then repeatedly rinsed with ultrapure water. The absence of surface-active contaminants was verified by compressing the bare water subphase, obtaining values of surface pressure ≤0.1 mN m−1. Then, 150 μl of the ODA solution was spread on the subphase with a microsyringe. After waiting for 10 min for solvent evaporation, the surface pressure–area isotherm is recorded with a barrier speed of 15 cm2 min−1 (1.49 Å2 per molecule per min) and the ODA isotherms were recorded first on pure water and then on DNA aqueous solutions. The reproducibility of the isotherms was tested by different measurements carried out in triplicate for independent samples.Reflection spectroscopy measurements were performed with an Accurion RefSpec2 equipment with a spectral range of 220–1000 nm. A sensor unit collimates the light to the sample surface and focuses the reflected light into the fibers that guide it to the spectrometer. A sample shutter is controlled via electronics holding a mirror that reflects the light directly to the detector fiber. It serves as a static reference to account for any lamp drift. The setup is completed with a blackplate located at the bottom of the Langmuir trough to eliminate stray light (absorbing and reflecting transmitted light out of the sensor). A single spectrum takes only less than 4 seconds to be performed. In each experiment, a number of reflection spectra were taken manually at different surface area values while the isotherms were being recorded. The selected area values were always the same in order to obtain results that could be comparable and reproducible. Series of spectra were taken in both compression and decompression cycles at surface areas ranging from 60 to 15 Å2 per ODA molecule, obtaining 30 spectra per cycle.
III. Results and discussion
A. Isotherms and hysteresis
In this section, a brief set of experiments, some of them already reported in our previous paper,9 will be conducted in order to contextualize the rest of our work. In essence, we will sketch the new but consistent results concerning the shape of the pure and mixed ODA–DNA isotherms and along with some comments on the ability of BAM to study the corresponding phase transitions. In brief, ODA isotherms were recorded on pure water and on DNA aqueous solutions as shown in Fig. 1. For pure ODA monolayers, the limiting area value (21 Å2 per molecule) and the collapse pressure (60 mN m−1) are consistent with the values found in the literature.14–17 Transition phases are not observed in this isotherm, a fact that suggests that, as the monolayer is compressed, the expanded state disappears and a direct transition from gas to a condensed phase takes place.25 However, Brewster angle microscopy (BAM)9 demonstrated that transition phases can be distinguished where the order in the monolayer is progressively increased as the area per molecule is reduced. Specifically, typical liquid–gas coexistence appears because of the more intense interactions of the ODA amine group with the water molecules. This condensation increases until the liquid expanded phase is almost reached which is accompanied by an increase in the homogeneity in the BAM images. Further compression leads to a highly condensed state with increased brightness in the images, corresponding to the maximum slope of isotherm and the maximum molecular packing. Finally, the collapse is reached at 60 mN m−1 with sudden reduction of the molecular area.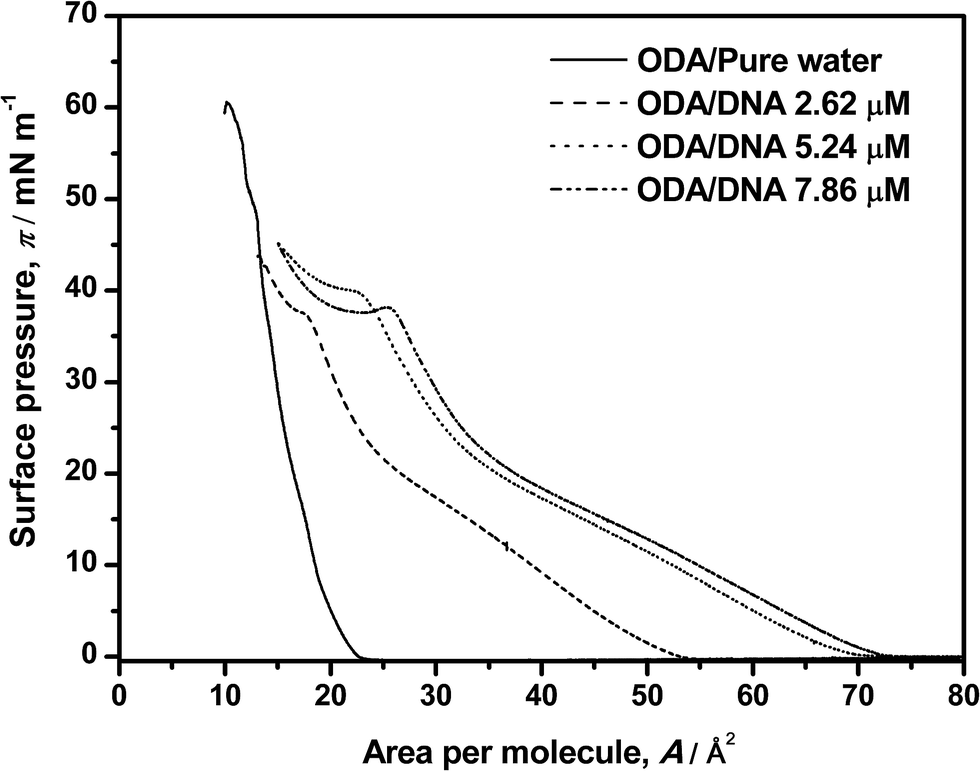 | ||
| Fig. 1 Surface pressure–area isotherms of ODA on pure water and on DNA solutions. DNA concentrations are labeled in the graph. | ||
The presence of DNA induces an increasing expansion of the ODA monolayer as the DNA concentration increases from 2.62 to 7.86 μM, as shown in Fig. 1. In this study, not only an expansion of the isotherm is reported, but also a dependence with the amount of DNA in the water subphase. A distinction of transition phases can be observed in the presence of the polynucleotide which indirectly indicates an interaction between the two components. Particularly, a liquid phase is observed in the range 0–26 mN m−1. It is more clearly discerned in the presence of DNA than in pure ODA isotherms, where transition phases occur suddenly because of a fast condensation of the ODA molecules. The amount of DNA in the subphase is also determining: the expansion of the isotherm is more significant at high DNA concentrations, indicating that the amount of DNA that interacts with ODA monolayer is higher. Moreover, the expansion process seems to reach a saturation regime at the maximum concentration of DNA that can interact with the monolayer because the same area per molecule is almost reached at 5.26 μM and 7.86 μM concentrations of DNA. These results indirectly indicate an interaction between ODA–DNA molecules and more specifically, an adsorption of DNA from aqueous subphase to the monolayer at the air–water interface. This interaction occurs because, given that the pH conditions of the present experiments are below the pK value of the ODA, the ODA molecules suffer a protonation in presence of water resulting in positive head groups (R–NH3+). This positive charge interacts with typical anionic phosphate groups of DNA, resulting in an electrostatic interaction. Moreover, the increment of DNA molecules leads also to a higher expansion of the isotherms because there are more molecules of DNA available to interact with ODA molecules. Focusing on the transition phases observed in the monolayer in the presence of DNA, it can be observed a transition from gas to liquid phase where the monolayer takes off followed by a more condensed liquid state at 26 mN m−1 where the slope of the isotherm changes again. Moreover, an additional and striking slope change take places around 40 mN m−1, where even a minimum can be observed in this region at high DNA concentrations. This could indicate another liquid–liquid transition that deserves further characterization. A similar phenomenon has been observed before by other authors1,16 being explained with different hypotheses. The most accepted explanation was proposed by Gromelski et al.1 and was that DNA could be expelled out from the monolayer at high surface pressure under compression, which indicates that the DNA molecules have to be adsorbed previously to the ODA monolayer mediated by coulombic interactions. The plateau observed at about 40 mN m−1 in our experiments, followed by an increase of the surface pressure, seems to support this hypothesis. However, the isotherm is only an indirect proof of this phenomenon and coupled characterization techniques are needed as will be shown later in this paper. In this sense, we must put the accent on the fact that our previous BAM results do not give any evidence of the observed phase transition, since the high BAM reflectivity at high pressures makes the images brilliant, homogeneous and contrastless.
The reversibility of the monolayer was also studied by compression–decompression cycles. Little hysteresis was observed when the target pressure is set below 20 mN m−1 (data not shown) and can be due to the relaxation of the components of the monolayer (DNA–ODA) or less probably, a loss of material to the water subphase.9 Setting a target surface pressure of 50 mN m−1 leads to a larger hysteresis as shown in Fig. 2, but surprisingly it is reversible. This also supports the previous hypothesis, which indicates that DNA is squeezed out from the monolayer. Moreover, these results suggest some additional information: the interaction between ODA–DNA molecules is dynamic. The presence of DNA in the monolayer leads to a change in the profile of ODA isotherm, indicating an electrostatic interaction between the two species, but this interaction can be broken at high surface pressures and the DNA is expelled out the monolayer. It must be pointed out that studying the effect of the pH is limited by the denaturation of DNA in basic solutions.26,27 In the decompression, DNA can be electrostatically adsorbed into the monolayer again because of its relaxation. Again, this effect will be seen more clearly in the reflection spectroscopy experiments.
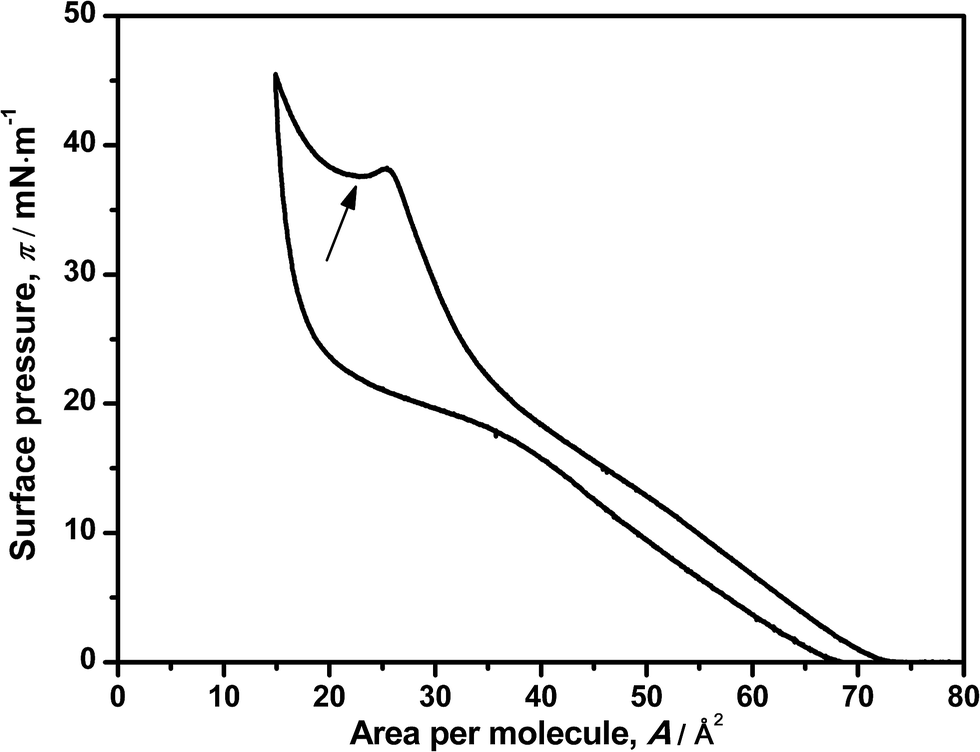 | ||
| Fig. 2 Surface pressure–area isotherm of ODA on a 7.86 μM DNA solution in a compression–decompression cycle. The local minimum of surface pressure is indicated with an arrow. | ||
B. Lateral compressibility
The lateral compressibility parameter Cs or the compressibility modulus β = 1/Cs can be used to characterize the interactions of charged biomolecules with a functionalized monolayer and changes in the interfacial packing properties.24,28 The lateral compressibility coefficient Cs can be directly calculated from the pressure–area isotherm data obtained from the monolayer compression using the following equation:28
 | (1) |
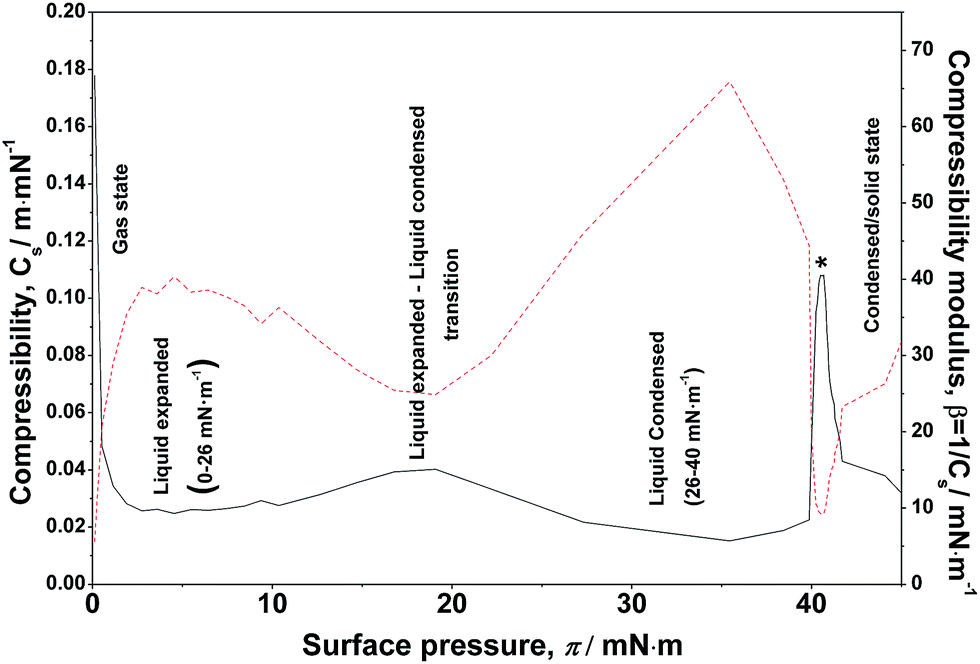 | ||
| Fig. 3 Lateral compressibility (black line) and compressibility modulus (red-dotted line) –surface pressure diagram for an ODA/DNA mixed monolayer. The DNA concentration was 7.86 μM. All states and transition phases are labeled in the graph. | ||
C. Reflection spectroscopy at the air–water interface
Direct information about the presence of DNA molecules at the air–water interface has been obtained by reflection spectroscopy.29 This technique has demonstrated to be a valuable tool to recognize the molecular organization, density and orientation of chromophore molecules located at the interface without the influence of those present in the bulk solution.30–32 Fig. 4A shows the original spectra of an ODA/DNA monolayer (DNA concentration 7.86 μm) at different surface areas and pressures in a compression–decompression cycle. A reflection peak was found around 260 nm in all cases, a clear indicative of the presence of DNA at the interface. This evidence confirms the ability of ODA to retain the polynucleotides in the monolayer. Reflection spectra of pure ODA monolayers produced negligible values (data not shown). As it can be observed, the measured reflection (ΔR) increases when the area per molecule is reduced, and the opposite effect occurs when the monolayer is decompressed. During the compression process, there is an increment in molecular density as a consequence of the reduction of surface area and therefore an increase in the spectra intensity is normally expected. This also demonstrates that the DNA molecules remain at the interface under compression. In the same way, the decompression is accompanied by a decrease in reflection intensity. It should be pointed out that the shape of the spectra does not change during compression, indicating that not remarkable changes in the DNA conformation are taking place.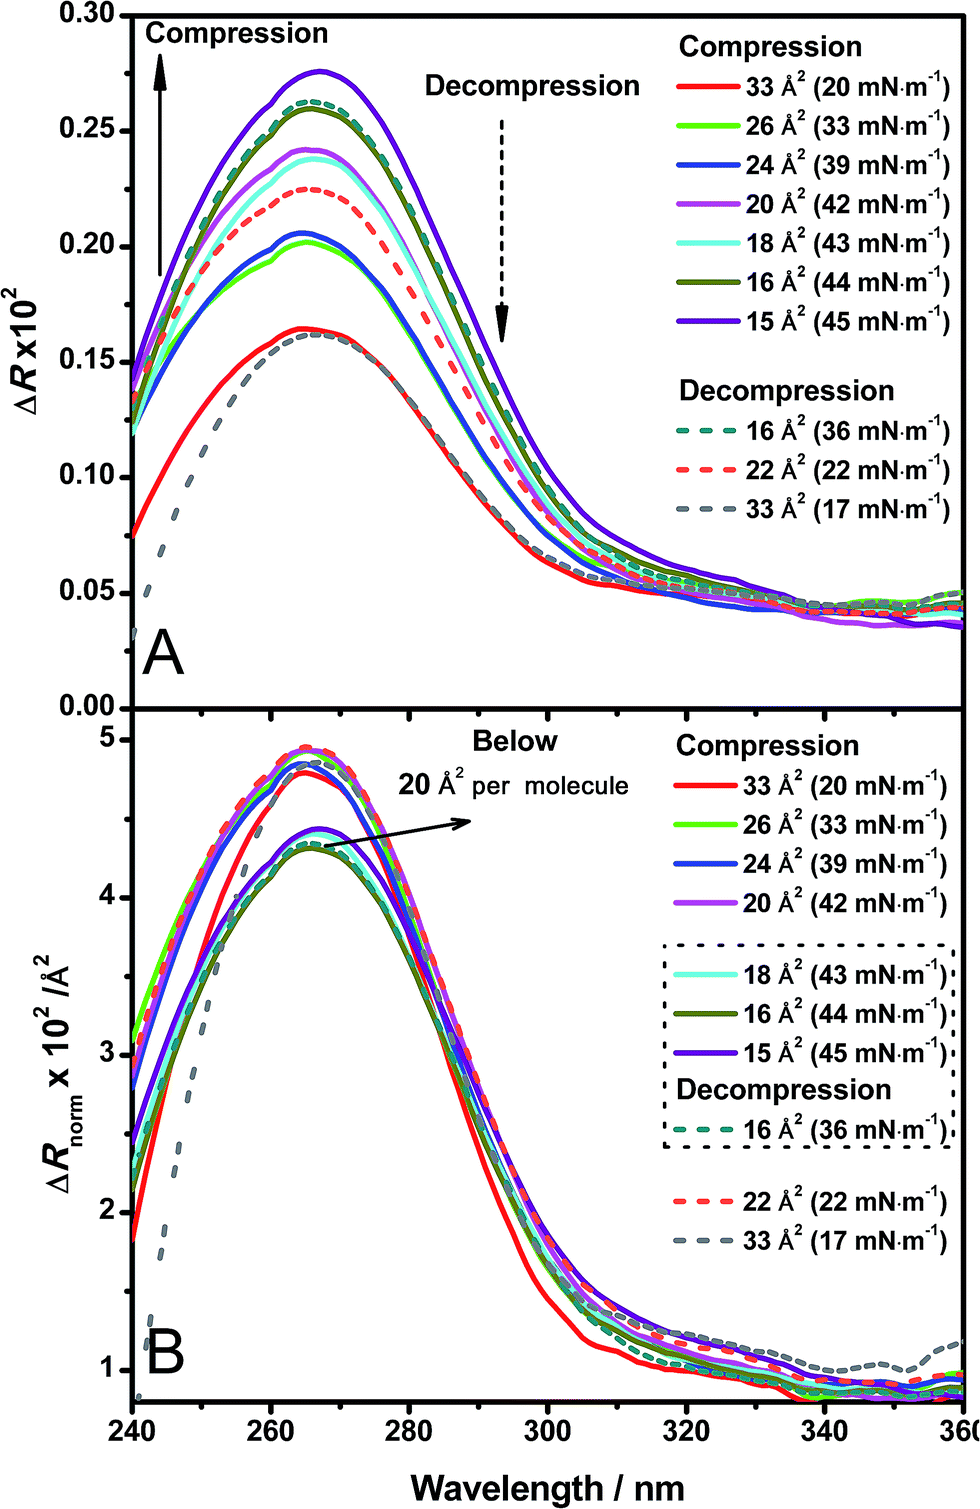 | ||
| Fig. 4 (A) Original reflection spectra of DNA adsorbed to an ODA monolayer from a 7.86 μM solution in a compression–decompression cycle from 60 to 15 Å2 per molecule. Surface pressure target was set to 50 mN m−1. Compression spectra are plotted in solid line and decompression spectra in dashed line. The surface area for each spectrum taken is labeled in the figure. Surface pressure changes in compression and decompression are also shown. (B) Normalized DNA spectra from those in (A). | ||
In order to obtain further information from the spectra under compression, the different contributions to the reflection intensity must be analyzed. For low values of absorption, the reflection ΔR observed under normal incidence of light is given in a reasonable approximation by:29
 | (2) |
After spreading the ODA molecules, the polynucleotide is adsorbed to the monolayer driven by the electrostatic interaction mediated by the positive charge of ODA molecules and the negative charge of the phosphate groups of DNA. When the monolayer is compressed, the molecular density increases while the amount of adsorbed DNA remains constant. Correspondingly, constant values of ΔRnorm are observed (Fig. 4B, spectra taken from 20 to 33 Å2 per molecule). At sufficiently high surface pressures, the ODA molecules are so densely packed that the expelling phenomenon of the polynucleotide occurs. This is reflected in the normalized spectra as an abrupt fall in ΔRnorm (Fig. 4B, spectra taken from 15 to 18 Å2 per molecule). Moreover, it should be pointed out that when the squeezing out of DNA is produced, not all the DNA molecules are expelled since the detection of the polynucleotide is still possible through reflection, although the intensity decreases. This suggests that DNA is still present in the monolayer but in a less amount, or further enough from the monolayer to cause a reduction in the normalized intensity.
The squeezing out mechanism is also supported by the reversibility of the process. During the decompression phase, the normalized reflection recovers its original value (Fig. 4B, decompression spectra) indicating that the expelled DNA molecules return to the monolayer. This reversibility is also better revealed by reflection spectroscopy than in the isotherm, with very similar values of reflection at the same surface areas in the compression and decompression phases respectively. Additionally, this optical technique can be a powerful tool in order to select the optimal transfer pressure for the deposition in immobilization experiments (before or after squeezing out in our case).
A better picture of the changes in reflection during the compression and decompression processes and its contribution to the clarification of the behavior observed in the surface pressure–area isotherm can be obtained by plotting the ΔR value versus the corresponding surface area as shown in Fig. 5 and 6. Fig. 5 shows the maximum values of the original spectra at the different surface areas during the compression and decompression cycle. As expected, the maximum intensity increases as the area per molecule is reduced. More surprisingly is the almost total coincidence of the reflection values for the compression and the decompression processes at the same surface area, directly confirming the reversibility of the system. This means that the amount of DNA bound or adsorbed to the monolayer is the same before and after the compression at any surface area. In surface pressure–area isotherms, the reversibility of the compression–decompression needs to be demonstrated by the absence of hysteresis and/or by performing a second compression following the same path that the original one. In our case, there is a strong hysteresis when the film is compressed up to 40 mN m−1 and the absence of collapse it not demonstrated (see Fig. 2). However, these uncertainties are directly unveiled when using reflection spectroscopy since the values obtained in the spectra at the same area are almost the same in the compression and decompression processes. In addition, Fig. 5 exhibits another significant feature: it has a similar shape as compared to the previous represented isotherms, including the observed transition phases.
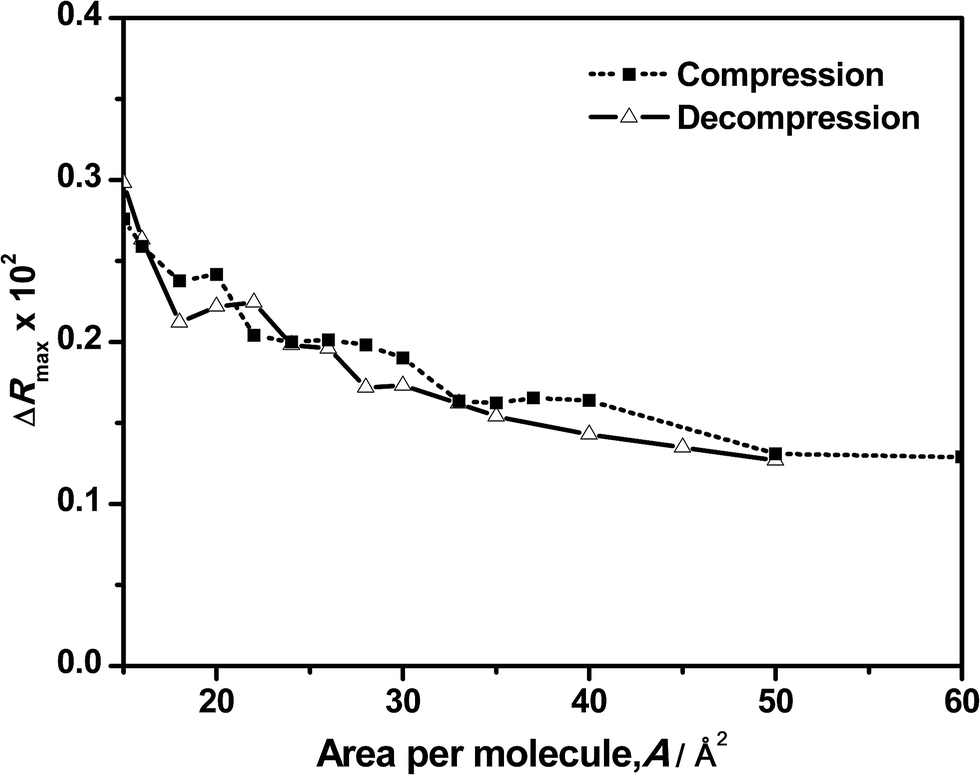 | ||
| Fig. 5 Maximum reflection intensity of original spectra vs. the corresponding area per molecule for an ODA/DNA mixed monolayer during the compression (squares) and decompression (triangles) processes. DNA concentration was set to 7.86 μM. | ||
 | ||
| Fig. 6 Maximum reflection intensity of normalized spectra vs. the corresponding area per molecule for an ODA/DNA mixed monolayer during the compression (squares) and decompression (triangles) processes. DNA concentration was set to 7.86 μM. | ||
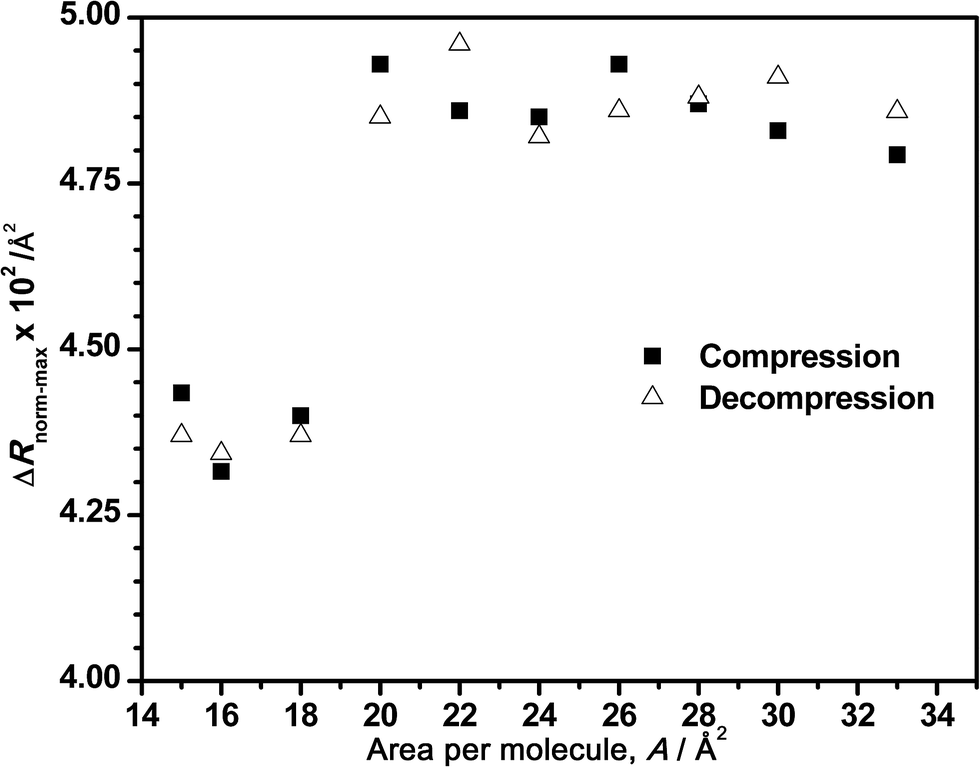
In the same way, Fig. 6 depicts the tendency of the maximum intensity of the normalized spectra versus the corresponding surface areas for a bulk concentration of 7.86 μM. As mentioned before, the normalized intensity remains almost constant during the compression (constant amount of adsorbed DNA) until the decrease that clearly starts at areas of 22–20 Å2 per molecule, where the squeezing out of the DNA begins at this DNA concentration. In addition, the intensity value increases again during the decompression, as it was observed in Fig. 4B. Although this figure only shows a general tendency of normalized spectra, the reversibility of the process is also demonstrated in Fig. 6.
D. DNA concentration dependence
The influence of the DNA bulk concentration on the ODA–DNA interaction at the interface has been analyzed in terms of adsorption equilibrium. It should be remarked that this important information is hard to obtain from the isotherm shapes alone. For this purpose, reflection spectra were recorded as a function of the DNA concentration in the subphase at constant values of surface areas. Fig. 7 shows the maximum reflection ΔRmax at increasing DNA concentrations for an ODA monolayer compressed to 60 Å2 per molecule. As can be seen, the reflection increases as the bulk concentration of the polynucleotide is increased. At a constant value of surface area, the reflection is proportional to the number of adsorbed DNA molecules as easily deduced from eqn (2). Therefore, the number of polynucleotide units bound to the ODA monolayer increases as its concentration in the subphase is increased. For small concentrations, the adsorption capacity is already high and sharply increases to reach a high value at a solution concentration of around 5 μM. For concentrations as high as 8 μM, the film starts to become saturated as it can be also inferred in Fig. 2. A similar behavior was found for other surface areas, with the saturation value following a tendency similar to that in Fig. 7 corresponding to a DNA concentration of about 8 μM.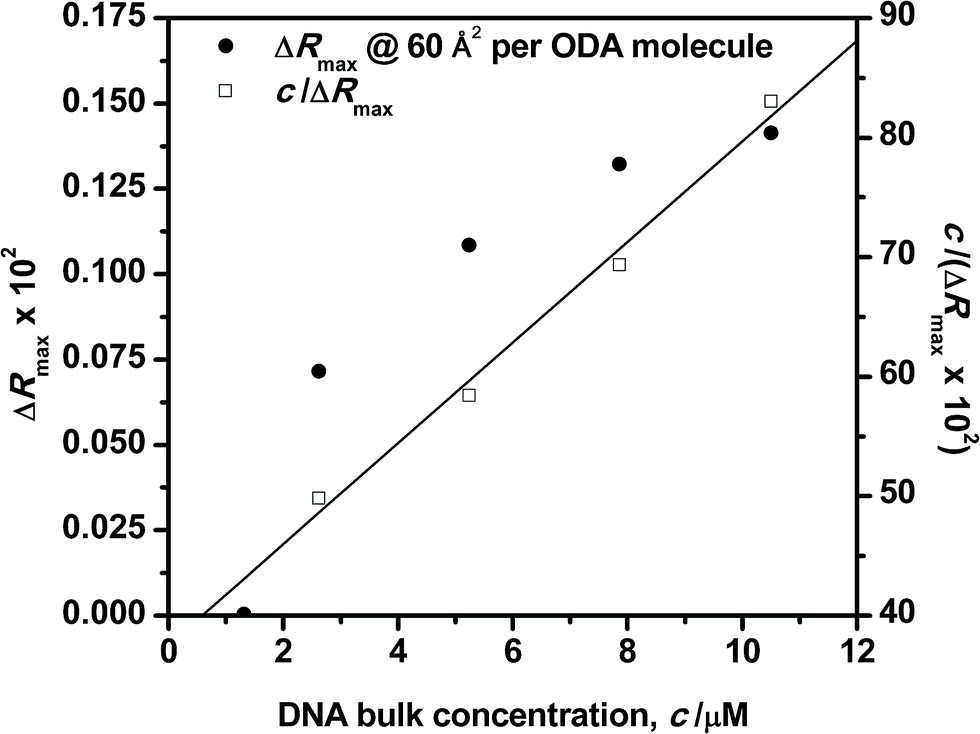 | ||
| Fig. 7 Langmuir adsorption plots for DNA solutions to the ODA monolayer. Surface area 60 Å2 per ODA molecule. | ||
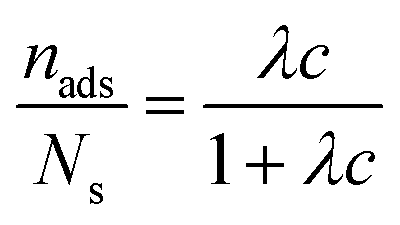
Further characterization of the DNA bulk concentration dependence of the adsorption process can be obtained by applying an isotherm adsorption model to the data points in Fig. 7. The Langmuir adsorption isotherm33 has been successfully used to account for the adsorption of different types of molecules either from gas or liquid media onto different surfaces.34–36 The Langmuir adsorption isotherm can be expressed by:
 | (3) |
E. Adsorption kinetics
Reflection spectroscopy has been also employed to study the kinetics of the adsorption process. Fig. 8 shows the time evolution of the maximum reflection ΔRmax for an ODA/DNA film (7.86 μM) keeping a constant area of 50 Å2 per molecule. This area is sufficiently high to maintain the ODA molecules in a relaxed state so that the DNA inclusion is favored.9 As can be observed, the adsorption process is characterized by an initial fast increase in the reflection followed by a slow growing of this parameter until saturation is almost reached. The first one fits very well to an exponential growth. This indicates that the probability of adsorption of a DNA molecule decreases exponentially with the number of occupied adsorption sites (or adsorbed DNA molecules) of the ODA monolayer. However, the slow process can be attributed to a rearrangement or diffusion of DNA in the mixed monolayer. We hypothesize here with a slow penetration of the polynucleotides into the ODA monolayer. This assumption is supported by the fact that the total increment of intensity in the second part of the curve is very similar to the reduction observed in Fig. 4B during the squeezing out process proposed before. After the log-linear part in Fig. 8, the normalized calculated reflection (not shown) slowly grows from 4.1 to 5.2 when the adsorption process reaches saturation. Accordingly, the intensity in Fig. 4B decreased from 5 to 4.2 during the expulsion of the DNA molecules.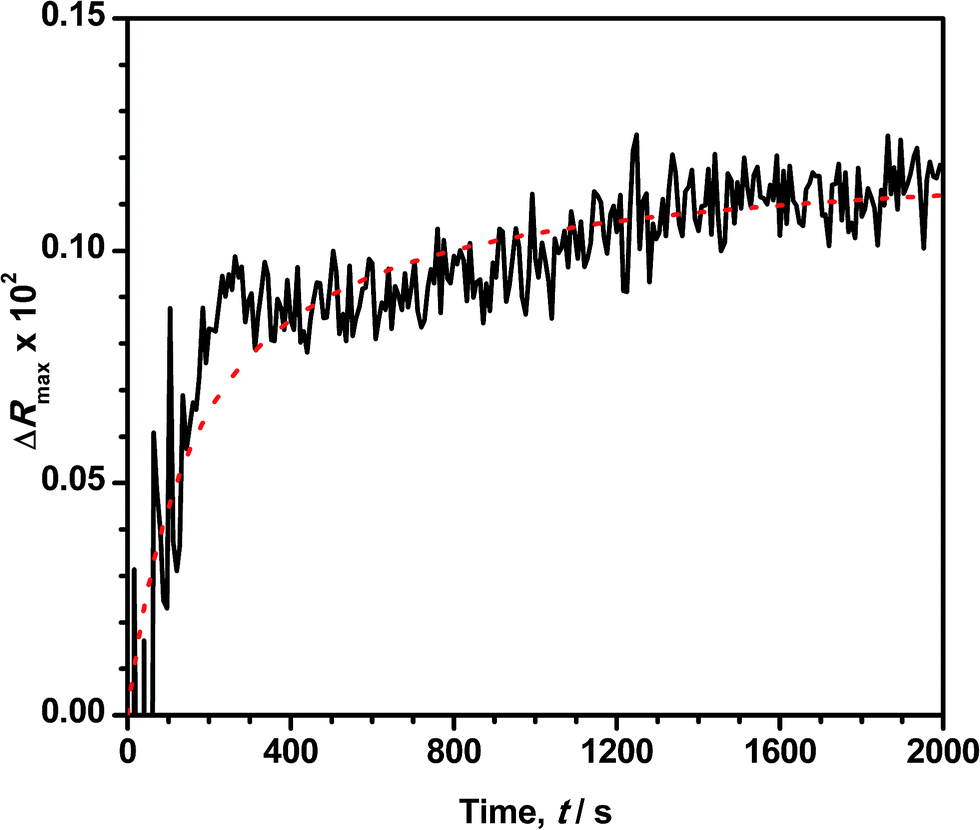 | ||
| Fig. 8 Time evolution of the reflection at the peak maximum ΔRmax of an ODA monolayer at 50 Å2 per molecule on a 7.86 μM DNA solution. The fit to the second order adsorption model is denoted with a red dotted line. | ||
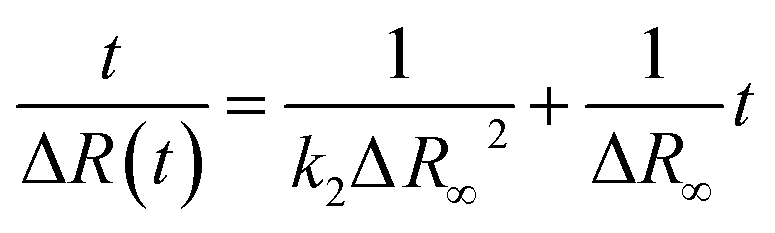
According to the observed behavior, we have used a second order kinetic model linearized in the form:
 | (4) |
IV. Conclusions
Polynucleotides and lipids interactions have been traditionally studied through Langmuir monolayers, which are considered suitable models to mimic the physical and chemical interactions at the membrane surface. However, these experiments are an indirect demonstration of the presence of the polynucleotide in the monolayer. In this paper, the complexation of ODA monolayers and negatively charged DNA at the air–water interface has been demonstrated by using UV-vis reflection spectroscopy coupled to a Langmuir trough. The results show a large expansion in the surface pressure–area isotherm of ODA and a reflection peak at 260 nm, demonstrating the adsorption of DNA to the lipid monolayer. A DNA squeezing out mechanism at high surface pressures has been proposed from the π–A isotherms and the large change observed in the lateral compressibility curve. This process has been confirmed thanks to normalization of the reflection spectra under compression with a clear reduction of this parameter at the corresponding surface areas and pressures. Moreover, the reversibility of this phenomenon during the decompression of the monolayer has been also demonstrated by this technique, in contrast to the isotherm where a large hysteresis effect is observed. The intensity of the reflection spectra has been proved to be a valuable tool in this study since it can be directly related to the surface concentration of the adsorbed polynucleotide molecules. In this sense, concentration dependence studies have shown that the DNA incorporation follows the Langmuir adsorption model. Moreover, the time evolution of the polynucleotide adsorption follows a simple pseudosecond order kinetics, with an initial fast solution-to-monolayer diffusion followed by a slow penetration process that has been quantitatively correlated to the opposite effect of expulsion observed at high surface pressures.In general, reflection spectroscopy has not been found before in the literature for this specific purpose, and it is proposed in this study as a future powerful tool in order to obtain further information about polynucleotide and phospholipids interaction, which will help in the development of the non-viral lipoplexes vectors.
Acknowledgements
Funding from Ministry of Economy and Competitiveness of Spain (MINECO), Projects MAT2014-57652-C2-2-R and PCIN-2015-169-C02-02 (under an 2014 M-Era.Net project), is gratefully acknowledged. Funding from the Operative Programme FEDER-Andalucia (Junta de Andalucía) through project P12 FQM-2310 also contributed to the present research.References
- S. Gromelski and G. Bbrezesinski, Langmuir, 2006, 22, 6293–6301 CrossRef CAS PubMed.
- C. Stefaniu, G. Brezesinski and H. Möhwald, Science, 2014, 208, 197–203 CAS.
- D. Paiva, G. Brezesinski, M. Carmo-Pereira and S. Rocha, Langmuir, 2013, 29, 1920–1925 CrossRef CAS PubMed.
- S. J. Singer and G. L. Nicolson, Science, 1972, 175, 720–731 CAS.
- Y. L. Lee, Langmuir, 1999, 15, 1796–1801 CrossRef CAS.
- V. Ramakrishnan, M. D'Costa, K. N. Ganesh and M. Sastry, J. Colloid Interface Sci., 2004, 276, 77–84 CrossRef CAS PubMed.
- S. Erokhina, T. Berzina, L. Cristofolini, O. Konovalov, V. Erokhin and M. P. Fontana, Langmuir, 2007, 23, 4414–4420 CrossRef CAS PubMed.
- M. Sastry, V. Ramakrishnan, M. Pattarkine, A. Gole and K. N. Ganesh, Langmuir, 2007, 16, 9142–9146 CrossRef.
- T. Lopes-Costa, F. Gámez, S. Lago and J. M. Pedrosa, J. Colloid Interface Sci., 2011, 354, 733–738 CrossRef CAS PubMed.
- A. Frantescu, K. Tönsing and E. Neumann, Bioelectrochemistry, 2006, 68, 158–170 CrossRef CAS PubMed.
- D. McLoughlin and D. Langevin, Colloids Surf., 2004, 250, 79–87 CrossRef CAS.
- G. Caracciolo, D. Pozzi, H. Amenitsh and R. Caminiti, Langmuir, 2005, 21, 11582–11587 CrossRef CAS PubMed.
- X. Chen, J. Wang, N. Shen, Y. Lou, L. Li, M. Liu and R. Thomas, Langmuir, 2002, 18, 6222–6228 CrossRef CAS.
- M. Sastry, V. Ramakrishnan, M. Pattarkine and K. N. Ganesh, J. Phys. Chem., 2001, 105, 4409–4414 CrossRef CAS.
- X. Hou, L. Sun, M. Xu, L. Wu and J. Shen, Colloids Surf., B, 2004, 33, 157–163 CrossRef CAS.
- G. Luque-Caballero, A. Martín-Molina, A. Y. Sánchez-Treviño, M. A. Rodríguez-Valverde, M. A. Cabrerizo-Vílchez and J. Maldonado-Valderrama, Soft Matter, 2014, 10, 2805–2815 RSC.
- M. Cárdenas, T. Nylander, B. Jönsson and B. Lindman, J. Colloid Interface Sci., 2005, 286, 166–175 CrossRef PubMed.
- A. P. Dabkowska, D. J. Barlow, L. A. Clifton and A. V. Hughes, Soft Matter, 2014, 10, 1685–1695 RSC.
- K. N. Ganesh and M. Sastry, J. Indian Inst. Sci., 2002, 82, 105–112 CAS.
- S. D. Patil and D. G. Rhodes, Biochim. Biophys. Acta, 2005, 1711, 1–11 CrossRef CAS PubMed.
- N. J. Zuidam, Y. Barenholz and A. Minsky, FEBS Lett., 1999, 457, 419–422 CrossRef CAS PubMed.
- T. Akao, T. Fukumoto, H. Ihara and A. Ito, FEBS Lett., 1996, 391, 215–218 CrossRef CAS PubMed.
- D. Simberg, D. Daninos, Y. Talmon, A. Minsky, M. E. Ferrari, C. J. Wheeler and Y. Barenholz, J. Biol. Chem., 2001, 276, 47453–47459 CrossRef CAS PubMed.
- S. L. Keller, Langmuir, 2003, 19, 1451–1456 CrossRef CAS.
- M. C. Petty, Langmuir–Blodgett: Films An Introduction, Cambridge University Press, 1996 Search PubMed.
- M. Ageno, E. Dore and C. Frontali, Biophys. J., 1969, 9(11), 1281–1311 CrossRef CAS PubMed.
- C. Hansda, S. A. Hussain, D. Bhattacharjee and P. Kr. Paul, Surf. Sci., 2013, 617, 124–131 CrossRef CAS.
- D. L. Thomas, L. J. Blum and A. P. Girard-Egrot, Biosens. Bioelectron., 2005, 20, 1539–1548 CrossRef CAS PubMed.
- H. Grüniger, D. Möbius and H. Meyer, J. Chem. Phys., 1983, 79, 3701–3710 CrossRef.
- J. M. Pedrosa, C. M. Dooling, T. H. Richardson, R. K. Hyde, C. A. Hunter, M. T. Martín and L. Camacho, Langmuir, 2002, 12, 2659–2664 CAS.
- R. C. Ahuja, P. L. Caruso, D. Möbius, G. Wildburg, H. Ringsdorf, D. J. Philp, A. Preece and J. F. Stoddart, Langmuir, 1993, 9, 1534–1544 CrossRef CAS.
- M. T. Martín, I. Prieto, L. Camacho and D. Möbius, Langmuir, 1993, 12, 6554–6560 CrossRef.
- I. Langmuir, J. Am. Chem. Soc., 1918, 40, 1361–1403 CrossRef CAS.
- C. M. Dooling, O. Worsfold, T. H. Richardson, R. Tregonning, M. O. Vysotsky, C. A. Hunter, K. Kato, K. Shinbo and F. Kaneko, J. Mater. Chem., 2001, 11, 392–398 RSC.
- B. Chague, J. P. Germain, C. Maleysson and H. Robert, Sens. Actuators, 1985, 7, 199–207 CrossRef CAS.
- S. Goldberg, Plant, 1997, 193, 35–48 CAS.
| This journal is © The Royal Society of Chemistry 2017 |