 Open Access Article
A graphene quantum dot/phthalocyanine conjugate: a synergistic catalyst for the oxygen reduction reaction†
Ki Hwan Koha,
Sung Hyun Noha,
Tae-Hyun Kimb,
Won Jun Lee c,
Sung-Chul Yi*b and
Tae Hee Han
 *a
*a
aDepartment of Organic and Nano Engineering, Hanyang University, 222 Wangsimni-Ro, 04763, Seoul, Republic of Korea. E-mail: than@hanyang.ac.kr
bDepartment of Chemical Engineering, Hanyang University, 222 Wangsimni-Ro, 04763, Seoul, Republic of Korea. E-mail: scyi@hanyang.ac.kr
cDepartment of Chemistry, Imperial College London, London, SW7 2AZ, UK
First published on 16th May 2017
Abstract
Graphene quantum dots (GQDs) have gained great interest due to their chemical stabilities, unique catalytic activities, and feasible chemical functionalization opportunities; these have opened up new applications in the fields of chemical energy conversion and storage. Herein, we synthesized iron(II) phthalocyanine (FePC)–GQD conjugates as facile electrocatalysts for the enhanced oxygen reduction reaction (ORR), which is critical in energy conversion systems of fuel cells. This unique combination of materials (GQD–FePC) exhibits a greatly enhanced onset potential via a four-electron pathway in an alkaline electrolyte. Moreover, the synthesized electrocatalyst shows distinguished tolerance toward methanol and carbon monoxide, which paves the way for its commercialization as an electrocatalyst.
Introduction
Graphene-based quantum dots (GQDs) have been extensively investigated due to their various advantages including easy synthesis procedures, non-toxicity, chemical/physical stability, and controllable chemical functionality.1 Interestingly, GQDs can significantly lower the oxygen adsorption barrier and the first electron transfer barrier, and provide enhanced electrocatalytic activity for the oxygen reduction reaction (ORR) due to the increased portion of electrocatalytically active edge sites.2 Therefore, GQDs are gathering huge research interest as an efficient alternative to Pt-based electrocatalysts for the ORR.3 However, challenges such as low limiting current density and onset potential still exist.4 Of course, to compete with Pt-based catalysts, the intolerance to fuel crossover from the anode,5 deactivation by CO poisoning effect, and electrochemical stability, which is often found in the conventional catalysts, should be overcome.6The hybridization of GQDs with other functional materials represents a potential strategy that can be used to improve their catalytic properties.7 In particular, iron(II) phthalocyanine (FePC) is one of the promising nanomaterials among nonprecious-metal category that can be used as an electrocatalyst for the ORR.8–11 FePC has a conjugated macrocyclic structure with azo and pyrrolic nitrogen atoms.12 Therefore, conjugation with GQDs would be beneficial for enhancing the electrocatalytic performance. In addition, as demonstrated with volcano theory, the introduction of nitrogen in graphene materials is beneficial to enhance the electrocatalytic performance for ORR.13,14 Doped nitrogen increases the charge density of graphene and results in a better affinity of graphene with oxygen and an enhanced ability to weaken the O–O bonding on the surface of catalysts, indicating the reduced overpotential, and better electrocatalytic performance for ORR.15
In this work, we covalently functionalized GQDs with FePC by a facile ferric chloride reaction in order to improve the ORR performance. Electrochemical measurements showed that GQDs functionalized with iron phthalocyanine (GQD–FePC) exhibited enhanced electrocatalytic activity with an electron transfer number of 3.8 in an alkaline medium; this indicates a direct four-electron pathway to OH−.16 GQD–FePC also showed great tolerance to methanol crossover and the CO poisoning effect compared with a commercial Platinum–Carbon (Pt/C) catalyst, which suggests that GQD–FePC could be used as an alternative electrocatalyst to commercial Pt/C in fuel cells.
Experimental
Materials
Pt/C was purchased from Alfa Aesar (platinum, nominally 20% on carbon black, HiSPECTM 3000). FePC, ammonium hydroxide solution (30%), and ethanol (99.5%) were purchased from Sigma-Aldrich. Hydrogen peroxide (Guaranteed Reagent, 99.3%) and dimethyl sulfoxide (DMSO, Guaranteed Reagent, 99%) were purchased from Junsei. No further purification was done, and all chemical were used as received.Preparation of GQDs, and conjugate of GQD with FePC
Graphene oxide (GO) (400 mg) was first prepared using the modified Hummers' method, as reported previously.17 Then, 400 mg of GO powders were dispersed in a 200 mL solution of NH4OH/H2O2/DIW (1![[thin space (1/6-em)]](https://www.rsc.org/images/entities/char_2009.gif) :
:![[thin space (1/6-em)]](https://www.rsc.org/images/entities/char_2009.gif) 2
2![[thin space (1/6-em)]](https://www.rsc.org/images/entities/char_2009.gif) :
:![[thin space (1/6-em)]](https://www.rsc.org/images/entities/char_2009.gif) 20 by volume). This solution then underwent a hydrothermal treatment in a closed vessel at 150 °C for 5 h. The final product (GQDs powder) was obtained after freeze-drying.17 GQD–FePC was synthesized by a ferric chloride test reaction. For this, 9 mg of GQDs, 1 mg of FePC, and 10 μL of pyridine were added into 10 mL of DMSO. This mixture was stirred and reacted for 20 min at room temperature. During the reaction, the mixture colour was changed from blue to green. Conjugated materials were obtained by freeze-drying after washing.
20 by volume). This solution then underwent a hydrothermal treatment in a closed vessel at 150 °C for 5 h. The final product (GQDs powder) was obtained after freeze-drying.17 GQD–FePC was synthesized by a ferric chloride test reaction. For this, 9 mg of GQDs, 1 mg of FePC, and 10 μL of pyridine were added into 10 mL of DMSO. This mixture was stirred and reacted for 20 min at room temperature. During the reaction, the mixture colour was changed from blue to green. Conjugated materials were obtained by freeze-drying after washing.
Characterization
Morphologies of the GQDs, FePC aggregates, and GQD–FePC conjugated materials were characterized via transmission electron microscopy (TEM; JEOL, JEM-2100F) operated at an accelerating voltage of 200 kV. TEM samples were prepared on lacy-carbon TEM grids (Ted Pella, Inc.). X-ray photoelectron spectroscopy (XPS) measurements were performed with an XPS spectrometer (Thermo Fisher Scientific, Theta probe) using a monochromic Al Kα radiation X-ray source. Fourier-transform infrared spectroscopy (FT-IR) analyses were carried out using a Thermo Fisher Scientific Co. Nicolet 6700 with KBr pellets. A UV-vis spectrometer (Analytik Jena, Specord200) was used to obtain the UV-vis absorption between 300 and 800 nm at a resolution of 1 nm.Electrochemical measurements
Electrochemical analysis, including cyclic voltammetry (CV), linear sweep voltammetry (LSV), and chronoamperometry (used to evaluate the ORR activity and stability of the prepared catalysts), were carried out using a computer-controlled potentiostat (SP-200, Bio-Logic SAS instrument, France) with a typical three-electrode cell possessing a gas flow system; these tests were performed in an O2− saturated 0.1 M KOH electrolyte at 30 °C. A platinum wire and Hg/HgO were used as the counter electrode and the reference electrode, respectively. The working electrodes were prepared by drop-casting 10 μL of GQDs and GQD–FePC suspensions in DMSO (1 mg mL−1) onto the glassy carbon electrode surface (GC, 5 mm diameter, Pine Instrument Co.). The electrodes were dried in a vacuum oven at 90 °C for 6 h, treated with 5 μL of a 5 wt% Nafion solution, and dried in ambient conditions. For a comparison with commercial Pt/C catalysts for the ORR, a Pt/C catalyst ink was also prepared in ethanol (1 mg mL−1). Then, 10 μL of the Pt/C catalyst ink was introduced onto the glassy carbon electrode surface. The electrode was subsequently dried at ambient conditions and then coated with a Nafion solution. The rotating disk electrode (RDE) test was performed with an electrode rotator (modulated speed rotator, Pine Instrument Co.).Results and discussion
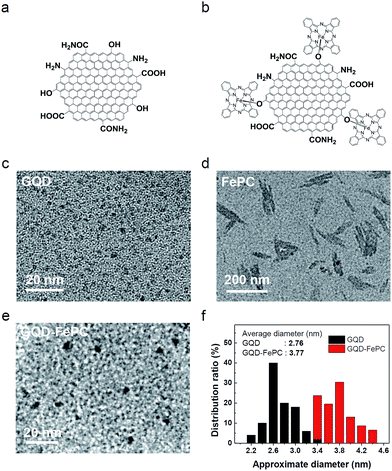
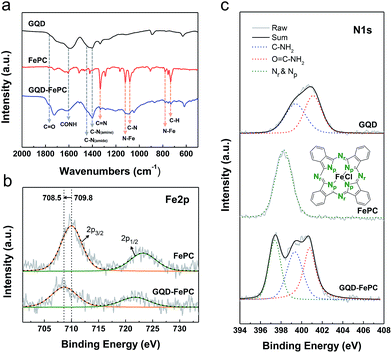
The schematic structures of GQDs and GQD–FePC are illustrated in Fig. 1. The GQDs synthesized by the hydrothermal reaction are naturally decorated with the oxygen- and nitrogen-containing functional groups, including carbonyl, hydroxyl, amine, and amide groups,17 as shown Fig. 1a. These nitrogen atoms, which are chemically bonded with carbon atoms, not only influence the optical properties of GQDs, but also alter the electronic characteristics by contributing more electrocatalytic active sites.4 In addition, the oxygen-containing functional groups of GQDs provide reaction sites for hybridization with other nanomaterials.18 In this study, GQDs were functionalized with FePC in order to take advantage of the synergistic effects on the ORR activity. Conjugation of GQDs with FePC (Fig. 1b) was readily achieved by the ferric chloride reaction, as detailed in Fig. S1.† The morphologies of the GQDs, FePC, and GQDs–FePC were analyzed by TEM. Fig. 1c shows the appearance of GQDs with an average lateral size of 2.76 nm and a typical GQD morphology. This zero-dimensional structure provides much more electrocatalytic active sites than the larger graphene due to the charge polarization of edge carbon atoms.2 However, FePC molecules formed anisotropic aggregates (Fig. 1d and S2†). This is caused by the self-assembly of FePC. This assembly behaviour induces an inevitable decrease in the active site area, which eventually results in performance degradation.19–21 Interestingly, the GQD–FePC conjugates (Fig. 1e) did not have rod-shaped morphologies, but mainly showed dot-like shapes as the representative morphology. As shown in Fig. 1f, the size of the hybrid materials was slightly increased to 3.77 nm after conjugation, indicating the successful hybridization and molecular-level dispersion of GQDs and the hybrid form.FT-IR spectra were measured to investigate the chemical properties of GQDs, FePC, and GQD–FePC. As shown in Fig. 2a, the five major peaks of GQDs (black line) appeared at 1335, 1402, 1436, 1606, and 1766 cm−1; these correspond to the vibration modes of C–N stretching (amine and amide) and C![[double bond, length as m-dash]](https://www.rsc.org/images/entities/char_e001.gif) O stretching (amide and carboxylic acid), respectively.17 Theses typical peaks of GQDs indicate that the as-prepared GQDs already possess several types of the nitrogen-containing functional groups. In the case of FePC (red line), the presence of strong peaks was observed at 732 cm−1 (for C–H out-of-plane bending vibration), 754 cm−1 (for benzene and isoindole in-plane deformation), and 781 cm−1 (for Fe–N stretching).22 Other representative peaks of FePC were observed at 1079, 1120, 1332, and 1513 cm−1. These were assigned to C–N stretching, Fe–N stretching (pyrrole), C
O stretching (amide and carboxylic acid), respectively.17 Theses typical peaks of GQDs indicate that the as-prepared GQDs already possess several types of the nitrogen-containing functional groups. In the case of FePC (red line), the presence of strong peaks was observed at 732 cm−1 (for C–H out-of-plane bending vibration), 754 cm−1 (for benzene and isoindole in-plane deformation), and 781 cm−1 (for Fe–N stretching).22 Other representative peaks of FePC were observed at 1079, 1120, 1332, and 1513 cm−1. These were assigned to C–N stretching, Fe–N stretching (pyrrole), C![[double bond, length as m-dash]](https://www.rsc.org/images/entities/char_e001.gif) N stretching (pyrrole rings), and isoindole stretching (in the plane of the FePC macrocycle), respectively.22 These major peaks of FePC were also present in the GQD–FePC hybrid materials (blue line), indicating the additional introduction of nitrogen into the GQDs.
N stretching (pyrrole rings), and isoindole stretching (in the plane of the FePC macrocycle), respectively.22 These major peaks of FePC were also present in the GQD–FePC hybrid materials (blue line), indicating the additional introduction of nitrogen into the GQDs.
To directly elucidate the bonding properties of GQD–FePC, XPS was employed. The high-resolution Fe 2p spectra of FePC and GQD–FePC are presented in Fig. 2b. The Fe 2p3/2 core level spectrum of FePC has a peak at 709.8 eV. After conjugation, the Fe 2p peak was shifted to a lower binding energy of 708.5 eV. This shift is due to the altered electronic structure after the formation of GQD–FePC owing to electron transfer behaviour.23 Among a variety of metal-cored phthalocyanine molecules, FePC shows a relatively strong electron withdrawing ability.24 Therefore, after conjugation with GQDs, the more electrons transfer from electron-rich GQD to FePC25 and it induces the charge density gradient between GQD and FePC.15 As being often observed when graphene is doped with nitrogen, this type of charge transfer narrows the bandgap of GQDs and subsequently improves the electrocatalytic activity of GQDs.15,26 In the narrow scan of the N 1s spectra of GQDs, FePC, and GQD–FePC (Fig. 2c), various nitrogen functional groups are shown. Three representative nitrogen functional groups in Fig. 2c show the amine group (blue line), amide group (red line), and azo and pyrrolic nitrogen of FePC (green line).27 The N 1s spectrum of GQDs was deconvoluted into amine and amide groups centered at 399.4 and 300.6 eV,17 respectively, while only azo and pyrrolic nitrogen were observed in FePC.22 After the functionalization of GQDs with FePC, all of the nitrogen types were observed in the N 1s spectrum of GQD–FePC. In addition, as can be observed in the N 1s spectra of FePC and GQD–FePC, the peaks of azo and pyrrolic nitrogen for GQD–FePC were shifted to lower values by 0.9 eV compared with those of FePC; this follows the same principles as the Fe 2p peak shift. Detailed information about the N 1s spectra, including the atomic percentage and the components of each material, is summarized in Table 1. When GQDs were functionalized with FePC, an obvious increase in the N 1s atomic percentage (from 9.76% to 11.56%) was directly observed. Based on the XPS characterization, the GQD–FePC hybrid materials have an average of 2.3 FePC molecules per GQD molecule.
| Name | N 1s (atm%) | Components of N 1s |
|---|---|---|
| GQDs | 9.76 | Amine (C–NH2), amide (O![[double bond, length as m-dash]](https://www.rsc.org/images/entities/char_e001.gif) C–NH2) C–NH2) |
| FePC | 17.75 | Azo N (Nr), pyrrolic N (Np) |
| GQD–FePC | 11.56 | Amine (C–NH2), amide (O![[double bond, length as m-dash]](https://www.rsc.org/images/entities/char_e001.gif) C–NH2), azo N (Nr), pyrrolic N (Np) C–NH2), azo N (Nr), pyrrolic N (Np) |
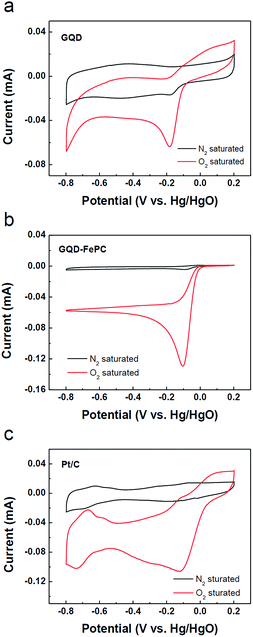
The electrocatalytic activity of the GQDs and GQD–FePC catalysts for the ORR was examined by CV in a 0.1 M KOH electrolyte solution saturated with either N2 or O2, as shown in Fig. 3. For comparison, a Pt/C electrode was also prepared and tested under the same conditions. As shown in Fig. 3a–c, weak cathodic current peaks for reduction are observed for all samples in the N2-saturated electrolyte; this is attributed to the intrinsic redox peaks.19 In contrast, obvious cathodic current peaks are observed in the O2-saturated electrolyte, indicating the abilities of each catalyst to electrochemically catalyze the ORR. For the GQD catalyst, the ORR peak appears at −0.18 V vs. Hg/HgO. After the functionalization of GQDs with FePC, the ORR peak of GQD–FePC positively shifts to −0.1 V vs. Hg/HgO, and the oxygen reduction current was measured to be −0.13 mA; this is more than two times larger than that of the GQDs.23 This enhancement is mainly due to charge transfer behavior from GQD to electronegative FePC.15,26
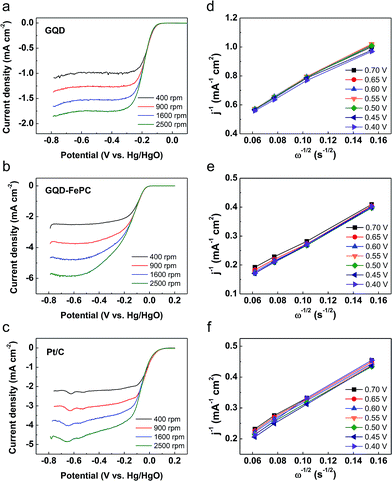
To obtain further insight into the electrocatalytic activity differences for the ORR on GQDs and GQD–FePC, LSV measurements on RDE system were performed in an O2-saturated 0.1 M KOH electrolyte at a scan rate of 20 mV s−1 with various rotating speeds from 400 to 2500 rpm. Fig. 4a–c show the LSV polarization curves of GQDs, GQD–FePC, and Pt/C, respectively. The limiting current densities show a general increase with an increase in the rotating speed due to the improved diffusion of the electrolyte.28 To investigate the electrocatalytic efficiency of GQDs, GQD–FePC, and Pt/C, Koutecky–Levich (K–L) plots were derived from the LSV polarization curves (from Fig. 4a–c).29 The linearity and parallelism of the K–L plots of Fig. 4d–f show a first-order reaction with regard to the dissolved oxygen and the electron transfer number for the ORR at each potential.30 For a clearer comparison between catalysts, the LSV curves at 1600 rpm are presented in Fig. 5a. The onset potential of GQDs for the ORR was approximately −0.13 V vs. Hg/HgO, while a substantial positive shift to −0.04 V vs. Hg/HgO was observed for GQD–FePC. This improved onset potential is attributed to the charge transfer, enhancing the first electron rate which is the main contributor for high onset potential.15,26 The limiting current of GQD–FePC for the ORR was calculated to be −4.68 mA cm−2, which is 2.8 times higher than that of GQDs (−1.65 mA cm−2). These results show that the introduction of FePC into GQDs significantly enhances the off-limiting current density for the ORR compared to pure GQDs. These results agree with the CV analysis and further confirm that additional nitrogen can considerably improve the ORR catalytic activity. The number of transferred electrons is an important parameter related to the electrocatalytic activity for the ORR. The direct four-electron oxygen reduction process is known to be favorable due to its high efficiency and non-corrosive product.31 The number of transferred electrons per oxygen molecule related to the oxygen reduction of GQDs, GQD–FePC, and Pt/C is estimated by the K–L equation32 shown below:
 | (1) |
| B = 0.62nFCO2(DO2)2/3v−1/6 | (2) |
| JK = nFkCO2 | (3) |
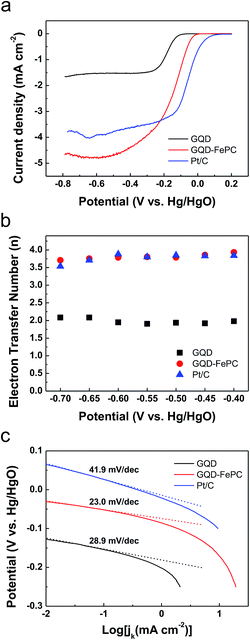 | ||
| Fig. 5 (a) LSV, (b) the electron transfer number, and (c) Tafel plots for ORR of GQDs, GQD–FePC, and Pt/C, respectively. LSV was originated by Fig. 4a–c with RDE rotation rates of 1600 rpm. The electron transfer numbers were defined at various potentials based on Koutecky–Levich plots. Tafel plots for ORR of each material in 0.1 M O2-saturated KOH electrolyte were derived from (a). | ||
Furthermore, using the calculated kinetic current density from the K–L equation, the Tafel plots for GQDs, GQD–FePC and Pt/C catalysts were derived at low overpotentials of Fig. 5a.36 As shown in Fig. 5c, the Tafel slope of Pt/C and GQDs were 41.9 and 28.9 mV dec−1, respectively, implying the higher inherent electrocatalytic activity of GQDs for ORR. After forming conjugates with FePC, the Tafel slope of GQDs was reduced to 23.0 mV dec−1. This result reveals that the transfer of the first electron on both GQDs and GQD–FePC catalysts is the rate determining step under Temkin conditions for the adsorption of intermediates29 and the addition of FePC on GQD significantly influenced the overall ORR mechanism, and thus improved the electrocatalytic activity.
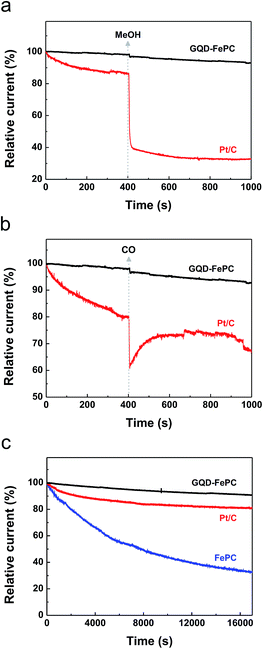
Due to the potential of GQD–FePC to be used as electrocatalysts for the ORR and replace commercial Pt/C catalysts, we further demonstrated the possible crossover of methanol, the carbon monoxide (CO) poisoning effect, and electrochemical stability, which are other challenges currently faced by Pt-based catalysts in fuel cells.19,37 Accordingly, chronoamperometric measurements were carried out at −0.20 V in an O2-saturated 0.1 M KOH electrolyte at a rotation rate of 1600 rpm for 1000 s, and 3.0 M methanol and CO were then added into the electrolyte at 400 s, and durability test of GQD–FePC, FePC, and Pt/C were carried out for 17 000 s. The corresponding chronoamperometric responses are shown in Fig. 6a–c respectively. In Fig. 6a, when GQD–FePC were exposed to methanol, the ORR current for GQD–FePC remained almost unchanged. However, a sharp decrease in the ORR current (by about 45%) for Pt/C was observed, indicating that the electrochemical oxidation of methanol is preferred relative to the reduction of oxygen in the case of the Pt/C catalysts.
To investigate the effect of CO on the electrocatalytic activity of GQD–FePC, 0.1 M KOH saturated with CO was injected into the electrolyte during the chronoamperometric measurements. As shown in Fig. 6b, the ORR current for Pt/C sharply decreased by about 20% as a result of CO poisoning. It shows that CO molecules were adsorbed onto the platinum surface. This resulted in a significant decrease in the number of electrocatalytic active sites for platinum due to the high chemical affinity of the CO molecule with platinum.6 Unlike Pt/C, the ORR current for GQD–FePC shows only a small decrease due to the reduced solubility of O2 in the electrolyte, which is caused by the diminished partial pressure of O2. This indicates that GQD–FePC should have no reactivity with CO in nature.
The electrochemical stability of GQD–FePC, FePC, and Pt/C are shown in Fig. 6c. After the durability test for 17![[thin space (1/6-em)]](https://www.rsc.org/images/entities/char_2009.gif) 000 s, FePC showed a significantly degraded current of 33.1% of its initial value during the measurement. After the hybridization with GQD, our GQD–FePC was able to retain 90.6% due to the synergistic effect by the covalent bonding between GQD and FePC. Furthermore, the value of 90.6% of GQD–FePC is definitely higher than that of 80.7% for commercial Pt/C catalyst indicating the better electrochemical stability of GQD-FePC. The stability results of GQD–FePC were compared to other previously reported researches in Table S2† and showed the higher stability value among them. Thus, since the electrocatalytic performance of GQD–FePC demonstrated excellent stability in terms of methanol crossover, CO poisoning effect, and electrocatalytic performance, their prospective potential for the replacement of commercial Pt/C is expected.
000 s, FePC showed a significantly degraded current of 33.1% of its initial value during the measurement. After the hybridization with GQD, our GQD–FePC was able to retain 90.6% due to the synergistic effect by the covalent bonding between GQD and FePC. Furthermore, the value of 90.6% of GQD–FePC is definitely higher than that of 80.7% for commercial Pt/C catalyst indicating the better electrochemical stability of GQD-FePC. The stability results of GQD–FePC were compared to other previously reported researches in Table S2† and showed the higher stability value among them. Thus, since the electrocatalytic performance of GQD–FePC demonstrated excellent stability in terms of methanol crossover, CO poisoning effect, and electrocatalytic performance, their prospective potential for the replacement of commercial Pt/C is expected.
Conclusions
In summary, we prepared iron phthalocyanine-functionalized graphene quantum dots via a facile ferric chloride reaction as a novel and efficient non-precious electrocatalyst. This successful functionalization not only prevents the aggregation of FePC, which can significantly decrease the activity, but also introduces additional nitrogen to GQDs, which can alter the electron structure of GQDs and modify the band gap. GQD–FePC showed high electrocatalytic activity for the ORR in an alkaline electrolyte via the direct four-electron reaction. These possess an improved onset potential, a higher limiting current density than Pt/C, and notable methanol tolerance, insensitivity to CO poisoning and electrochemical stability. Thus, GQD–FePC have the potential to be used as efficient non-precious electrocatalysts for the ORR and may be used in commercial applications of fuel cells.Conflict of interest
The authors declare no competing financial interest.Acknowledgements
K. H. Koh, S. H. Noh, T. H. Kim contributed equally to this work. This research was financially supported by Defense Acquisition Program Administration and Agency for Defense Development under the contract UD120080GD.Notes and references
- Z. Zhang, J. Zhang, N. Chen and L. Qu, Energy Environ. Sci., 2012, 5, 8869–8890 CAS.
- D. Deng, L. Yu, X. Pan, S. Wang, X. Chen, P. Hu, L. Sun and X. Bao, Chem. Commun., 2011, 47, 10016–10018 RSC.
- Y. Liu and P. Wu, ACS Appl. Mater. Interfaces, 2013, 5, 3362–3369 CAS.
- Y. Li, Y. Zhao, H. Cheng, Y. Hu, G. Shi, L. Dai and L. Qu, J. Am. Chem. Soc., 2012, 134, 15–18 CrossRef CAS PubMed.
- G. Zhang, B. Y. Xia, X. Wang and X. W. David Lou, Adv. Mater., 2014, 26, 2408–2412 CrossRef CAS PubMed.
- L. Dai, Y. Xue, L. Qu, H. J. Choi and J. B. Baek, Chem. Rev., 2015, 115, 4823–4892 CrossRef CAS PubMed.
- X. Zhou, Z. Tian, J. Li, H. Ruan, Y. Ma, Z. Yang and Y. Qu, Nanoscale, 2014, 6, 2603–2607 RSC.
- R. Baker, D. P. Wilkinson and J. Zhang, Electrochim. Acta, 2008, 53, 6906–6919 CrossRef CAS.
- H. Yang, Y. Zhang, F. Hu and Q. Wang, Nano Lett., 2015, 15, 7616–7620 CrossRef CAS PubMed.
- S. J. Rowley-Neale, J. M. Fearn, D. A. C. Brownson, G. C. Smith, X. Ji and C. E. Banks, Nanoscale, 2016, 8, 14767–14777 RSC.
- R. Zhang, C. Zhang and W. Chen, J. Mater. Chem. A, 2016, 4, 18723–18729 CAS.
- A. B. Sorokin, Chem. Rev., 2013, 113, 8152–8191 CrossRef CAS PubMed.
- Z. Zhao, M. Li, L. Zhang, L. Dai and Z. Xia, Adv. Mater., 2015, 27, 6834–6840 CrossRef CAS PubMed.
- H. Wang, T. Maiyalagan and X. Wang, ACS Catal., 2012, 2, 781–794 CrossRef CAS.
- L. Qu, Y. Liu, J.-B. Baek and L. Dai, ACS Nano, 2010, 4, 1321–1326 CrossRef CAS PubMed.
- Y. Zheng, Y. Jiao, M. Jaroniec, Y. Jin and S. Z. Qiao, Small, 2012, 8, 3550–3566 CrossRef CAS PubMed.
- H. Park, S. H. Noh, J. H. Lee, W. J. Lee, J. Y. Jaung, S. G. Lee and T. H. Han, Sci. Rep., 2015, 5, 14163–14172 CrossRef CAS PubMed.
- M. C. Hsiao, S. H. Liao, M. Y. Yen, P. I. Liu, N. W. Pu, C. A. Wang and C. C. M. Ma, ACS Appl. Mater. Interfaces, 2010, 2, 3092–3099 CAS.
- Y. Jiang, Y. Lu, X. Lv, D. Han, Q. Zhang, L. Niu and W. Chen, ACS Catal., 2013, 3, 1263–1271 CrossRef CAS.
- G. Dong, M. Huang and L. Guan, Phys. Chem. Chem. Phys., 2012, 14, 2557–2559 RSC.
- M. Li, X. Bo, Y. Zhang, C. Han and L. Guo, Journal of J. Power Sources, 2014, 264, 114–122 CrossRef CAS.
- G. Yuan, G. Zhang, Y. Zhou and F. Yang, RSC Adv., 2015, 5, 26132–26140 RSC.
- R. Cao, R. Thapa, H. Kim, X. Xu, M. G. Kim, Q. Li, N. Park, M. Liu and J. Cho, Nat. Commun., 2013, 4, 2076–2083 Search PubMed.
- M.-S. Liao and S. Scheiner, J. Chem. Phys., 2001, 114, 9780–9791 CrossRef CAS.
- B. Zheng, C. Wang, X. Xin, F. Liu, X. Zhou, J. Zhang and S. Guo, J. Phys. Chem. C, 2014, 118, 7637–7642 CAS.
- L. Zhang and Z. Xia, J. Phys. Chem. C, 2011, 115, 11170–11176 CAS.
- R. Burkitt, T. R. Whiffen and E. H. Yu, Appl. Catal., B, 2016, 181, 279–288 CrossRef CAS.
- H. Hu, L. Han, M. Yu, Z. Wang and X. W. David Lou, Energy Environ. Sci., 2016, 9, 107–111 CAS.
- L. Cui, G. Lv and X. He, J. Power Sources, 2015, 282, 9–18 CrossRef CAS.
- R. Liu, D. Wu, X. Feng and K. Mullen, Angew. Chem., 2010, 49, 2565–2569 CrossRef CAS PubMed.
- M. Lefèvre and J.-P. Dodelet, Electrochim. Acta, 2003, 48, 2749–2760 CrossRef.
- L. Lai, J. R. Potts, D. Zhan, L. Wang, C. K. Poh, C. Tang, H. Gong, Z. Shen, J. Lin and R. S. Ruoff, Energy Environ. Sci., 2012, 5, 7936–7942 CAS.
- K. Gong, F. Du, Z. Xia, M. Durstock and L. Dai, Science, 2009, 323, 760–764 CrossRef CAS PubMed.
- S. Wang, D. Yu and L. Dai, J. Am. Chem. Soc., 2011, 133, 5182–5185 CrossRef CAS PubMed.
- B. Y. Guan, L. Yu and X. W. Lou, Energy Environ. Sci., 2016, 9, 3092–3096 CAS.
- G. Zhang, W. Lu, F. Cao, Z. Xiao and X. Zheng, J. Power Sources, 2016, 302, 114–125 CrossRef CAS.
- S.-C. Yi, C. Y. Jung and W. J. Kim, Mater. Res. Bull., 2011, 46, 2433–2440 CrossRef CAS.
Footnote |
| † Electronic supplementary information (ESI) available: A schematic conjugation process of GQD and FePC, SEM images of FePC and magnified FePC. See DOI: 10.1039/c6ra27873f |
| This journal is © The Royal Society of Chemistry 2017 |

