
 Open Access Article
 This Open Access Article is licensed under a Creative Commons Attribution-Non Commercial 3.0 Unported Licence
Nitrogen-doped porous carbon derived from Fe-MIL nanocrystals as an electrocatalyst for efficient oxygen reduction
Limeng Yangab,
Yangzhi Baiab,
Hongjie Zhangab,
Jiangtao Genga,
Zhigang Shao *a and
Baolian Yia
*a and
Baolian Yia
aDalian National Laboratories for Clean Energy (DNL), Dalian Institute of Chemical Physics (DICP), Chinese Academy of Sciences, 457 Zhongshan Road, Dalian 116023, China. E-mail: zhgshao@dicp.ac.cn
bUniversity of Chinese Academy of Sciences, Beijing 100039, PR China
First published on 24th April 2017
Abstract
Exploring cheap and stable electrocatalysts to replace Pt for the oxygen reduction reaction (ORR) is now the key issue for the large-scale application of fuel cells. Herein, we report a novel mesoporous carbon material prepared by one-step pyrolysis of a dicyandiamide (DCD)-doped iron-based metal organic framework (MOF) compound—Materiaux de l'Institute Lavosier-101(Fe) (MIL-101(Fe)). The as-prepared nitrogen mesoporous carbon (MIL-5 DCD-800) is characterized by transmission electron microscopy (TEM), X-ray powder diffraction (XRD), N2 sorption isotherms and X-ray photoelectron spectroscopy. MIL-5 DCD-800 shows an onset potential of 1.08 V (vs. RHE) and a half-wave potential of 0.86 V (vs. RHE) in 0.1 M KOH, which are similar to those of commercial Pt/C (1.05 V@0.05 mA cm−2). Furthermore, the electrocatalyst also possesses a much better stability and resistance to methanol crossover than Pt/C. This excellent performance is attributable to the presence of pyridinic- and graphitic-N together with abundant Fe active sites that promotes the four-electron process in the ORR. High pore volume and appropriate mesopores boost the mass transfer and reactivity during electrocatalysis.
Introduction
Fuel cells (FCs) are considered as one of the most promising power source candidates for transport, stationary and portable terminals because of their high energy efficiency and low environmental impact. Nevertheless, catalysts at both the anode and cathode of the fuel cell are generally based on platinum (Pt) or platinum alloys. Thus, the cost of fuel cell stacks, especially the electrocatalyst cost due to the price of Pt in the unstable and monopolized precious metal market, significantly prohibits their large-scale application.1 The oxygen reduction reaction (ORR) which requires much more Pt than the faster anode hydrogen oxidation is a sluggish and vital reaction happening at the cathode. By virtue of that, it's pivotal to design and develop novel superior non-precious metal catalysts (NPMCs) with outstanding activity and durability to replace platinum at fuel cell cathodes.In recent decades, transition metal chalcogenides,2 metal oxides,3 carbides,4 nitrides,5 oxynitrides,6 carbonitrides and carbon-supported nitrogen materials with or without transition metal (M-Nx/C or Nx/C) ORR electrocatalysts have come into our sights. In particular, owing to the harsh synthesis conditions7 of metal oxynitrides/carbonitrides and the mediocre ORR activity and durability8 of metal chalcogenides, more and more efforts have been made on metal (M-Nx/C) and non-metal carbon-supported nitrogen (Nx/C)9–11 materials. In view of the point that catalyst's electrocatalytic activity results from the entrapment of metal sites,12,13 pyrolyzed M-Nx/C materials are considered the most promising ORR catalysts,14 especially Fe-Nx/C catalysts.15–17 On the other hand, metal–organic frameworks (MOFs), thanks to their well-defined porous structures and regular arrangement of metal nodes and heteroatoms, are viewed as a brilliant precursor or template to synthesize new forms of M-Nx/C materials.18 One specific area in which MOF-derived heteroatom decorated carbon materials can play an important role is the catalysis of oxygen reduction reactions in fuel cells, especially as ZIFs19–21 and MILs22–24 among several MOF families. As Zi-Feng Ma et al. reported,25 a series of metal macrocycles showed decreasing catalytic activities towards the ORR in the order Fe > Co > Zn. However, there aren't so many Fe containing ZIFs naturally. Accordingly, scientists often doped Fe source into other metal containing MOF precursors, such as Zn containing ZIF-7,26 ZIF-8 (ref. 27) and IRMOF-3.28 Yet, these synthetic methodologies are complex, expensive and time-consuming as they require the fabrication of sacrificial templates or O2-free environment besides the use of hazardous substances for template removal, which limits their competitiveness against Pt-based catalysts. As a result, the MIL family built from trivalent metal centers (Fe3+ etc.) pioneered by Ferey and co-workers29 has recently attracted the attention of experts due to their enormous porosity, large pores and enhanced stability.30
Here, we prepared an excellent pyrolyzed M-Nx/C for the first time with a nitrogen-doped MIL-101(Fe) as precursor under HF and surfactant-free conditions in a round-bottom flask. To understand the influences of the nitrogen dopant amounts and pyrolysis temperature, we optimized the synthesis method and found out that MIL-5 DCD-800 catalyst behaved best among all the obtained catalysts. These unique properties are expected to significantly enhance the resulting fuel cell performance.
Experimental
Material synthesis
![[thin space (1/6-em)]](https://www.rsc.org/images/entities/char_2009.gif) :1:635. This solution was then degassed by shaking in an ultrasonic bath for 10 min in order to remove air bubbles and then the vial was sealed and heated to 150 °C for 12 h under stirring. Then, the hot solution was poured out without cooling and products were isolated immediately by centrifugation. The basal brown precipitate was washed thoroughly with DMF and dried under vacuum overnight, the final product was denoted as MIL-101(Fe).
:1:635. This solution was then degassed by shaking in an ultrasonic bath for 10 min in order to remove air bubbles and then the vial was sealed and heated to 150 °C for 12 h under stirring. Then, the hot solution was poured out without cooling and products were isolated immediately by centrifugation. The basal brown precipitate was washed thoroughly with DMF and dried under vacuum overnight, the final product was denoted as MIL-101(Fe).Physical characterization
The field-emission scanning electron microscopy (FESEM) was performed on JEOL JSM-6360 scanning electron microscope operating at an acceleration voltage of 1.50 kV. The MIL-101(Fe) precursor sample was sprayed by gold atoms to enhance its electrical conductivity. Transmission electron microscopy (TEM) was conducted on JEM-2100 operating at 200 kV.Powder X-ray diffraction (XRD) patterns were collected on a D/MAX2500VB2/PC with a 2θ range of 5–90° and a scan speed of 5° min−1 at ambient temperature. X-ray photoelectron spectroscopy (XPS) was carried out on a Thermo Scientific ESCA Lab250 Xi spectrometer. The metal content of electrocatalysts was determined by PerkinElmer 7300DV inductively coupled plasma atomic emission spectrometry (ICP-OES).
Nitrogen sorption measurements at 77 K were carried out by using a Quantachrome Autosorb-IQ gas adsorption analyzer. The samples were degassed at 90 °C for 2 h and 200 °C for 5 h under dynamic vacuum before tests. The resulting BET surface areas were calculated from the adsorption branches and the pore size distributions were fitted from Quenched Solid Density Functional Theory (QSDFT) method.
Electrochemical measurements
Electrochemical measurements were performed using a CHI Electrochemical Station (Model 730D) in a three-electrode electrochemical cell at room temperature. Platinum foil and an Ag/AgCl electrode were using as the counter and reference electrode, respectively. The catalyst layer on the glassy carbon electrode (0.1256 cm2) was prepared as follows. The Fe-contained MIL-x DCD-y powder were dissolved in a mixture of water, isopropyl alcohol and Nafion (5.0 wt%, Du Pont Corp.) with a ratio of 1:9:0.1 (v/v/v) under sonication to get 2 mg mL−1 ink. Next the uniformly dispersed ink was dropped onto the glassy carbon disk, which was then left to dry in air at room temperature, to yield a catalyst loading of ca. 400 μg cm−2. Comparatively, the loading of commercial Pt/C (20 wt%, Johnson Matthey Co., Ltd) catalyst was controlled at 20 μgPt cm−2. All the potentials reported in this work were expressed versus the reversible hydrogen electrode (RHE) based on the standard calculation method: in 0.1 M KOH solution (pH = 13), E(RHE) = E(Ag/AgCl) + 0.965.
The cyclic voltammetry (CV) curves were obtained by cycling scan at room temperature after purging N2 or O2 for at least 20 min. The electrode was subjected to electrochemical treatment by potential cycling between 0.05 and 1.2 V at 100 mV s−1 in 0.1 M KOH until stable voltammogram curves were obtained.
In rotating disk electrode (RDE) tests, the background capacitive currents were recorded in a potential range from 1.2 to 0.2 V in nitrogen-saturated electrolyte at a scan rate of 10 mV s−1. Then linear sweep voltammograms (LSV) in oxygen-saturated electrolyte were measured at an electrode rotation speed of 1600 rpm. The oxygen reduction current was corrected by the background current.
In rotating ring-disk electrode (RRDE, PINE AFE7R9GCPT) tests, the ring potential was set to 1.466 V to oxidize the hydrogen peroxide produced during oxygen reduction on the disk electrode. The number of electron transferred (n) during ORR and the hydrogen peroxide yield (% H2O2) were calculated using the following equations:
 | (1) |
 | (2) |
Koutecky–Levich plots were obtained on the basis of RDE tests at different rotating rates and the electron transfer number during ORR process can be determined from the slopes of Koutecky–Levich plots by the following equation:
 | (3) |
485 C mol−1) is the Faraday constant; DO2 (1.9 × 10⁻⁵ cm2 s−1) is the diffusion coefficient of O2 in 0.1 KOH and CO2 (1.2 × 10⁻⁶ mol cm−3) is the concentration of O2 in the electrolyte; ν is the kinetic viscosity of the solution (0.01 cm2 s−1); and ω is the electrode rotation rate (rad s−1).
As for accelerated durability test (ADT), the electrodes were cycled between 0.6 and 1.0 V for a whole number of 2000 cycles in O2 saturated KOH (0.1 M) with a scan rate of 100 mV s−1. Simultaneously, CV curves and ORR polarization curves were collected in aqueous KOH solution at certain cycles to record the degradation of home-made electrocatalysts and commercial Pt/C.
Results and discussion
Materials characterization
Fig. 1b shows the wide angle XRD patterns of heat-treated samples doped different DCD. Most of the heat-treated samples doped DCD give a series of peaks at 44.6°, 65.1° and 82.5°, which are attributed to metallic iron [Joint Committee on Powder Diffraction Standards (JCPDS) number 01-087-0722]. It's obvious that the amount of Fe generally increases when the heat-treat temperature arises except for MIL-5 DCD-900. Besides, there are few iron oxides (JCPDS number 00-025-1402) existing in doped samples which are mainly contained in undoped with peaks at 30.3°, 35.7° and 57.4°. When the pyrolysis temperature rises to 800 °C, Fe3C (JCPDS number 00-003-0411) is detected in MIL-5 DCD-y with peak of 26.2°. Furthermore, there are also weak Fe3N (JCPDS number 00-001-1236) peaks at 43.3° indicating the lower crystallinity of Fe3N in MIL-5 DCD-y. Without doping N, only displayed FeO (JCPDS number 01-089-0687), Fe3O4 (JCPDS number 03-065-3107) and carbon (JCPDS number 00-050-1084) besides Fe2O3. The mean diameter of Fe particles of MIL-5 DCD-(700–900) calculated from Scherrer equation is 60.5 nm and the MIL-5 DCD-1000 is 47.7 nm. It seemed that the mean diameter of Fe particles calculated through XRD patterns were not completely in accordance with the SEM photos of MIL-5 DCD-700 and MIL-5 DCD-1000 catalysts in Fig. 2. It may be the reason that the mean diameter of Fe particles of MIL-5 DCD-700 and MIL-5 DCD-1000 are smaller than 50 nm resulting that Scherrer equation isn't applicative anymore. In addition, the mean diameter doesn't seem to increase with the pyrolysis temperature when it turns to 1000 °C. It may be that the generated carbon nanotubes prohibited the aggregation of Fe particles under the high temperature of 1000 °C in Fig. 2d. | ||
| Fig. 1 XRD patterns: (a) MIL-101(Fe); and (b) MIL-5 DCD-y (* Fe; δ Fe2O3; π Fe3C; ν Fe3N; β FeO; χ carbon; ϕ Fe3O4). | ||
 | ||
| Fig. 2 FESEM image of the MIL-5 DCD-700 (a), MIL-5 DCD-800 (b), MIL-5 DCD-900 (c) and MIL-5 DCD-1000 catalyst (d). | ||
To further explore the morphology and crystalline information of best-performance MIL-5 DCD-800 catalyst, it was characterized by high-resolution transmission electron microscopy (HRTEM) and selected area electron diffraction (SAED). The TEM morphology of MIL-5 DCD-800 catalyst in Fig. 3a can show that it's composed of small graphene-wrapped nanoparticles and large agglomerated metal composites. In view of the XRD results in Fig. 1b, the nanoparticles embedded in carbon matrix and several hundreds of nanometer-size dark particles could most possibly be Fe or Fe2O3. While as seen in Fig. 3b, the 10 nm-diameter small nanoparticles are Fe particles. Because it can be measured that the lattice spacing is about 0.207 nm, which is slightly larger than the standard value of 0.204 nm, corresponding to the [110] plane of metallic Fe. The larger lattice space might be ascribed to the spaces of iron with intercalated nitrogen atom, which accordingly enlarges the lattice constant.31 As for the large agglomerating metal composites, we observed polycrystal lattice in Fig. 3c. The lattice spacing is about 0.309 ± 0.006 nm nanoparticles which corresponds to the [111] plane of Fe3C. Particularly, the SAED pattern (in Fig. 2d) of the nanoparticle also reveals that the large irregular particles are polycrystalline. The formation of carbon layer around Fe3C likely results from the carbonization catalytic effect of Fe during the pyrolysis process. In addition, we observed other tiny carbon-wrapped nanoparticles with a lattice spacing of 0.466 nm which corresponding to the [002] plane of the Fe2O3. To understand the morphology and the microstructure of this materials, more SEM photographs of MIL-5 DCD-700, MIL-5 DCD-800, MIL-5 DCD-900 and MIL-5 DCD-1000 are given in Fig. 2. The morphology of MIL-5 DCD-800 is similar to MIL-5 DCD-900 with aggregated several hundreds of nanometer-size metal particles and carbon bulks. There are obvious carbon nanotubes generated in MIL-5 DCD-1000 ascribed to high pyrolysis temperature while MIL-5 DCD-700 seems like abundant tiny metal species embedded in amorphous carbon.
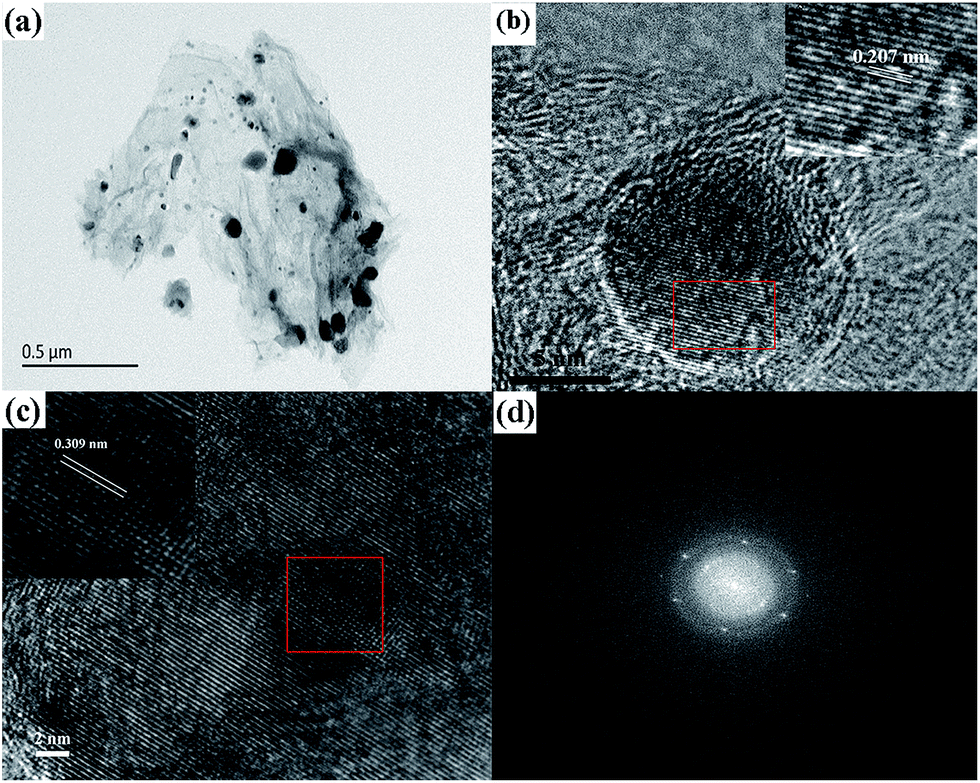 | ||
| Fig. 3 TEM image of the MIL-5 DCD-800 catalyst (a); HRTEM images of the MIL-5 DCD-800 catalyst (b and c); SAED image of the MIL-5 DCD-800 catalyst (d). | ||
As a subclass of MOFs, MIL-101(Fe) consists of 1,4-benzenedicarboxylic acid as organic ligands and Fe ions as metal centers whose inorganic secondary building unit (SBU) is composed of a carboxylate-bridged, oxo-centered, trinuclear Fe3+ complex.32 As for the definition of MIL-101(Fe), the crystal topology of MIL-101(Fe) precursor appears a rigid zeotype octahedral structure with a length of 200–300 nm in Fig. 4a and b which is corresponding with the reference reported.33 Moreover, the structures of obtained MIL-101(Fe) precursor characterized by XRD shows that the synthesized precursor is exactly MIL-101(Fe) crystal according to the peaks reported in the literature.23 However, compared with MIL-101(Fe), MIL-5 DCD-800 catalyst did not preserve the original shape of the precursor crystal as shown in Fig. 4a and b. The topology and textural property's modification of MIL-5 DCD-800 catalyst may result from the structure collapse of MIL-101(Fe) precursor, the polymerization and decomposition of nitrogen source DCD and the conversion of iron-based intermediates.
 | ||
| Fig. 4 FESEM image of the MIL-101(Fe) precursor (a and b) and MIL-0 DCD-800 catalyst (c and d). | ||
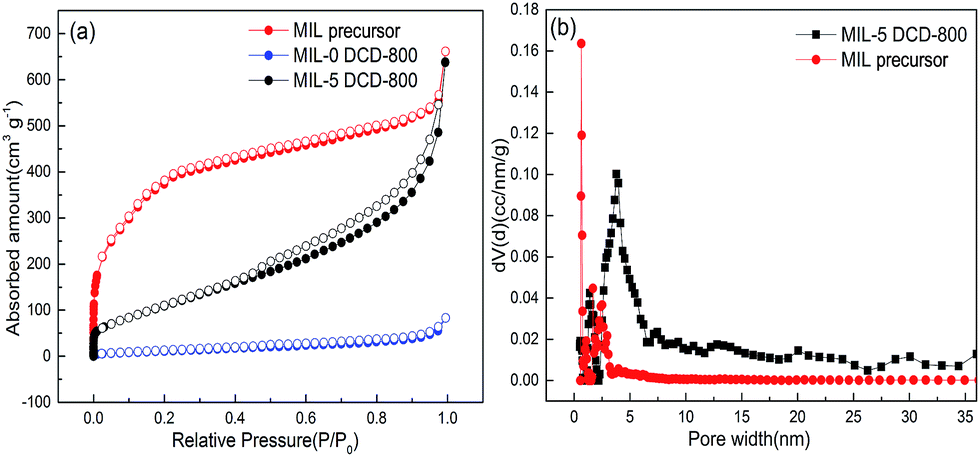
The detail textural property and inner structure of MIL precursor and electrocatalyst samples can be illustrated by N2 sorption isotherms and pore size distribution analysis. For instance, MIL-101(Fe) produced a type-I isotherm indicating a microporous structure (Fig. 5a), with a large BET surface area of 1474.596 m2 g−1 (Table 1). The BET surface area together with the XRD pattern in Fig. 1a proves it's undoubtedly MIL-101(Fe). It's mainly attributed to the micropores taking up about 31.48% of the total pore volume. The tiny surface area of catalyst rarely demonstrated any pore structure. Looking at the FESEM image of in Fig. 4c and d, we can observed a little bit shape of the original octahedral framework of MIL-101(Fe) precursor and the poor surface area of may result from the agglomeration of particles. From the BET surface area of different samples in Table 1, we can easily discovery that the BET surface area of electrocatalysts also dramatically decreased after calcination especially when DCD wasn't doped. On the other hand, MIL-5 DCD-800 possesses the largest BET surface area between the MIL-5 DCD-y catalysts and its total pore volume decreased around only 3.5% of MIL precursor's total pore volume. It demonstrated that the complement of nitrogen source can prohibit the structure collapse of MIL-101(Fe) precursor to some extent. The obvious hysteresis loop and vertical tail of MIL-5 DCD-800 and MIL-5 DCD-700/900/1000 catalyst revealed a typical type H3 isotherm which proved the presence of a certain portion of slit meso- and macro-pores (Fig. 5a). The pore-size distribution of MIL-5 DCD-800 was analyzed by NLDFT method for both micropores (0–2 nm) and mesopores (2–50 nm) although there aren't any micropores shown by t-plot method (Table 1).
 | ||
| Fig. 5 Porous texture analysis of electrocatalysts: (a) N2 sorption isotherms at 77 K (closed, adsorption; open, desorption); (b) NLDFT (non-local density functional theory) pore size distribution. | ||
| Catalyst | BET surface area (m2 g−1) | Micropore volume (cm3 g−1) | Total pore volume (cm3 g−1) |
|---|---|---|---|
| MIL precursor | 1474.60 | 0.473 | 1.023 |
| MIL-0 DCD-800 | 50.68 | — | — |
| MIL-5 DCD-600 | 113.04 | — | 0.222 |
| MIL-5 DCD-700 | 411.08 | — | 0.958 |
| MIL-5 DCD-800 | 452.33 | — | 0.987 |
| MIL-5 DCD-900 | 425.09 | — | 0.968 |
| MIL-5 DCD-1000 | 350.03 | — | 1.029 |
In Fig. 5b, some 0.642 nm-wide micropores in MIL precursor turned into 3.974 nm-wide mesopores in MIL-5 DCD-800 during pyrolysis possibly because of the pore-forming effect of undecomposed carbonitride precursor.
The element compositions (at%) and electronic states of N 1s and Fe 2p in the surface layers of the MIL-5 DCD-y catalysts pyrolyzed at different temperature were determined by XPS analysis (Fig. 6). The N 1s XPS spectra of the MIL-5 DCD-600 materials (Fig. 6a, c, e, g and i) can be deconvoluted into four types according to the binding energy: pyridine (398.7 eV), pyrrolic (400.4 eV), graphitic (401.3 eV) and oxidized (403.8 eV) nitrogen species,21 respectively. It can be seen in Table 2 and Fig. 6 that the pyridinic N contributions of all MIL-5 DCD-y catalysts decreased with the increasing pyrolysis temperature while graphitic N fraction increased with temperature which is in accordance with other similar references.34,35 Through the ages, identifying the active sites of nitrogen-doped carbon materials for the ORR is under debate. Currently, the debate mainly focuses on whether the active sites are created by pyridinic N or graphitic N. Pyridinic-N has long been proposed as the active site to promote the four-electron process in ORR.36–40 Recently, Nakamura et al. pointed that the carbon atoms adjacent to pyridinic-N with Lewis basicity were ORR active sites.41 Whatever, graphitic N atoms have been reported both experimentally and theoretically to serve as ORR catalytic sites due to their reduced adsorption energy.42 Kim et al.43 proposed that graphene edge structures after introduction of graphitic N not only enhanced the first electron transfer rate, but also showed preference for the in particular 4e− reduction pathway. Lai et al.44 also found that the electrocatalytic activity of the N-doped graphene catalyst mainly depended on the graphitic N content, which determined the limiting current density, while the pyridinic N species may have converted the ORR reaction mechanism from a 2e− dominated process to a 4e− dominated process and improved the ORR onset potential. As shown in Table 2, MIL-5 DCD-800 catalyst preserves the highest amount of pyridinic and graphitic N than other catalysts which may signpost a better performance. The binding energies between 705 and 730 eV were assigned to Fe 2p peak deconvolution. It is shown in the XPS Fe 2p spectrum of MIL-5 DCD-800 that the peaks centered at 710.8 and 724.3 eV represent Fe(III) 2p3/2 and 2p1/2, respectively, and no Fe(II) peak is observed (i.e. 709.6 eV for Fe(II)).45 In addition, the trivial peak at 706.7–707.2 eV may be representative of metal Fe 2p3/2 while the hump observed at 705 eV for the MIL-5 DCD-800/900 sample is related to several of the metallic aggregates.27 As for Fe–N bonding the peak is generally around ca. 713 and 725 eV.45 Fe is most likely complexed with N functions such as pyrrolic-N and pyridinic-N in MIL-5 DCD-y samples.
 | ||
| Fig. 6 High-resolution XPS spectra of N 1s and Fe 2p in the MIL-5 DCD-600 (a and b), MIL-5 DCD-700 (c and d), MIL-5 DCD-800 (e and f), MIL-5 DCD-900 (g and h), MIL-5 DCD-1000 (i and j) catalyst. | ||
| Types of N (at%) | Pyridinic | Graphitic | Oxidized | Pyrrolic | Pyridinic + graphitic |
|---|---|---|---|---|---|
| MIL-5 DCD-600 | 51.9 | 11.0 | 11.0 | 24.5 | 62.9 |
| MIL-5 DCD-700 | 43.3 | 18.5 | 10.0 | 28.1 | 61.8 |
| MIL-5 DCD-800 | 35.9 | 27.5 | 18.0 | 18.6 | 63.4 |
| MIL-5 DCD-900 | 28.8 | 28.9 | 13.2 | 29.1 | 57.7 |
| MIL-5 DCD-1000 | 24.1 | 36.4 | 12.7 | 26.9 | 60.5 |
Moreover, the Fe contents in MIL-101(Fe) precursor, MIL-0 DCD-800 and MIL-5 DCD-y catalyst characterized by ICP-OES in Table 3 are more than the results of XPS in Table 4. Probably because XPS data usually gives the surface composition rather than the bulk composition of ICP-OES results. Besides, the reason why Fe contents from XPS data of MIL-5 DCD-600 to MIL-5 DCD-900 catalyst decreased as the pyrolysis temperature increased may be that the surface graphene/CNT is thicker than 2 nm in MIL-5 DCD-y as the pyrolysis temperature increased thus the wrapped iron nanoparticles inside cannot be detected by XPS (Fig. 2). It is evident that γ-Fe2O3, Fe3N and metal Fe are the iron resource in MIL-5 DCD-800, from both XRD and XPS observations. The particles observed in the TEM images of MIL-5 DCD-800 should more likely be Fe oxides or metal iron since rarely no Fe carbides signal was shown in the XPS.
| Amounts of Fe (wt%) | MIL-101(Fe) | MIL-0 DCD-800 | MIL-5 DCD-700 | MIL-5 DCD-800 | MIL-5 DCD-900 | MIL-5 DCD-1000 |
|---|---|---|---|---|---|---|
| Fe | 17.49 | 70.20 | 28.92 | 46.55 | 38.97 | 19.56 |
| Elements (at%) | C | N | Fe |
|---|---|---|---|
| MIL-5 DCD-600 | 57.67 | 36.89 | 5.43 |
| MIL-5 DCD-700 | 83.90 | 12.06 | 4.04 |
| MIL-5 DCD-800 | 91.69 | 5.69 | 2.62 |
| MIL-5 DCD-900 | 94.36 | 4.06 | 1.58 |
| MIL-5 DCD-1000 | 96.55 | 1.86 | 1.59 |
Electrocatalytic activity
To evaluate the influence of pyrolysis temperature and nitrogen dopant amounts, we investigated electrocatalysts with different nitrogen dopant amounts46 pyrolyzed from 600 °C to 1000 °C. Fig. 7a shows the RDE polarization curve of the electrocatalysts prepared by pyrolysis of MIL-10 DCD from 600 to 1000 °C. With the increase of pyrolysis temperature, it seems that the electrochemical performance of different nitrogen dopant amounts catalysts reached their highest point at 800 °C in terms of onset potential and half-wave potential toward ORR separately (Fig. 7b). Moreover, different MIL-x DCD-800 catalysts were compared in Fig. 7c and the MIL-5 DCD-800 catalyst exhibits the highest performance among other electrocatalysts with an ORR half-wave potential of 0.86 V and a limiting current density of 5.7 mA cm−2 which is about the same as commercial 20 wt% Pt/C. The kinetic current density at 0.8 V is 22.0 mA cm−2 and the resulting mass activity is 55.1 A g−1. It may be the dominating presence of rich pyridinic- and graphitic-N and abundant carbon-wrapped metal Fe active sites in MIL-5 DCD-800 that promote the four-electron process in ORR, leading to a better performance than the amino-MIL-53(Al) electrocatalyst made by Yao et al.22 directly pyrolyzed the naturally-nitrogen-contained MOF. As seen in Fig. 7d, the ORR capacity of MIL-5 DCD-800 which reserves most metal Fe active sites is no wonder superior than MIL-5 DCD-y with other pyrolysis temperature (Table 3). Fig. 7c and d shows the ORR polarization curves of MIL-101-Fe precursor, MIL-0 DCD-800 and MIL-5 DCD-800. It's obvious that the nitrogen dopant and pyrolysis treatment are vital to the improvement of ORR electrocatalytical performance. Although the MIL-5 DCD-600 catalyst contains the similar highest content of pyridinic- and graphitic-N with MIL-5 DCD-800 catalyst (Table 2), it displays poor ORR catalytic activity. The main reason probably is the low surface area of MIL-5 DCD-600 (Table 1) in terms of other MIL-5 DCD-y catalyst. In addition, the detailed Fe coordinates of the best-performance MIL-5 DCD-800 catalyst should be further studied to investigate how they are coordinate with doped N atoms by characterizations such as Mössbauer spectroscopy, EXAFS. On the other hand, that some 0.642 nm-wide micropores (Fig. 5b) in MIL precursor turned into 3.974 nm-wide mesopores of MIL-5 DCD-800 during pyrolysis supported the opinion that large pore size of catalysts can facilitate the accessibility of reactant for ORR in fuel-cell test.47 It may be the fact that mesoporous frameworks serve as reactant buffering reservoirs while microporous textures only ensure a large surface area favorable to the exposure of active sites. Since in the fuel-cell test, the micropores supporting more active sites can hardly touch reactant molecules without the macro/mesopores of electrocatalyst facilitating the accessibility of reactant for ORR. Furthermore, the large BET surface area of MIL-5 DCD-800 also contributes to support of active sites leading to an enhanced catalytic activity.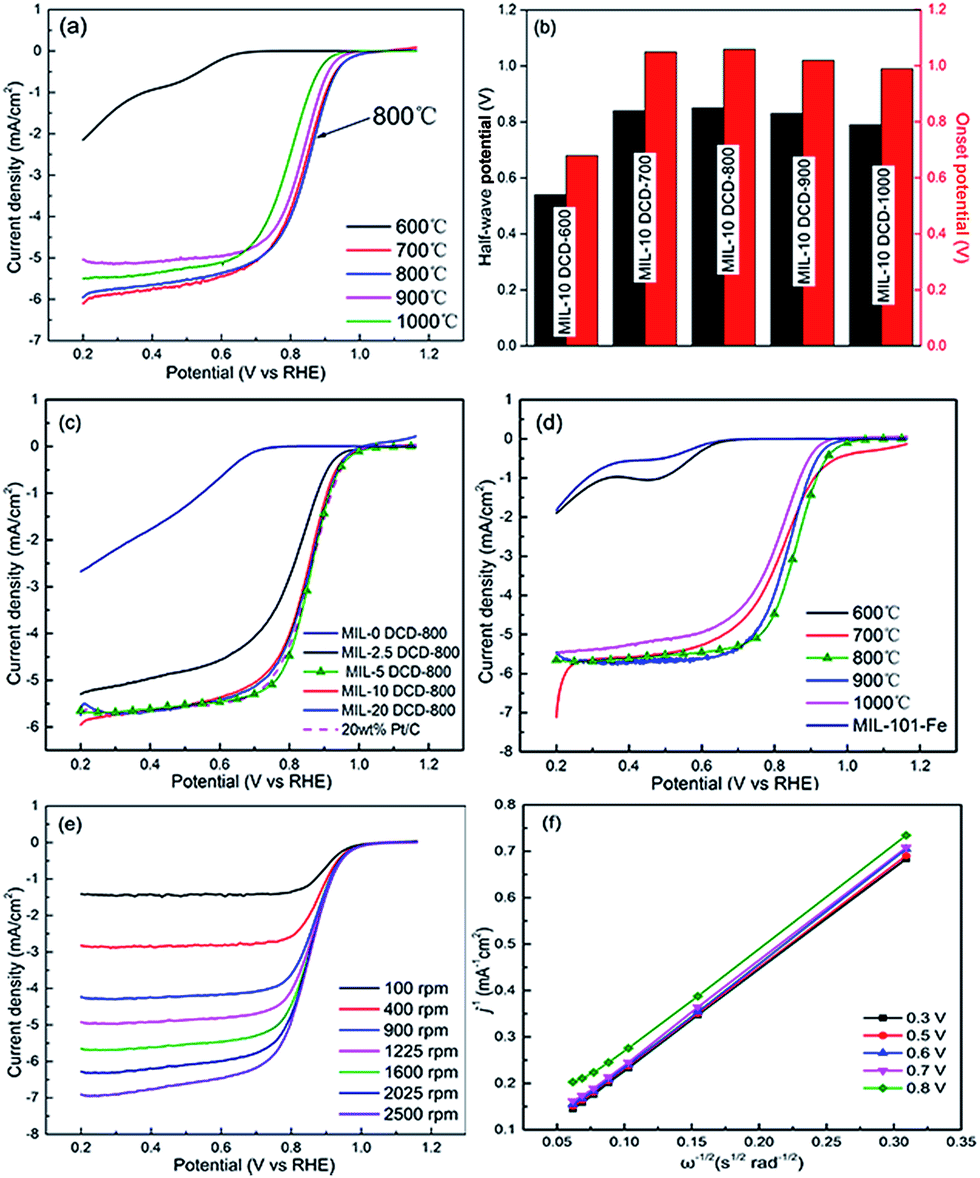 | ||
| Fig. 7 RDE polarization curves in O2 saturated 0.1 M KOH of (a) MIL-10 DCD heat-treated at 600–1000 °C, (c) MIL-x DCD-800 with different nitrogen dopants and 20 wt% Pt/C, (d) MIL-5 DCD-600/700/800/900/1000 and MIL-101-Fe precursor, (e) MIL-5 DCD-800 at different rotating speed. (b) Comparison of the corresponding onset potentials and half-wave potentials measured on MIL-10 DCD heat-treated at 600–1000 °C. (f) Koutecky–Levich plots at different potentials from 0.3 V to 0.8 V. | ||
The polarization curves obtained at different rotation speeds from RDE experiments are shown in Fig. 7e for MIL-5 DCD-800. The numbers of electrons transferred per O2 molecule were estimated using Koutecky–Levich (K–L) equation. As shown in Fig. 7f, the corresponding K–L plots show a good linearity and the linear plots at different potentials suggest the first order reaction kinetics toward oxygen. According to the K–L equation, the transferred electron number (n) per oxygen molecule for MIL-5 DCD-800 is calculated to be approximately 3.93 over the potential range from 0.3 to 0.8 V.
Fig. 8a illustrates the electron transfer number (n) during ORR process and Fig. 8b shows the hydrogen peroxide yield (% H2O2) calculated from the RRDE results for MIL-5 DCD-800 and commercial Pt/C in alkaline solution. The n number for MIL-5 DCD-800 is between 3.9 and 4.0, which is corresponding with the n number calculated by K–L plot. It indicates that the ORR on MIL-5 DCD-800 was dominated by a 4e process and % H2O2 (or % HO2−) is below 1% for Pt/C and 3% for MIL-5 DCD-800, respectively, which confirms that the 4e reduction to water is predominated for both electrocatalysts in alkaline medium.
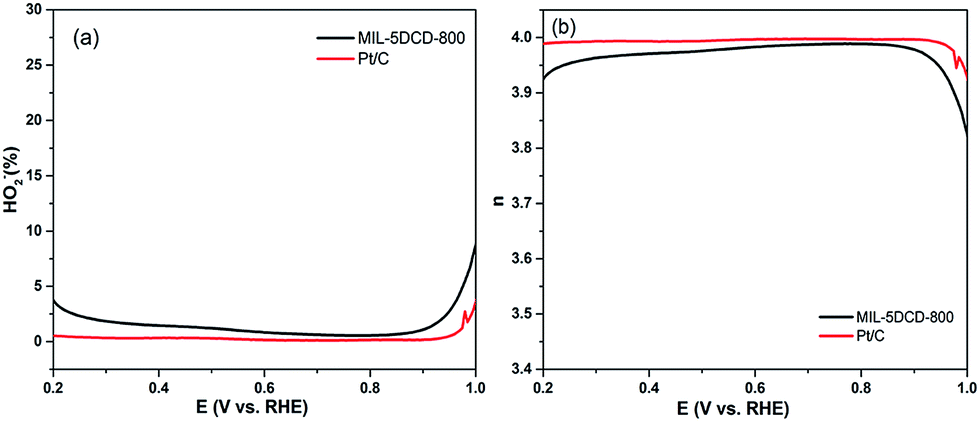 | ||
| Fig. 8 (a) % H2O2 and (b) electron-transfer number of MIL-5 DCD-800 and commercial 20% Pt/C during ORR process. | ||
During accelerated durability test (ADT), CV curves and ORR polarization curves were collected in aqueous KOH solution at certain cycles to track the degradation of MIL-5 DCD-800 and commercial Pt/C.
Methanol-tolerance and durability
Fig. 9a shows the current density degradation of MIL-5 DCD-800 and commercial Pt/C after being cycled between 0.6 and 1.0 V for a total number of 2000 cycles in O2 saturated KOH (0.1 M) with a scan rate of 100 mV s−1. It is clear that 98% of the initial current density of MIL-5 DCD-800 toward ORR has been maintained, which is much better than that of the commercial Pt/C (59%). It's probably attributable to the steady pyridinic- and graphitic-N active sites and graphene which wrapped Fe nanoparticles protects the active metallic core from oxidation48 (Fig. 3a). While the deactivation of Pt/C is mainly due to the dissolution of Pt nanoparticles active sites at high potentials, while this is not the case for non-precious metal electrocatalyst. More importantly, Fig. 9b shows that MIL-5 DCD-800 also exhibits a better methanol tolerance than commercial Pt/C. A sharp increase of the current density was observed for commercial Pt/C after the introduction of 5 vol% methanol into the alkaline solution, while the MIL-5 DCD-800 was only slightly affected. It will be beneficial to further development of nitrogen-doped carbon electrodes for many applications such as PEMFCs and direct methanol fuel cells (DMFCs). | ||
| Fig. 9 (a) Stability evaluation of MIL-5 DCD-800 and JM 20% Pt/C in O2-saturated 0.1 M KOH; (b) chronoamperometric response of MIL-5 DCD-800 and JM 20% Pt/C at 1600 rpm. The arrow indicates the introduction of 5 vol% methanol. | ||
Conclusions
In summary, we reported a simple and convenient approach for preparing nitrogen-doped mesoporous carbon materials. During pyrolysis process, the MOF compound was converted to carbon and nitrogen atoms were doped into the carbon products at the same time. We investigated systematically the physical structure character and electrocatalytic ability of different nitrogen dopant amount products and MIL precursor by various characterization methods. As a non-precious metal electrochemical catalyst, the synergistic effect of presence of pyridinic- and graphitic-N together with abundant graphene-wrapped Fe particles49,50 may promote the performance of the mesoporous carbon products for ORR, which is one of the most crucial factors to determine the performance of a fuel cell. These carbon products exhibit excellent oxygen reduction capability in alkaline medium.Acknowledgements
This work is financially supported by the National Key Research and Development Program of China (No. 2016YFB0101208), the Key Program of National Natural Science Foundations of China (No. 21436003, No. 21306190, No. U1508202).Notes and references
- G. Wu, K. L. More, C. M. Johnston and P. Zelenay, Science, 2011, 332, 443–447 CrossRef CAS PubMed.
- W. L. Gu, L. Y. Hu, W. Hong, X. F. Jia, J. Li and E. K. Wang, Chem. Sci., 2016, 7, 4167–4173 RSC.
- Q. G. He, Q. Li, S. Khene, X. M. Ren, F. E. Lopez-Suarez, D. Lozano-Castello, A. Bueno-Lopez and G. Wu, J. Phys. Chem. C, 2013, 117, 8697–8707 CAS.
- S. C. Mu, X. Chen, R. H. Sun, X. B. Liu, H. Wu, D. P. He and K. Cheng, Carbon, 2016, 103, 449–456 CrossRef CAS.
- X. Tian, J. Luo, H. Nan, Z. Fu, J. Zeng and S. Liao, J. Mater. Chem. A, 2015, 3, 16801–16809 CAS.
- A. Ishihara, S. Doi, S. Mitsushima and K.-i. Ota, Electrochim. Acta, 2008, 53, 5442–5450 CrossRef CAS.
- A. Ishihara, Y. Ohgi, K. Matsuzawa, S. Mitsushima and K.-i. Ota, Electrochim. Acta, 2010, 55, 8005–8012 CrossRef CAS.
- X. L. Wang, Y. J. Ke, H. Y. Pan, K. Ma, Q. Q. Xiao, D. Q. Yin, G. Wu and M. T. Swihart, ACS Catal., 2015, 5, 2534–2540 CrossRef CAS.
- W. Wei, H. Liang, K. Parvez, X. Zhuang, X. Feng and K. Muellen, Angew. Chem., Int. Ed., 2014, 53, 1570–1574 CrossRef CAS PubMed.
- D. Higgins, P. Zamani, A. P. Yu and Z. W. Chen, Energy Environ. Sci., 2016, 9, 357–390 CAS.
- X. Y. Sun, J. Y. Xu, Y. X. Ding, B. S. Zhang, Z. B. Feng and D. S. Su, Chemsuschem, 2015, 8, 2872–2876 CrossRef CAS PubMed.
- R. Bashyam and P. Zelenay, Nature, 2006, 443, 63–66 CrossRef CAS PubMed.
- M. Lefevre, E. Proietti, F. Jaouen and J.-P. Dodelet, Science, 2009, 324, 71–74 CrossRef CAS PubMed.
- Z. Chen, D. Higgins, A. Yu, L. Zhang and J. Zhang, Energy Environ. Sci., 2011, 4, 3167–3192 CAS.
- W.-J. Jiang, L. Gu, L. Li, Y. Zhang, X. Zhang, L.-J. Zhang, J.-Q. Wang, J.-S. Hu, Z. Wei and L.-J. Wan, J. Am. Chem. Soc., 2016, 138, 3570–3578 CrossRef CAS PubMed.
- W.-J. Jiang, J.-S. Hu, X. Zhang, Y. Jiang, B.-B. Yu, Z.-D. Wei and L.-J. Wan, J. Mater. Chem. A, 2014, 2, 10154–10160 CAS.
- Y. Zhang, W.-J. Jiang, L. Guo, X. Zhang, J.-S. Hu, Z. Wei and L.-J. Wan, ACS Appl. Mater. Interfaces, 2015, 7, 11508–11515 CAS.
- C. Mao, A. Kong, Y. Wang, X. Bu and P. Feng, Nanoscale, 2015, 7, 10817–10822 RSC.
- H.-x. Zhong, J. Wang, Y.-w. Zhang, W.-l. Xu, W. Xing, D. Xu, Y.-f. Zhang and X.-b. Zhang, Angew. Chem., Int. Ed., 2014, 53, 14235–14239 CrossRef CAS PubMed.
- P. Zhang, F. Sun, Z. Xiang, Z. Shen, J. Yun and D. Cao, Energy Environ. Sci., 2014, 7, 442–450 CAS.
- W. Xia, J. Zhu, W. Guo, L. An, D. Xia and R. Zou, J. Mater. Chem. A, 2014, 2, 11606 CAS.
- X. Zhao, H. Zhao, T. Zhang, X. Yan, Y. Yuan, H. Zhang, H. Zhao, D. Zhang, G. Zhu and X. Yao, J. Mater. Chem. A, 2014, 2, 11666 CAS.
- F. Yin, G. Li and H. Wang, Catal. Commun., 2014, 54, 17–21 CrossRef CAS.
- X. He, F. Yin and G. Li, Int. J. Hydrogen Energy, 2015, 40, 9713–9722 CrossRef CAS.
- H. J. Zhang, Q. Z. Jiang, L. L. Sun, X. X. Yuan, Z. P. Shao and Z. F. Ma, Int. J. Hydrogen Energy, 2010, 35, 8295–8302 CrossRef CAS.
- T. Liu, P. P. Zhao, X. Hua, W. Luo, S. L. Chen and G. Z. Cheng, J. Mater. Chem. A, 2016, 4, 11357–11364 CAS.
- X. J. Wang, H. G. Zhang, H. H. Lin, S. Gupta, C. Wang, Z. X. Tao, H. Fu, T. Wang, J. Zheng, G. Wu and X. G. Li, Nano Energy, 2016, 25, 110–119 CrossRef.
- H. Sun, H. X. Su, X. Y. Ma, P. F. Zhang, X. Zhang, X. P. Dai, J. S. Gao, C. Chen and S. G. Sun, Electrochim. Acta, 2016, 205, 53–61 CrossRef CAS.
- D. Riou, O. Roubeau and G. Ferey, Microporous Mesoporous Mater., 1998, 23, 23–31 CrossRef CAS.
- K. M. L. Taylor-Pashow, J. Della Rocca, Z. Xie, S. Tran and W. Lin, J. Am. Chem. Soc., 2009, 131, 14261–14263 CrossRef CAS PubMed.
- K. Parvez, S. Yang, Y. Hernandez, A. Winter, A. Turchanin, X. Feng and K. Muellen, ACS Nano, 2012, 6, 9541–9550 CrossRef CAS PubMed.
- J. Shin, M. Kim, J. Cirera, S. Chen, G. J. Halder, T. A. Yersak, F. Paesani, S. M. Cohen and Y. S. Meng, J. Mater. Chem. A, 2015, 3, 4738–4744 CAS.
- J. Tang, M. Yang, M. Yang, J. Wang, W. Dong and G. Wang, New J. Chem., 2015, 39, 4919–4923 RSC.
- S. J. You, X. B. Gong, W. Wang, D. P. Qi, X. H. Wang, X. D. Chen and N. Q. Ren, Adv. Energy Mater., 2016, 6, 1501497 CrossRef.
- L. Shang, H. Yu, X. Huang, T. Bian, R. Shi, Y. Zhao, G. I. N. Waterhouse, L.-Z. Wu, C.-H. Tung and T. Zhang, Adv. Mater., 2016, 28, 1668–1674 CrossRef CAS PubMed.
- C. V. Rao, C. R. Cabrera and Y. Ishikawa, J. Phys. Chem. Lett., 2010, 1, 2622–2627 CrossRef CAS.
- K. Y. Park, J. H. Jang, J. E. Hong and Y. U. Kwon, J. Phys. Chem. C, 2012, 116, 16848–16853 CAS.
- H. B. Li, W. J. Kang, L. Wang, Q. L. Yue, S. L. Xu, H. S. Wang and J. F. Liu, Carbon, 2013, 54, 249–257 CrossRef CAS.
- C. Jeyabharathia, P. Venkateshkumarb, M. S. Raoa, J. Mathiyarasua and K. L. N. Phania, Electrochim. Acta, 2012, 74, 171–175 CrossRef.
- L. Y. Feng, Y. Y. Yan, Y. G. Chen and L. J. Wang, Energy Environ. Sci., 2011, 4, 1892–1899 CAS.
- D. Guo, R. Shibuya, C. Akiba, S. Saji, T. Kondo and J. Nakamura, Science, 2016, 351, 361–365 CrossRef CAS PubMed.
- Z. Yang, H. Nie, X. a. Chen, X. Chen and S. Huang, J. Power Sources, 2013, 236, 238–249 CrossRef CAS.
- H. Kim, K. Lee, S. I. Woo and Y. Jung, Phys. Chem. Chem. Phys., 2011, 13, 17505–17510 RSC.
- L. Lai, J. R. Potts, D. Zhan, L. Wang, C. K. Poh, C. Tang, H. Gong, Z. Shen, J. Lin and R. S. Ruoff, Energy Environ. Sci., 2012, 5, 7936–7942 CAS.
- V. M. Dhavale, S. K. Singh, A. Nadeema, S. S. Gaikwad and S. Kurungot, Nanoscale, 2015, 7, 20117–20125 RSC.
- P. P. Su, H. Xiao, J. Zhao, Y. Yao, Z. G. Shao, C. Li and Q. H. Yang, Chem. Sci., 2013, 4, 2941–2946 RSC.
- Y. C. Wang, Y. J. Lai, L. Song, Z. Y. Zhou, J. G. Liu, Q. Wang, X. D. Yang, C. Chen, W. Shi, Y. P. Zheng, M. Rauf and S. G. Sun, Angew. Chem., 2015, 54, 9907–9910 CrossRef CAS PubMed.
- M. Tavakkoli, T. Kallio, O. Reynaud, A. G. Nasibulin, C. Johans, J. Sainio, H. Jiang, E. I. Kauppinen and K. Laasonen, Angew. Chem., Int. Ed., 2015, 54, 4535–4538 CrossRef CAS PubMed.
- J. Y. Li, J. Wang, D. F. Gao, X. Y. Li, S. Miao, G. X. Wang and X. H. Bao, Catal. Sci. Technol., 2016, 6, 2949–2954 CAS.
- J. A. Varnell, E. C. M. Tse, C. E. Schulz, T. T. Fister, R. T. Haasch, J. Timoshenko, A. I. Frenkel and A. A. Gewirth, Nat. Commun., 2016, 7, 12582 CrossRef CAS PubMed.
| This journal is © The Royal Society of Chemistry 2017 |