
 Open Access Article
 This Open Access Article is licensed under a Creative Commons Attribution-Non Commercial 3.0 Unported Licence
Europium-based infinite coordination polymer nanospheres as an effective fluorescence probe for phosphate sensing†
Xiangyang Songab,
Yue Maab,
Xiao Geab,
Hongjian Zhoua,
Guozhong Wanga,
Haimin Zhanga,
Xiaoxian Tangc and
Yunxia Zhang *a
*a
aKey Laboratory of Materials Physics, Centre for Environmental and Energy Nanomaterials, Anhui Key Laboratory of Nanomaterials and Nanotechnology, CAS Center for Excellence in Nanoscience, Institute of Solid State Physics, Chinese Academy of Sciences, Hefei 230031, China. E-mail: yxzhang@issp.ac.cn
bUniversity of Science and Technology of China, Hefei 230026, P. R. China
cMonitoring Station of Environmental Protection, Chaohu Lake Administration Bureau of Anhui Province, Chaohu 238007, China
First published on 27th January 2017
Abstract
Although phosphate plays important roles in aquatic ecosystems as an indispensible nutrient, excessive levels are responsible for severe environmental issues. Hence, it is of considerable significance to develop highly sensitive and reliable probes for the detection of phosphate with the purpose of monitoring of water quality security and early-warning of eutrophication occurrence. In this work, uniform europium-based infinite coordination polymer (Eu-ICP) nanospheres are rationally constructed by a facile one-step solvothermal treatment. It is demonstrated that the newly developed sensing platform features excellent fluorescence properties, which can be efficiently quenched by the presence of phosphate ions (Pi). Typically, a good linearity exists between the decrease in fluorescence intensities and the Pi analyte content ranging from 2–100 μM, allowing the reliable determination of Pi concentration. Accordingly, the detection limit is estimated to be 0.83 μM, which is far below the detection requirement of phosphate discharge criteria in the water environment. It is noteworthy that the prepared Eu-ICP probe displays a specific recognition towards Pi, and is hardly affected by other possible existing species in natural water. More importantly, the proposed fluorescent probe can be utilized for reliable determination of Pi concentration in real water with acceptable recoveries, highlighting its feasibility in complicated environmental samples. Further research suggests that the underlying sensing mechanism is based on the strong affinity between europium centers and Pi, resulting in the collapse of the inherent structure of Eu-ICP and the corresponding fluorescence quenching. These findings show that the developed Eu-ICP probe holds great prospect in monitoring water quality and early warning of eutrophication based on the unique features associated with this simple preparation procedure, high selectivity, and excellent sensitivity.
1. Introduction
As an essential nutrient constituent, phosphorus (mainly in the form of phosphates) is indispensible for the normal growth of all living organisms since it serves as a main building block for energy carriers, nucleic acids, and proteins.1,2 Concurrently, phosphate is widely present in modern agriculture and industry, such as synthetic fertilizer, animal feed, domestic detergents, food and beverage additives, etc. With the fast development of social economy and the intervention of human activity, a large amount of phosphates are unavoidably released into the aqueous environment via industrial, agricultural and municipal wastewater containing phosphates. The excessive discharging of phosphate may instead bring about a series of severe environmental issues associated with eutrophication of water bodies, which has a serious influence on people's daily lives and causes enormous economic losses due to the protection of ecological resources.3,4 To some extent, the level of phosphates can be utilized as a key indicator in the diagnosis of the degree of eutrophication in natural waters. Therefore, it is of great significance for the controlling and guarding against the eutrophication occurrence to seek an effective method for the detection of phosphate in waters.To achieve the objective mentioned above, various analytical strategies have been devoted for the effective identification and determination of Pi, including colorimetry, chromatography, electrochemical method, enzymatic biosensors and so forth.5–9 Nevertheless, there exist several inherent drawbacks for these proposed methods, which usually require expensive instruments, tedious sample pretreatment together with professional operators, making them impractical for regular environments analysis. By comparison, the fluorescence-based sensing has drawn extensive attention because of its high sensitivity, selectivity, fast response time, simple operation, and accessible instrument requirement. Up until now, a number of fluorescent materials available have been well documented for the detection of Pi, mainly being focused on organic dyes, fluorescent polymers, semiconductor quantum dots (QDs), or fluorescent metal nanoclusters.10–14 However, these fluorophores frequently suffer from some limitations, such as high photobleaching and poor water solubility for dyes, laborious synthesis procedure for fluorescent polymers, high toxicity for QDs, as well as high cost and poor stability in an aqueous system for noble metal nanoclusters, rendering them unable to be directly applied to real aqueous environments.
Faced with these troubles, it will be highly desirable to devise rationally novel luminescence sensing materials for Pi analysis. Recent studies exhibit that luminescent metal–organic frameworks (MOFs) offer an ideal platform for chemical sensing due to their remarkable advantages over conventional fluorophores, in which the perfect combination of metal ions and organic ligands in MOFs provides more active sites and promotes preferred analyte binding.15–18 At the same time, the pre-concentration of the guest molecules in the network is beneficial for the selective and sensitive detection, which greatly expand its applications in the sensing field. In particular, lanthanide-based MOFs (Ln-MOFs) are of extensive interest because of their large Stokes shift values, high color purity and sharp emission lines originating from the characteristic 4f electronic transitions and have been successfully synthesized for the recognition of phosphate. For instance, Yang et al. found that Eu3(TTA)9trisphen could be used an efficiently colorimetric and fluorescent probe for the selective detection of phosphate in dimethyl sulphoxide (DMSO) solution.19 Zhao et al. proposed 3D Eu-BTB framework as an effective fluorescent sensing platform for Pi.20
In spite of the significant advances for crystalline MOFs materials, their static structures, irregular shapes, bulk size together with aqueous instability limit their application in aqueous media. As an emerging branch of metal–organic coordination polymers, amorphous ICPs have drawn growing interests owing to their structural diversity and superior performance modulation over conventional crystalline MOFs counterparts. For instance, ICPs developed by Mirkin and Oh had the advantages in achieving shape and size control while keeping the inorganic–organic backbone.21 The most obvious merits are uniform shape and size identity that can be tailored on a nanosized scale.22 Perhaps most importantly, nano-sized ICPs can be easily dispersed in aqueous media for environmental applications where bulk MOFs are not suitable. Stimulated by this, herein, a facile one-pot solvothermal technique is utilized to synthesize amorphous Eu-ICP nanospheres, in which 1,4-benzenedicarboxylic acid (H2BDC) is used as organic linkers, europium ions as metallic nodes, poly(vinylpyrrolidone) (PVP) as stabilizing agent, and N,N-dimethylformamide (DMF)-ethanol as mixed solvent. The unique optical properties of as-synthesized Eu-ICP nano-spheres can be utilized as potential detection of the Pi concentration in aqueous solution, in which the sensitivity and selectivity toward the target Pi as well as potential applications in real samples are exploited. The possible sensing mechanisms for Pi detection using the currently established fluorescent probe are also systematically investigated using Fourier-transform infrared (FT-IR), X-ray photoelectron spectroscopy (XPS), transmission electron microscope (TEM) and X-ray diffraction (XRD) techniques.
2. Experimental section
2.1 Chemicals and materials
Europium chloride hexahydrate (EuCl3·6H2O) was obtained from Sigma-Aldrich. H2BDC and DMF were supplied by Aladdin Chemistry Co. Ltd. Tris(hydroxymethyl) aminomethane, PVP (K30), HCl (37%), sodium phosphate (Na3PO4·12H2O) and ethanol were purchased from Sinopharm Chemical Reagent Co. Ltd. The solutions of various additives were prepared by dissolving NaAc, NaCl, NaI, NaNO2, NaNO3, CaCl2, MgCl2, BaCl2, CdCl2, arginine (Arg) and glutamic acid (Glu) (from Sinopharm Chemical Reagent Co. Ltd) in deionized water. Tris–HCl buffer solution was prepared according to the following protocol: 5 mM of Tris(hydroxymethyl) aminomethane was dissolved in deionized water, then the final pH and total volume of the solution was adjusted to 7.5 and 100 mL, respectively, using HCl (37%) and water. All vessels were cleaned with 1% HNO3 and then deionized water before use. Deionized water with a resistivity of above 18.2 MΩ cm was obtained using a JL-RO100 Millipore-Q Plus water purifier and used throughout the whole experiment processes. All reagents were used directly without any further purification during the experiments.2.2 Preparation of Eu-ICP nanospheres
Eu-ICP nanospheres were prepared using the reported solvothermal method with some modification.23,24 In brief, 0.64 mmol of EuCl3·6H2O, 0.12 mmol of H2BDC and 1.6 g of PVP were dissolved in 51.2 mL of DMF/ethanol mixture (v/v = 5![[thin space (1/6-em)]](https://www.rsc.org/images/entities/char_2009.gif) :3) under magnetic stirring for 30 min until complete dissolution of the solids. The resulting homogeneous solution was transferred into a 100 mL Teflon-lined stainless steel autoclave, which was then sealed and maintained at 150 °C for 12 h under static conditions. After being cooled down to room temperature, the obtained products were harvested from the reaction mixture via centrifugation and washed thoroughly with DMF and ethanol in turn for several times to remove the unreacted ligands and ions. Finally, the as-prepared powder was dried in vacuum at 60 °C to obtain Eu-ICP nanospheres.
:3) under magnetic stirring for 30 min until complete dissolution of the solids. The resulting homogeneous solution was transferred into a 100 mL Teflon-lined stainless steel autoclave, which was then sealed and maintained at 150 °C for 12 h under static conditions. After being cooled down to room temperature, the obtained products were harvested from the reaction mixture via centrifugation and washed thoroughly with DMF and ethanol in turn for several times to remove the unreacted ligands and ions. Finally, the as-prepared powder was dried in vacuum at 60 °C to obtain Eu-ICP nanospheres.
2.3 Characterization
The crystalline structure of the obtained samples was characterized by XRD (X'Pert Pro Super, Philips Co., the Netherlands) with Cu Kα radiation (1.5478 Å). The morphology and microstructural observations were carried out on field emission scanning electron microscope (FESEM, SU 8020) at an acceleration voltage of 5 kV and TEM (JEOL-2010) operating at an accelerating voltage of 200 kV. The compositions of resulting products were tested by energy-dispersive X-ray spectroscopy (EDS) attached to TEM. All fluorescence measurements were obtained with a FluoroMax-4 fluorescence spectrophotometer. Quantitative determination of the metal ions content was performed by Inductively Coupled Plasma Optical Emission Spectrometer (ICP-OES, ICP-6300 Thermo Fisher Scientific, USA). Elemental analyses of C, H, and N were conducted on an Elementar (Vario EL Cube). FT-IR spectra were recorded on a Thermo Nicolet NEXUS FT-IR spectrophotometer in the wave number range of 400–4000 cm−1 at a resolution of 4 cm−1 using the KBr pellet method. Solid-state NMR experiments of the samples were carried out on a Bruker Avance III 400 MHz spectrometer for 1H. The pH values were measured with a Mettler Toledo pH meter (FG2/EL2). The size distribution was figured out by Nano Measurer 1.2. XPS analyses were conducted on a Thermo Scientific ESCALAB 250, equipped with a focused monochromatic Al Kα X-ray source, in which all of the binding energies were calibrated with reference to the C 1s peak (284.8 eV).2.4 Fluorescent sensing of Eu-ICP nanospheres towards phosphate anions
In a typical detection process, 20 mg of Eu-ICP powder was dispersed in 50 mL of deionized water under ultrasonic condition to obtain the initial suspension of the fluorescent probe. And then 1 mL of the probe suspension and 2 mL of Tris–HCl buffer solution (pH = 7.5, 0.05 M) were added to a 10 mL centrifuge tube. Subsequently, different concentrations of Pi solution prepared freshly were sequentially added to the above mentioned suspension. Afterwards, the resulting mixture was diluted into the final volume of 4 mL with deionized water and immediately mixed thoroughly on the vortex mixer. After incubation for 40 min at room temperature, the corresponding fluorescence emission spectra were recorded in a quartz cuvette at an excitation wavelength of 260 nm, in which fluorescence intensity was measured at 615 nm. For comparison, the same procedure was also performed on the blank experiment.2.5 Determination of detection limit
The detection limit of phosphate (at the ratio of signal to noise = 3) is calculated with the following equation:| Limit of detection (LOD) = 3σ/m |
2.6 Selective detection of phosphate
To verify the selectivity of our proposed Eu-ICP fluorescent probe towards Pi determination, various substances, including Pi, Ac−, Cl−, I−, NO3−, NO2−, Ca2+, Mg2+, Ba2+, Cd2+, Arg and Glu, were separately added into the fluorescent probe suspension, all of which were kept at 5 fold concentration higher than that of Pi. The fluorescence measurements were conducted under the same conditions as the above phosphate anion sensing experiments. Then, the mixed solutions were transferred separately into a 1 mL quartz cuvette for measurements of fluorescent spectra at an excitation wavelength of 260 nm.2.7 Analysis of real water samples
The applicability of the proposed fluorescent probe for analysis of phosphates in a real sample was further evaluated. In this study, the as-obtained calibration curve was used to determine the Pi concentration in the tap water and Nanfei River (a representative eutrophic lake located in Hefei city of China) water. Prior to analysis, the water samples were filtered through 0.45 μm filter membrane. To evaluate the accuracy of the method proposed, different levels of Pi standard solution were added to the sampled solutions for recovery tests.3. Results and discussion
3.1 Morphology and structural analyses
The morphology and structural details of the as-prepared Eu-ICP are investigated by SEM observation. As revealed in Fig. 1a, the resulting Eu-ICP product has a roughly spherical shape with diameters ranging from 100 to 150 nm. Careful observation by the magnified SEM (the inset in Fig. 1a) shows that the surface of these nanospheres is rather rough and every nanosphere is composed of plenty of small particles with several nanometers. And the average size of these nanospheres is calculated to be ca. 120 nm based on Nano Measurer 1.2 (Fig. 1b). In the meantime, TEM is also used to characterize the synthetic Eu-ICP nanospheres in order to get insight into the further microstructural features. As expected, these nanospheres are assembled by many tiny nanoparticles (Fig. 1c), which is in agreement with the SEM observation. The composition of resulting nanospheres is clearly evidenced by EDS spectrum (Fig. 1d), in which the existence of the elements C, O, Eu and Cu provided the clear support for the formation of Eu-ICP.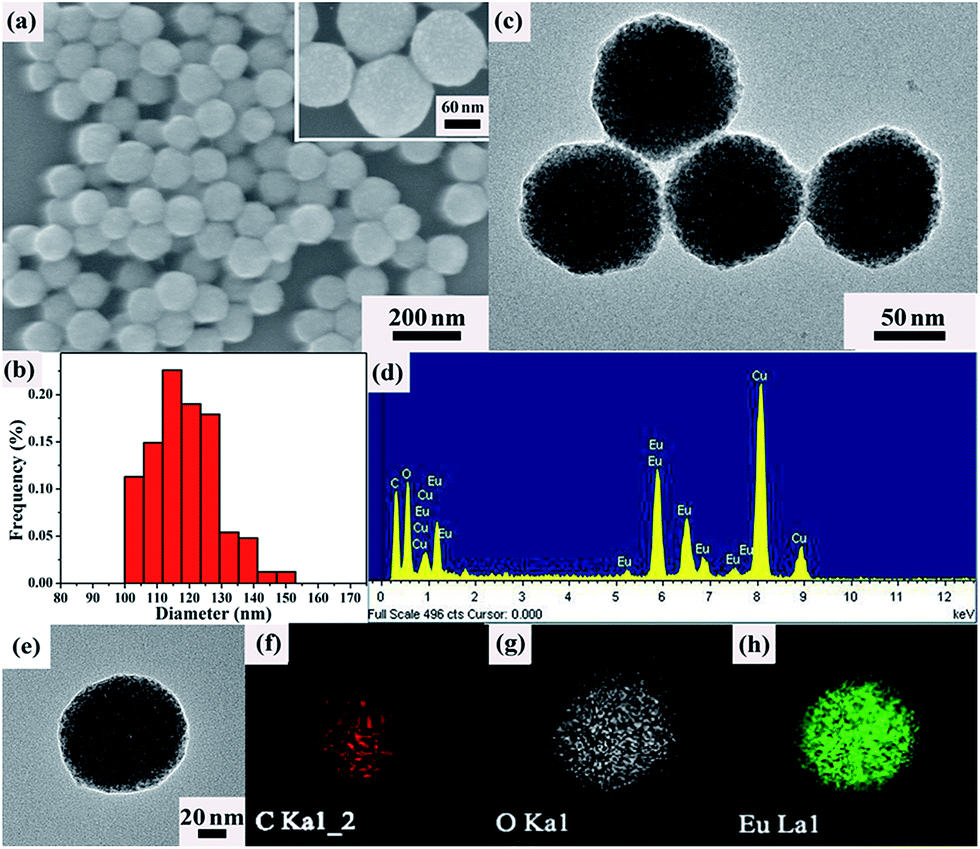 | ||
| Fig. 1 SEM image (a); size histogram (b); TEM image (c); EDS spectrum (d) and EDS mapping (e–h) of the as-synthesized Eu-ICP nanospheres. | ||
Furthermore, elemental mapping of the single Eu-ICP nanosphere (Fig. 1e–h) suggests the uniform distribution of elements C, O, and Eu throughout the whole nanosphere. It is noteworthy that the nanospheres obtained here will be favorable for the following sensing application in comparison with the traditional micrometer-scale structure.
In addition to the microstructure characterization, the composition and phase structure of the resultant nanospheres are investigated via various techniques, including XRD, element analysis. From Fig. 2a, it is found that these nanospheres do not show the typical characteristic peaks, revealing that they are not a crystalline material but typical amorphous ICP particles in which the disordered coordination exists between Eu3+ and carboxylate groups of organic ligands. In view of the amorphous characteristic, the exact composition of the resulting ICP particles is further elucidated via elemental analysis. As a result, the amount of C, H and N elements is 17.39%, 2.51%, 1.76%, respectively. Besides, according to ICP-OES measurement, the precise europium weight is determined to be 41.76% in the resultant Eu-ICP nanospheres after acid digestion. Accordingly, the concentration of O element in the product is 36.58%. On the basis of the aforementioned results, the product can be speculated to be a chemical formula of Eu2.2C11.5H20O18.2N. XPS analysis provides more information about the chemical composition and states of the resulting coordination polymer particles (Fig. S1, see ESI†). As depicted in Fig. S1a (see ESI†), the peaks of Eu, C, O, and N are found in the survey spectrum. The high resolution spectrum of Eu 3d (Fig. S1b, see ESI†) shows the peaks located at 1134.6 eV and 1164 eV assigned to the binding energy of Eu 3d5/2 and Eu 3d3/2, respectively, which are consistent with the energy region of Eu(III) species that coordinates with carboxyl.25–27
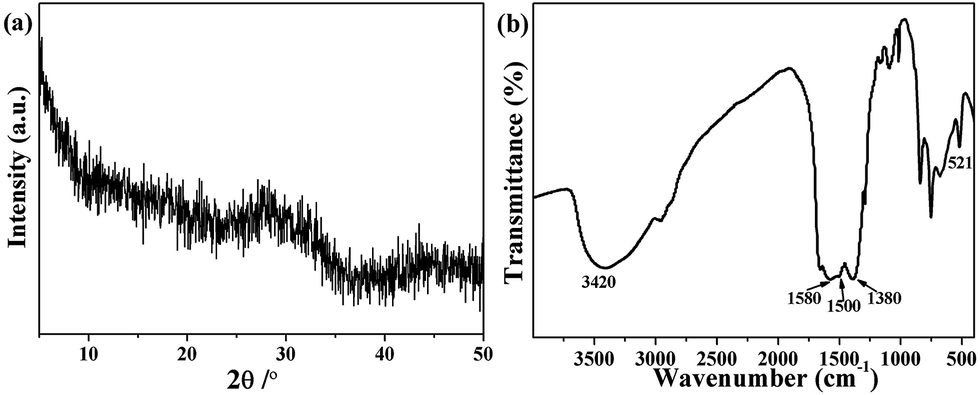 | ||
| Fig. 2 Typical XRD pattern (a) and FT-IR spectrum (b) of Eu-ICP prepared under 3/5 of ethanol/DMF ratio in the presence of PVP as stabilizing agent. | ||
Aside from the composition analysis, FT-IR spectrum is used to identify the functional groups of the resulting Eu-ICP product. As shown in Fig. 2b, the broad absorption band at around 3420 cm−1 can be assigned to O–H stretching vibrations, indicates the richness of free and/or coordinated water molecules and the corresponding remarkable water solubility of the resultant Eu-ICP nanospheres. Obviously, there is no a typical band from H2BDC groups (1715–1680 cm−1), confirming that the H2BDC groups are fully deprotonated, which is consistent with the previous report.28 As expected, there exist the characteristic asymmetric stretching vibrations of carboxylic groups at 1580 and 1500 cm−1 and the symmetric vibrations centred at 1380 cm−1. Typically, the band at 521 cm−1 is attributed to the Eu–O stretching vibrations, which reveals that the Eu atoms have been successfully coordinated with the carboxylic groups.29 Additionally, the characteristic band of the amide group (1650 cm−1) is not observed, indicating that there is no DMF in the as-synthesized sample.30 To identify further verify the functional groups of the as-obtained Eu-ICP nanospheres, 1H NMR spectra were measured. As displayed in Fig. S2 (see ESI†), there exist two lines at δ = 8.07 and 13.30 ppm for H2BDC, which are attributed to the aromatic and acidic protons, respectively.31,32 In the case of Eu-ICP, there is only one broad peak at around 7.39 ppm, in which the disappearance of the peak assigned to the acidic protons indicates that the carboxylic acid is deprotonated as expected. The results mentioned above confirm that the Eu-ICP nanospheres are successfully produced.
3.2 Effect of reaction parameters on the resulting products
Note that the subtle changes in the reaction conditions allow the modulation of size and morphologies of the resulting particles. In order to explore the influence of solvents on the morphology of the resulting products, the volume ratios of ethanol to DMF are varied from 0 to 5/3 while keeping other synthetic parameters identical. Fig. S3 (see ESI†) displays several various representative morphologies of the resulting Eu-ICP. When the pure DMF is used as solvent, large irregular particles with several micrometers are produced (Fig. S3a, see ESI†). By introducing ethanol to DMF solution with ethanol/DMF volume ratio of 1/7, the resulted product exhibits many spheres which aggregate with each other (Fig. S3b, see ESI†). When the ratio of ethanol/DMF is raised to 3/5, the obtained nanospheres become more regular and nearly monodisperse with an average diameter of 120 nm (Fig. 1a). Nevertheless, further increasing the amount of ethanol, i.e. the volumetric ratio of ethanol/DMF to 5/3, part of nanospheres seem to be fused together, accompanied by the presence of nanoflowers with several petals composed of irregular particles (Fig. S3c, see ESI†). Apparently, the morphology and size of Eu-ICP particles can be easily modulated by the ratio of ethanol/DMF, in which a judicious ratio choice results in highly uniform nanospheres. That is to say, solvents play an important role in determining the final morphologies of the products and the addition of ethanol solvent tends to develop spherical morphologies. In our present system, DMF is indispensable for the preparation of Eu-ICP nanospheres since it acts as the solvent for H2BDC, while ethanol can provide different coordination environment of metal ions and change the growth habit of ICP,33,34 which is consistent with the former report that the properties of mixed solvents have significant influence on the control of the nucleation and crystal growth rates through altering the exchange rate between metal ions and organic ligand.35 Another possible reason is that the polarity of the solvent affects the solubility of the resulting particles and is thus responsible for the discrepancies in morphologies of the synthesized Eu-ICP products.Apart from the influence of the solvents, PVP also plays a key role in determining the morphology and crystallinity of the resulting particles. In a control experiment, no PVP is added to the reaction solution while kept all other conditions identical. The obtained product displays irregular sphere-like shape with a very broad size distribution from tens to hundreds nanometers in diameter (Fig. S4a, see ESI†). Interestingly, the introduction of PVP can induce the evolution from the irregular aggregates to relatively uniform sizes and shapes (Fig. 1a), indicating the structural stabilizer effect of PVP. This phenomenon is very similar to Wang's report, in which the addition of PVP would lead to the formation of uniform Fe(III)-MOF-5 hollow octahedral nanostructures instead of heavily aggregated nanostructures.23 Previous studies have proved that PVP could generate a coordination modulation effect, by selectively adsorbing on solid–liquid interface, altering the interfacial free energy of the system, providing steric confinement effect and thus improving the regularity of the crystal morphology.34 The influence of PVP on the crystallinity of the resulting Eu-ICP structures is also studied based on the XRD analysis. When PVP is added to the reaction system, the product is typical amorphous (Fig. 2a). Nevertheless, a significant crystalline change takes place in the absence of PVP, in which the corresponding XRD pattern (Fig. S4b, see ESI†) matches well with that of the major peaks in simulated pattern of Eu-ICP (CCDC-1063111), suggesting its typical crystalline characteristic. That is, these nanospheres undergo the transformation from the highly crystalline structures to amorphous structures by the introducing of PVP. This interesting phenomenon can be attributed to the finding that PVP not only stabilizes the nanoparticles in the reaction solution, but also provides the nanoparticles with an enhanced affinity to coordination-polymer spheres through weak coordination interactions between pyrrolidone rings (C![[double bond, length as m-dash]](https://www.rsc.org/images/entities/char_e001.gif) O) and metal atoms, and perhaps also through hydrophobic interactions between a polar groups of PVP and organic linkers.23,36
O) and metal atoms, and perhaps also through hydrophobic interactions between a polar groups of PVP and organic linkers.23,36
3.3 Sensing properties of Eu-ICP towards phosphate
The luminescence properties of Eu-ICP nanospheres are investigated as shown in Fig. 3. The excitation spectrum is obtained by monitoring the emission wavelength at 615 nm. It can be seen that the excitation spectrum has a broad band in the range of 220 to 310 nm, in which the two peaks at 260 nm and 286 nm are attributed to the charge-transfer between O2− and Eu3+ ions and π → π* electron transitions of the organic bridging ligands, respectively.37 Upon excitation at 260 nm, the emission spectrum of Eu-ICP exhibit five characteristic bands centred at 579, 592, 615, 650, 699 nm, which are ascribed to 5D0 → 7FJ (J = 0, 1, 2, 3, 4) transitions of the Eu3+ ions.38 Among them, the 5D0 → 7F0 transition appears since the Eu3+ ions in the Eu-ICP occupy sites with a low symmetry,39 while the 5D0 → 7F1 transition belongs to magnetic–dipole transition, independent of the local environment around Eu3+ ions. It is noted that the whole emission spectrum is dominated by the 5D0 → 7F2 transition with the highest intensity, i.e. the so-called hypersensitive transition, corresponding to an electric dipole transition. The 5D0 → 7F3 transition shows a mixed electric dipole and magnetic dipole character and the 5D0 →7F4 corresponds to electric dipole transition. As reported, the intensity ratio of 5D0 → 7F2 to 5D0 → 7F1 is strongly dependent on the local symmetry of Eu3+ ions and thus can be considered an indicator for the local environment of Eu3+ ions.29 Herein, the value is calculated to be about 2, suggesting the low symmetric coordination environment around Eu3+. Furthermore, stronger 5D0 → 7F2 transition than 5D0 → 7F1 supports the conclusion that Eu3+ ions occupy the non-inversion center sites based on the transition rules of Eu3+, indicating the successful encapsulation of Eu3+ inside the resultant framework.40 In addition, no any emission band originated from the organic ligands is observed, indicating efficient energy-transfer from the organic ligand to the Eu3+ center.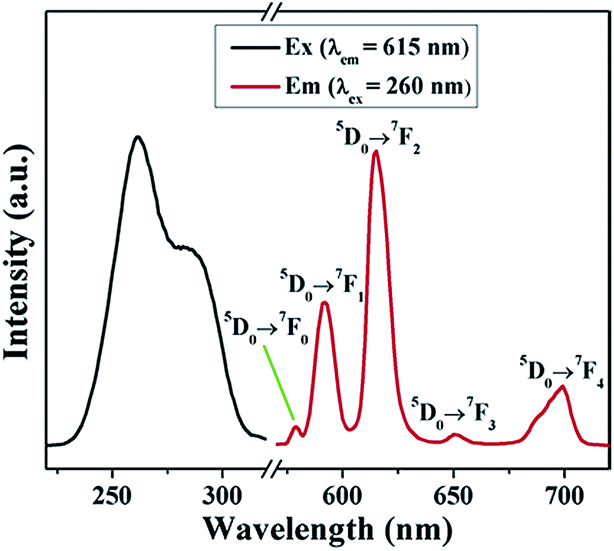 | ||
| Fig. 3 PL spectra of Eu-ICP nanospheres: excitation spectrum (black) and emission spectrum (red). | ||
To examine the possibility of the resulting materials as a fluorescent probe for detecting Pi in an aqueous system, the structural and luminescent stability of Eu-ICP in aqueous solution have been investigated. The structural stability of the Eu-ICP nanospheres is evaluated by immersing them into water for 24 h and invariable spherical particles along with SEM observation (Fig. S5, see ESI†) strongly suggest that these Eu-ICP particles are stable in water. The ability to be compatible with water makes it possible to develop the product into a fluorescent probe in aqueous media.41 Considering that the pH of the solution is another important parameter that affects the luminescent stability, the synthesized Eu-ICP nanospheres are immersed in a series of aqueous solutions with varying pH values (Fig. S6a, see ESI†). As a result, the pH has almost no effect on the luminescence intensity of Eu-ICP in a pH range from 5 to 9. Additionally, the spectral response of Eu-ICP is independent of ionic strength, as demonstrated by a negligible effect on the fluorescence intensity under ionic strength ranging from 0.1 to 2 mM (Fig. S6b, see ESI†), implying that the developed fluorescent sensor possesses excellent fluorescence stability. The excellent structural and fluorescent stability as well as pH-independent fluorescent behavior offer the essential prerequisites for Eu-ICP as an ideal platform for Pi sensing.
Taking into account the excellent luminescence and water stability of the as-synthesized Eu-ICP probes, we examine their potential application for detecting Pi. The relationship between fluorescence intensity and concentration of Eu-ICP suspension is firstly investigated in order to determine appropriate Pi detection concentration of Eu-ICP. As depicted in Fig. S7 (see ESI†), there is a quite good linear correlation between the fluorescent intensity and the concentration of Eu-ICP ranging between 20 and 120 ppm. Thus, the concentration of 100 ppm for Eu-ICP suspension is chosen as the optimal conditions for the following quantitative determination on the promise of adequate dispersity and stability. In order to examine the sensitivity of the proposed sensing probe for quantitative determination of phosphate, the variation of fluorescence intensity induced by different concentrations of Pi is recorded in 25 mM of Tris–HCl buffer (pH 7.5) at room temperature. As demonstrated in Fig. 4a, the fluorescence intensity of Eu-ICP nanospheres is highly sensitive to Pi and gradually decreased with the increasing of Pi concentration while the shape and position of the emission spectra do not change accordingly. And almost complete quenching of the fluorescence is observed when the concentration of Pi is added up to 500 μM. Further analysis shows that this quenching process can be well described by the linear Stern–Volmer equation: I0/I = 1 + Ksv[Pi], in which I and I0 correspond to the maximum emission intensity of Eu-ICP nanospheres at 615 nm in the presence and absence of Pi, respectively, Ksv represents the quenching rate constant, and [Pi] is the phosphate concentration. As shown in Fig. 4b, there exists a good linear relationship between the fluorescence intensity ratios (I0/I) and the Pi concentration in the range of 2–100 μM with correlation coefficient R2 = 0.997. And the corresponding Ksv value is calculated as 2.79 × 10⁴ L mol−1, revealing the high quenching efficiency of Eu-ICP induced by Pi.42 The LOD of phosphate is estimated to be 0.83 μM, lower than the detection requirement of Pi discharge criteria in aquatic environment, reported to be 6.4–320 μM.43,44 Compared to other systems for Pi detection (Table 1), the sensitivity of the proposed Eu-ICP fluorescence probe was quite competitive. These results indicate that the developed Eu-ICP probe has the potential to detect Pi at very low concentration levels.
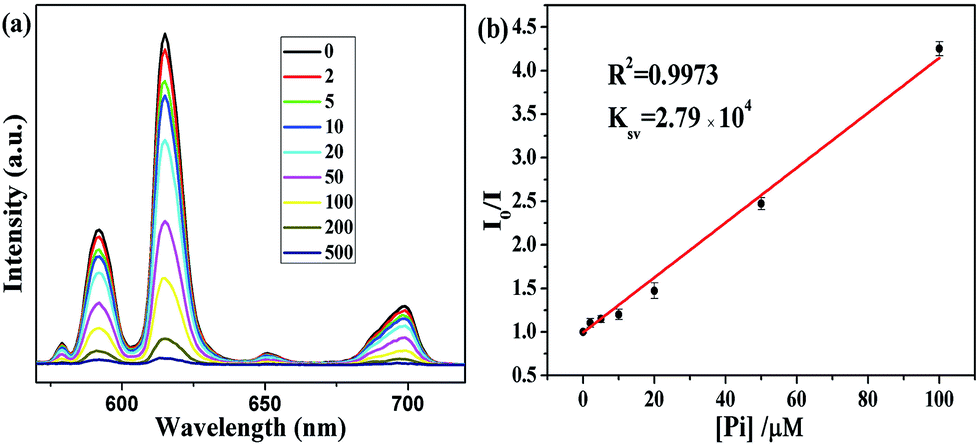 | ||
| Fig. 4 (a) Fluorescent quenching of Eu-ICP suspension (100 mg L−1) in Tris–HCl buffer solution (pH = 7.5, 25 mM) upon the addition of different concentrations (μM) of Pi under excitation at 260 nm; (b) linear fitting curve between fluorescence intensity and concentration of Pi. | ||
| Systems | LOD (μM) | Linear range (μM) | References |
|---|---|---|---|
| Eu3(TTA)9trisphen | 67.2 | 200–700 | 19 |
| Eu-BTB framework | 10 | 10–1000 | 20 |
| UiO-66-NH2 MOFs | 1.25 | 5–150 | 43 |
| Cyanine-based chemosensor | 0.94 | 0–2510 | 45 |
| DQS/Sn4+ complex | 47.1 | 30.2–45.7 | 46 |
| S2–Zn complex | 2.4 | — | 47 |
| FP-Fe3+ chemosensor | 0.3 | 0–2.5 | 48 |
| Tb(H2O)BTB MOF | 35 | 40–400 | 49 |
| CBNPs-modified electrode | 6 | 0–80 | 50 |
| Eu-ICP nanospheres | 0.83 | 2–100 | This work |
Except for the sufficient sensitivity, an ideal sensing platform should have features of excellent specificity towards the target Pi in an effort to meet the detection requirement in real aqueous environment. The selectivity of the proposed Eu-ICP probe for Pi is evaluated by monitoring fluorescence response in the presence of various substances, including anions such as Pi, Ac−, Cl−, I−, NO3−, NO2−, cations such as Ca2+, Mg2+, Ba2+, Cd2+, and amino acids (Arg, Glu), all of which are kept at 5 fold concentration higher than that of Pi. As displayed in Fig. 5, only Pi can induce a significant fluorescent quenching effect, whereas no obvious alteration on the fluorescent intensity is observed upon the introducing of other ions or amino acids mentioned above, despite very high concentrations. These results substantially suggest that the current fluorescent assay has a specific recognition capability towards Pi, which can be attributed to the strong and specific affinity between europium centers and Pi. The excellent specificity combined with high sensitivity makes it possible to utilize the designed Eu-ICP probes as a promising candidate for the selective identification of Pi in real applications.
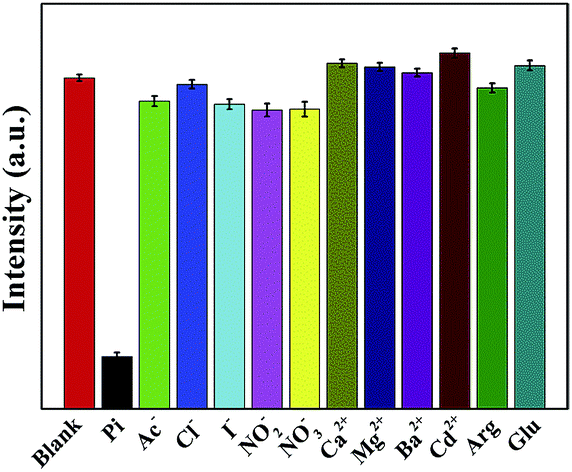 | ||
| Fig. 5 Fluorescence response of the as-synthesized Eu-ICP suspension (100 mg L−1) towards phosphate and other various substances in Tris–HCl buffer solution (pH = 7.5, 25 mM). The concentration of Pi was 0.2 mM and that of other substances was 1 mM. The excitation wavelength was 260 nm and the emission at 615 nm was monitored. | ||
In order to demonstrate the accuracy of the proposed fluorescent probe, tap water and Nanfei River water are testified as representative real environmental samples, and different levels of Pi standard solution were added to the sampled solutions for recovery tests. As summarized in Table 2, upon addition of phosphate at three known concentration levels into the water samples, the quantitative recoveries of Pi are found in the range of 102.3 to 111.2%, which is acceptable for the detection of Pi in such complex matrix. And the corresponding relative standard deviation (RSD) values are less than 2% during three measurements, indicating good reproducibility and accuracy. All the aforementioned results reveal the capability of the proposed sensing system for determination of Pi in the real environmental samples with high reliability and accuracy as well as satisfactory recoveries.
| Water samples | Spiked (μM) | Measured (μM) (mean ± standard deviation) | Recovery (%) (mean ± standard deviation) |
|---|---|---|---|
| Tap water | 0 | Not detected | — |
| 10 | 10.36 ± 0.13 | 103.60 ± 1.3 | |
| 20 | 21.59 ± 0.24 | 107.95 ± 1.2 | |
| 50 | 53.17 ± 0.86 | 106.34 ± 1.7 | |
| Nanfei River water | 0 | 30.37 | — |
| 10 | 40.92 ± 0.15 | 105.50 ± 1.5 | |
| 20 | 52.14 ± 0.14 | 108.85 ± 0.7 | |
| 50 | 85.05 ± 0.90 | 109.36 ± 1.8 |
3.4 Possible Pi sensing mechanism
To investigate the sensing mechanism of the fabricated Eu-ICP probes towards phosphate, FT-IR measurement is conducted on the resulting phosphate-loaded Eu-ICP (denoted as Eu-ICP-Pi) sample. As shown in Fig. 6, a characteristic band at 1070 cm−1, assigned to the P–O stretching vibration, appears after incubation in an aqueous solution of phosphate, confirming the inclusion of phosphate into the Eu-ICP framework.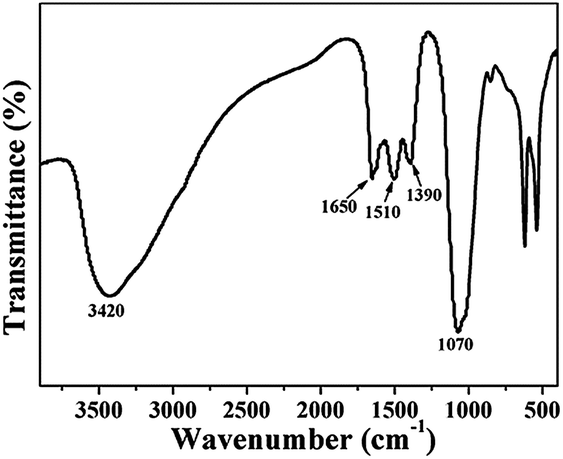 | ||
| Fig. 6 FT-IR spectrum of Eu-ICP after incubation with Pi. | ||
Compared to free phosphate, there exists an obvious red shift for the P–O bonds from 1100 to 1070 cm−1, indicating the occurrence of phosphoric complex because the tethering of P–O bonds can limit the stretching vibrations and consequently decrease the vibration frequency.43 Furthermore, the stretching vibrations of carboxylic groups in Eu-ICP-Pi show a blue shift to 1650, 1510 and 1390 cm−1, indicating Pi weakens the interaction between Eu3+ and H2BDC ligands and thus makes carboxylic groups more free and the vibration stronger.51 The phenomenon can be attributed to the fact that Eu3+ ions display higher affinity with oxygen-donor atoms originated from Pi than that from carboxylate groups.13,42,52
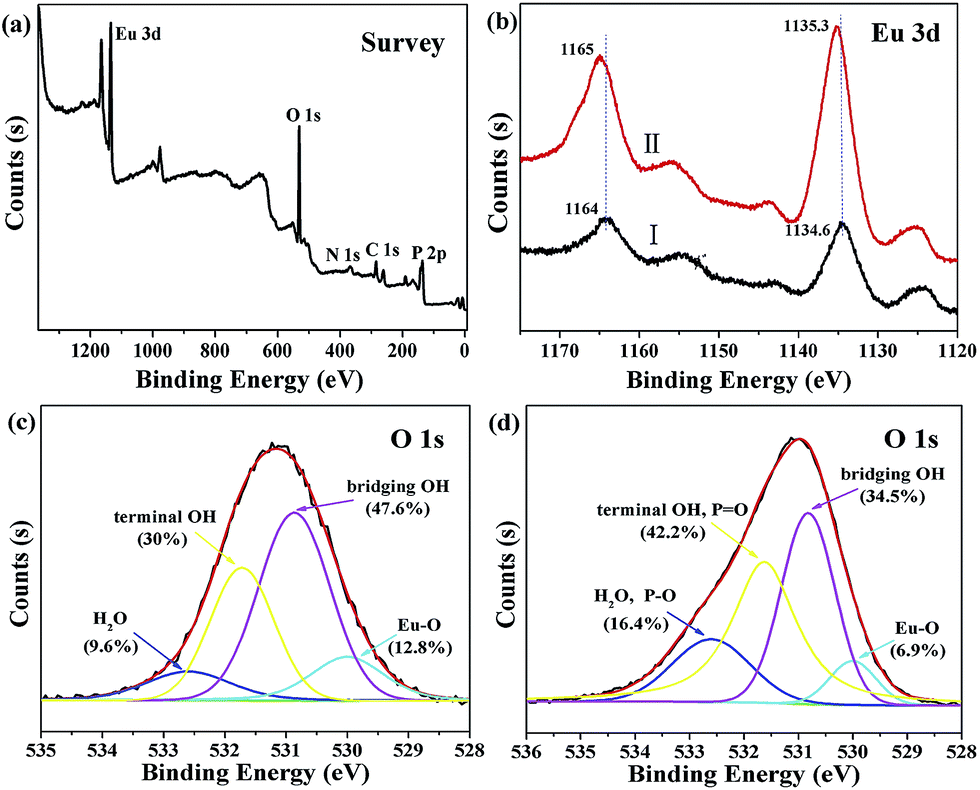
XPS spectra are also performed by revealing the variation of binding energies of different elements on the resulting Eu-ICP-Pi sample with the purpose of further elucidating the possible sensing mechanism. As depicted in Fig. 7a, the presence of a distinct peak at ∼133.5 eV confirms the successful incorporation of phosphate into Eu-ICP, in agreement with the FT-IR analysis. Additionally, Eu 3d spectra before and after incubation with phosphate are shown in Fig. 7b. For the freshly prepared Eu-ICP (Curve I), the binding energies of 1164 and 1134.6 eV are assigned to Eu 3d3/2 and Eu 3d5/2, respectively. After interacting with phosphate (Curve II), the two peaks shift towards the high-energy side (a positive shift of ca. 1.0 eV), which might be attributed to the replacement of carboxylic groups with phosphoric groups. This phenomenon is similar to the previous report that Eu3+ ions cause the loss of electron density through bonding to more electronegative P–O bonds, which in turn increases the 3d electrons binding energies.43,53 High resolution O 1s spectrum of Eu-ICP (Fig. 7c) can be divided into four peaks positioned at 532.6, 531.7, 530.9, and 530 eV, which might be assigned to O in H2O, terminal OH, bridging OH and Eu–O, respectively, based on the binding energy of different oxygen species. After incubation with Pi, the O 1s spectrum of Eu-ICP-Pi (Fig. 7d) still consists of four peaks. Nevertheless, the area ratio of the peaks at 532.6 and 531.7 eV to the total oxygen increased from 9.6% and 30% to 16.4% and 42.2%, respectively, which might be attributed to the possible formation of O–P bonds; whereas the percentage of bridging OH and Eu–O in the total surface oxygen reduced, suggesting the replacement of hydroxyl groups by phosphate and the possible coordination of europium atoms in Eu-ICP with Pi, consistent with the results of the above FT-IR analyses.
 | ||
| Fig. 7 XPS spectra: (a) survey spectrum of Eu-ICP-Pi; (b) Eu 3d before (Curve I) and after (Curve II) of Eu-ICP incubation with Pi; O 1s of Eu-ICP before (c) and after (d) incubation with Pi. | ||
The variation of morphologies and structure of the fluorescent probe is also checked via various techniques after kept in contact with Pi. In the absence of Pi, transparent solution is clearly observed. Once Pi is introduced into the system, the solution immediately becomes opaque, which provides the solid evidence for the formation of aggregates of Eu-ICP-Pi triggered by the presence of Pi. The phenomenon can be also evidenced by SEM and TEM examinations. Obviously, the morphologies of the products transform from the original mono-disperse nanospheres (Fig. 1a and b) into the spherical aggregates with needle-like nanorods distributed on their surface (Fig. 8a and b). Further HRTEM image (the inset in Fig. 8b) demonstrates that the nanorods situated on the surface of the spherical aggregates can be assigned to hexagonal EuPO4, in which 3.03 Å of inter-planar spacing corresponds to (120) of EuPO4 crystal. In order to further corroborate the element compositions and corresponding spatial distribution of the resultant Eu-ICP-Pi compound, EDS mapping analyses are performed. As displayed in Fig. 8c–f, carbon (gray zone), oxygen (blue zone), phosphorus (green zone) and europium (red zone) are all well distributed throughout the entire region of the spherical aggregates.
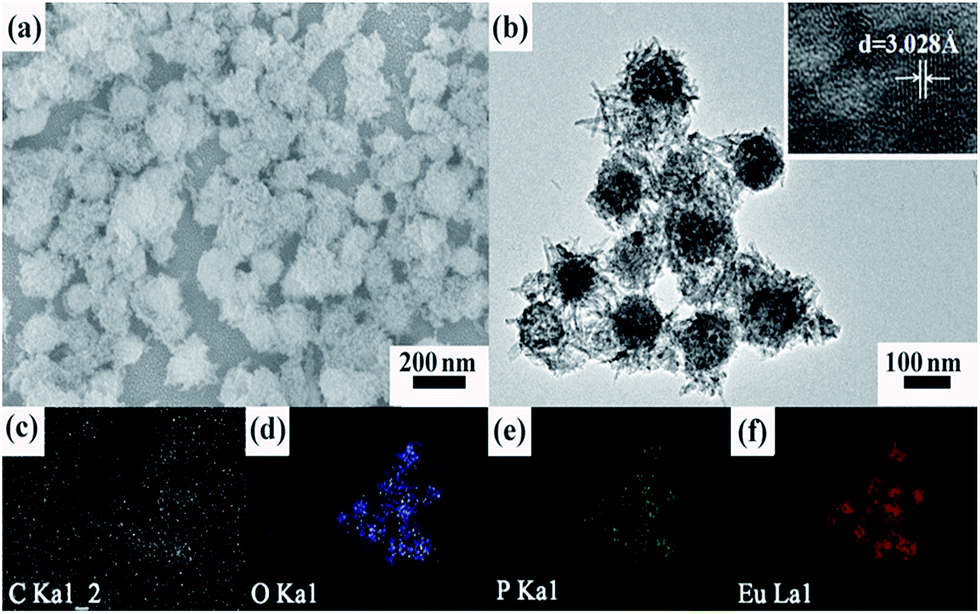 | ||
| Fig. 8 (a) SEM; (b) TEM images of the resulting Eu-ICP-Pi; and (c–f) EDS mapping. The inset showing the HRTEM lattice fringes of a single nanorod. | ||
Except for the investigations on the basis of morphology and composition, the powder XRD is also employed to study on the structural of the resulting Eu-ICP-Pi compounds. As demonstrated in Fig. 9, the major diffraction peaks can be predominantly indexed as the hexagonal EuPO4 phase (PDF no. 20-1044), confirming the chemical interaction between phosphate and the europium centers. In addition, the relatively broad diffraction peaks indicate the crystalline nature with small size, in accordance with TEM observations. Based on the abovementioned analyses, it can be reasonably speculated that the introduction of Pi may damage the inherent structure of Eu-ICP due to the strong coordination of the europium centers in Eu-ICP with Pi, which interrupts the charge-transfer between O2− and Eu3+ ions and π → π* electron transitions of the organic bridging ligands, accordingly resulting in the fluorescence quenching.
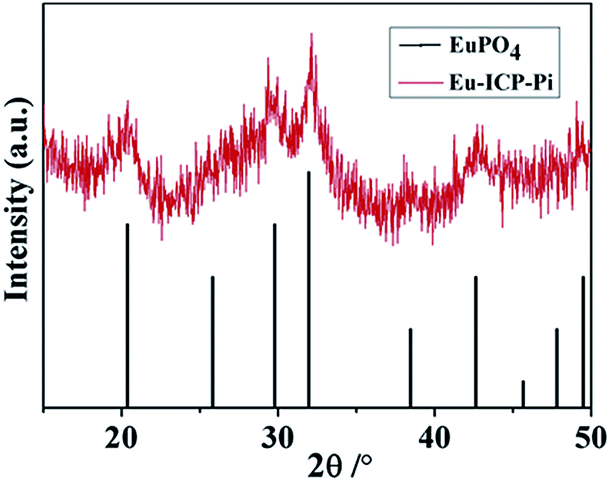 | ||
| Fig. 9 Powder XRD patterns of Eu-ICP-Pi (red) and standard EuPO4 (black). | ||
4. Conclusions
In summary, uniform amorphous Eu-ICP nanospheres have been successfully fabricated via a facile one-pot solvothermal strategy. Aside from the unique fluorescent properties, the as-synthesized Eu-ICP nanospheres exhibit excellent water stability as well as pH-independent emission behavior. Thanks to the strong coordination effect between europium centres and Pi, the developed Eu-ICP can be exploited as an effective fluorescent probe for detecting Pi in aqueous solution. As expected, the fluorescent assay possesses excellent fluorescent quenching behavior in correlation with the incubated phosphate level, accompanied by a linear range of 2–100 μM and detection limit of 0.83 μM, lower than the maximum allowable level of phosphate in drinking water by EPA. In addition, the proposed probe displays good specificity toward Pi relative to other common ions or amino acids. What is more, the accuracy of the developed sensing system for Pi detection is further validated in real water samples, with satisfactory recoveries and low RSD values. All in all, the newly developed probe features ease of synthesis, good water solubility and stability, high sensitivity and specific recognition function, rationalizing its suitability for the Pi analysis in the complex aqueous systems.Acknowledgements
The authors gratefully acknowledge the financial support from National Natural Science Foundation of China (Grant No. 51572263, 51272255, 51472246).Notes and references
- J. M. Estela and V. Cerda, Talanta, 2005, 66, 307–331 CrossRef CAS PubMed.
- M. D. Patey, M. J. A. Rijkenberg, P. J. Statham, M. C. Stinchcombe, E. P. Achterberg and M. Mowlem, Trends Anal. Chem., 2008, 27, 169–182 CrossRef CAS.
- C. Warwick, A. Guerreiro and A. Soares, Biosens. Bioelectron., 2013, 41, 1–11 CrossRef CAS PubMed.
- A. T. Law al and S. B. Adeloju, Talanta, 2013, 114, 191–203 CrossRef CAS PubMed.
- S. Zaruba, A. B. Vishnikin and V. Andruch, Microchem. J., 2015, 122, 10–15 CrossRef CAS.
- C. Han, J. J. Geng, X. C. Xie, X. R. Wang, H. Q. Ren and S. X. Gao, Environ. Sci. Technol., 2012, 46, 10667–10674 CrossRef CAS PubMed.
- S. Cosnier, C. Gondran, J. C. Watelet, W. D. Giovani, R. P. M. Furriel and F. A. Leone, Anal. Chem., 1998, 70, 3952–3956 CrossRef CAS.
- M. A. Rahman, D. S. Park, S. C. Chang, C. J. McNeil and Y. B. Shim, Biosens. Bioelectron., 2006, 21, 1116–1124 CrossRef CAS PubMed.
- M. Benounis, Sens. Actuators, B, 2015, 216, 57–63 CrossRef CAS.
- X. J. Wan, T. Q. Liu, H. Y. Liu, L. Q. Gu and Y. W. Yao, RSC Adv., 2014, 4, 29479–29484 RSC.
- A. Gogoi and G. Das, RSC Adv., 2014, 4, 55689–55695 RSC.
- S. I. Kondo and R. Takai, Org. Lett., 2013, 15, 538–541 CrossRef CAS PubMed.
- V. Borse, P. Jain, M. Sadawana and R. Srivastava, Sens. Actuators, B, 2016, 225, 340–347 CrossRef CAS.
- C. Dai, C. X. Yang and X. P. Yan, Anal. Chem., 2015, 87, 11455–11459 CrossRef CAS PubMed.
- M. D. Allendorf, C. A. Bauer, R. K. Bhakta and R. J. Houk, Chem. Soc. Rev., 2009, 38, 1330–1352 RSC.
- Z. Hu, B. J. Deibert and J. Li, Chem. Soc. Rev., 2014, 43, 5815–5840 RSC.
- D. Tian, Y. Li, R. Y. Chen, Z. Chang, G. Y. Wang and X. H. Bu, J. Mater. Chem. A, 2014, 2, 1465–1470 CAS.
- J. Q. Liu, J. Wu, F. M. Li, W. C. Liu, B. H. Li, J. Wang, Q. L. Li, R. Yadave and A. Kumar, RSC Adv., 2016, 6, 31161–31166 RSC.
- C. Yang, J. Xu, J. Li, M. Lu, Y. Li and X. Wang, Sens. Actuators, B, 2014, 196, 133–139 CrossRef CAS.
- H. Xu, C. S. Cao and B. Zhao, Chem. Commun., 2015, 51, 10280–10283 RSC.
- M. Oh and C. A. Mirkin, Nature, 2005, 438, 651–654 CrossRef CAS PubMed.
- A. M. Spokoyny, D. Kim, A. Sumrein and C. A. Mirkin, Chem. Soc. Rev., 2009, 38, 1218–1227 RSC.
- Z. Zhang, Y. Chen, X. Xu, J. Zhang, G. Xiang, W. He and X. Wang, Angew. Chem., Int. Ed., 2014, 53, 429–433 CrossRef CAS PubMed.
- D. Aulakh, J. R. Varghese and M. Wriedt, Inorg. Chem., 2015, 54, 8679–8684 CrossRef CAS PubMed.
- X. Tan, M. Fang, J. Li, Y. Lu and X. Wang, J. Hazard. Mater., 2009, 168, 458–465 CrossRef CAS PubMed.
- G. Sheng, H. Dong, R. Shen and Y. Li, Chem. Eng. J., 2013, 217, 486–494 CrossRef CAS.
- X. L. Tan, X. K. Wang, H. Geckeis and T. Rabung, Environ. Sci. Technol., 2008, 42, 6532–6537 CrossRef CAS PubMed.
- G. Socrates, Infrared Characteristic Group Frequencies, John Wiley & Sons, Stonebridge Press, Bristol, 1980 Search PubMed.
- B. Xu, H. Guo, S. Wang, Y. Li, H. Zhang and C. Liu, CrystEngComm, 2012, 14, 2914–2919 RSC.
- G. R. Li, C. C. Xie, Z. R. Shen, Z. Chang and X. H. Bu, Dalton Trans., 2016, 45, 7866–7874 RSC.
- T. Loiseaua, H. Muguerraa, G. Ferey, M. Haouasa and F. Taulelle, J. Solid State Chem., 2005, 178, 621–628 CrossRef.
- K. K. Wang, C. F. Li, Y. X. Liang, T. T. Han, H. L. Huang, Q. Y. Yang, D. H. Liu and C. L. Zhong, Chem. Eng. J., 2016, 289, 486–493 CrossRef CAS.
- L. He, Y. Liu, J. Liu, Y. Xiong, J. Zheng, Y. Liu and Z. Tang, Angew. Chem., Int. Ed., 2013, 52, 3741–3745 CrossRef CAS PubMed.
- D. Li, H. Wang, X. Zhang, H. Sun, X. Dai, Y. Yang, L. Ran, X. Li, X. Ma and D. Gao, Cryst. Growth Des., 2014, 14, 5856–5864 CAS.
- A. Umemura, S. Diring, S. Furukawa, H. Uehara, T. Tsuruoka and S. Kitagawa, J. Am. Chem. Soc., 2011, 133, 15506–15513 CrossRef CAS PubMed.
- G. Lu, S. Li, Z. Guo, O. K. Farha, B. G. Hauser, X. Qi, Y. Wang, X. Wang, S. Han, X. Liu, J. S. DuChene, H. Zhang, Q. Zhang, X. Chen, J. Ma, S. C. Loo, W. D. Wei, Y. Yang, J. T. Hupp and F. Huo, Nat. Chem., 2012, 4, 310–316 CrossRef CAS PubMed.
- Y. S. Yang, M. L. Gong, Y. Y. Li, H. Y. Lei and S. L. Wu, J. Alloys Compd., 1994, 207, 112–114 CrossRef.
- H. Zhang, L. Zhou, J. Wei, Z. Li, P. Lin and S. Du, J. Mater. Chem., 2012, 22, 21210–21217 RSC.
- K. Liu, H. You, G. Jia, Y. Zheng, Y. Song, M. Yang, Y. Huang and H. Zhang, Cryst. Growth Des., 2009, 9, 3519–3524 CAS.
- F. Tao, Z. Wang, L. Yao, W. Cai and X. Li, J. Phys. Chem. C, 2007, 111, 3241–3245 CAS.
- Y. Zhou, H. H. Chen and B. Yan, J. Mater. Chem. A, 2014, 2, 13691–13697 CAS.
- H. X. Zhao, L. Q. Liu, Z. D. Liu, Y. Wang, X. J. Zhao and C. Z. Huang, Chem. Commun., 2011, 47, 2604–2606 RSC.
- J. Yang, Y. Dai, X. Y. Zhu, Z. Wang, Y. S. Li, Q. X. Zhuang, J. L. Shi and J. L. Gu, J. Mater. Chem. A, 2015, 3, 7445–7452 CAS.
- W. L. Cheng, J. W. Sue, W. C. Chen, J. L. Chang and J. M. Zen, Anal. Chem., 2010, 82, 1157–1161 CrossRef CAS PubMed.
- B. Liu, H. Wang, D. Yang, R. Tan, R. R. Zhao, R. Xu, Z. J. Zhou, J. F. Zhang and Y. Zhou, Dyes Pigm., 2016, 133, 127–131 CrossRef CAS.
- J. Liu, K. Wu, X. Li, Y. F. Han and M. Xia, RSC Adv., 2013, 3, 8924–8928 RSC.
- B. B. Shi, Y. M. Zhang, T. B. Wei, Q. Lin, H. Yao, P. Zhang and X. M. You, Sens. Actuators, B, 2014, 190, 555–561 CrossRef CAS.
- Q. T. Meng, Y. Wang, M. Yang, R. Zhang, R. J. Wang and Z. Q. Zhang, RSC Adv., 2015, 5, 53189–53197 RSC.
- K. S. Asha, R. Bhattacharjee and S. Mandal, Angew. Chem., Int. Ed., 2016, 55, 11528–11532 CrossRef CAS PubMed.
- D. Talarico, S. Cinti, F. Arduini, A. Amine, D. Moscone and G. Palleschi, Environ. Sci. Technol., 2015, 49, 7934–7939 CrossRef CAS PubMed.
- X. Zhu, J. Gu, Y. Wang, B. Li, Y. Li, W. Zhao and J. Shi, Chem. Commun., 2014, 50, 8779–8782 RSC.
- W. Liu, Z. Du, Y. Qian and F. Li, Sens. Actuators, B, 2013, 176, 927–931 CrossRef CAS.
- X. Tan, Q. Fan, X. Wang and B. Grambow, Environ. Sci. Technol., 2009, 43, 3115–3121 CrossRef CAS PubMed.
Footnote |
| † Electronic supplementary information (ESI) available: XPS spectra of Eu-ICP nanospheres; 1H NMR spectra of H2BDC and Eu-ICP nanospheres; SEM images of the as-synthesized Eu-ICP products with different volume ratio of ethanol to DMF; SEM image and XRD pattern of Eu-ICP nanospheres prepared in the absence of PVP; SEM image of Eu-ICP nanospheres after dispersed in aqueous solution for 24 h; Effect of pH and ionic strength on the fluorescence intensity (615 nm) of Eu-ICP nanospheres; the dependent relationship between fluorescence intensity versus concentration of Eu-ICP suspension. See DOI: 10.1039/c6ra27819a |
| This journal is © The Royal Society of Chemistry 2017 |