 Open Access Article
Creative Commons Attribution 3.0 Unported Licence
In situ determination of mechanical properties for poly(ether ether ketone) film under extreme conditions
Jiayu Wanga,
Qiang Zhoua,
Danming Chao b,
Fangfei Li*a and
Tian Cui
 a
a
aState Key Lab of Superhard Materials, College of Physics, Jilin University, Changchun 130012, P. R. China. E-mail: lifangfei@jlu.edu.cn
bAlan G. MacDiarmid Institute, College of Chemistry, Jilin University, Changchun, 130012, P. R. China
First published on 27th January 2017
Abstract
The mechanical properties of special engineering plastic have been intensively studied in recent years. However, there are few studies on the mechanical variation under extreme conditions. In this study, we chose poly(ether ether ketone) (PEEK) to study its mechanical behavior under high temperature and high pressure using Brillouin scattering coupled with an electrical resistance heating technique and diamond anvil cell device. The isothermal compressibility and pressure dependence of the mechanical moduli of PEEK film were examined and determined. A typical negative thermal expansion phenomenon was observed under high temperature and high pressure, which has been explained and discussed by virtue of free volume theory. Comprehensive investigation of elastic properties as a function of pressure not only provides an effective way to understand the mechanical behavior of PEEK under high temperature and high pressure, but also supplies an available theoretical direction for their practical application under extreme conditions.
Introduction
The versatility of polymers has allowed them to be used extensively under extreme conditions, as various components in explosives, aerospace, submarine and heavy machinery, where the polymers witness high strain rates, high pressure, and even high temperature.1–11 Therefore, the deep knowledge of their mechanical properties under extreme conditions is essential for design and development of polymer components. Up to now, several approaches have been explored to achieve this goal. Takamatsu and coworkers obtained polyimide Hugoniot data up to 0.6 TPa with good accuracy. The laser-driven equation-of-state (EOS) experiments were performed with emission measurements from the rear sides of a shocked target at a high laser intensity with 2.5 ns duration.1 The dynamical behavior of polyimide was also investigated in detail using a flyer driven by chemical explosion. The plots of pressure vs. volume behind shock waves were measured in the pressure range of 0–56 GPa.2 Moreover, various theoretical models have also been applied for the evaluation of extensive EOS data of pure polymers, polymer–solvent and polymer blends.12–17Recently, some polymer samples, such as polyolefins, polysiloxanes, and polyimide, have been investigated by high pressure Brillouin scattering spectroscopy technique,3–11 which is a nondestructive method to provide insight into the elastic and bulk mechanical properties of optically transparent materials by measuring their acoustic velocities. The diamond anvil cell (DAC) supplies the high pressure condition. The elastic properties and mechanical moduli of these polymers under high pressure were determined accurately, which provided an effective theoretical direction for their utility under extreme condition. Contrast to the previous approaches, high pressure Brillouin scattering spectroscopy method was considered as the optimal approach, due to its accuracy, effectiveness and safety.
Poly(ether ether ketone) (PEEK), as one of the most used special engineering plastic, has attracted special attention due to its high stability, excellent mechanical strength, good radiation-resistant.18–20 These characteristics make PEEK an excellent candidate material for specific applications under extreme conditions. To the best of our current knowledge, there is no research on the determination of mechanical properties of PEEK under high pressure, much less the simultaneous high temperature. Herein, the isothermal compressibility and pressure dependence of mechanical moduli were determined for the aromatic PEEK through high temperature high pressure Brillouin scattering upto 520 K and 13.9 GPa.
Experimental
PEEK APTIV 2000 series film with thickness of 50 μm (VICTREX, Tg: 143 °C, ρ: 1.26 g cm−3, the structure of PEEK was shown in the Fig. 1) is used as the research object enclosed in a symmetric DAC with a large conical opening aperture. The culet size of diamond anvils is 400 μm in diameter. Silicon oil was utilized as the pressure transmission medium in DAC to minimize the pressure gradient.21–23 A small annealed ruby chip was loaded into the chamber for the pressure calibration. Brillouin scattering experiments were performed in symmetric platelet scattering geometry. The DAC places to bisect this scattering angle such that the difference vector, i.e., the acoustic phonon wave vector, is in the plane of the sample. A single-frequency 532 nm laser was used as Brillouin excitation source. The Brillouin spectra were collected by 3 + 3 pass tandem Fabry Perot interferometer designed by Sandercock.24,25 Ruby fluorescence was recorded through Raman spectroscopy system using Acton SpectraPro 500i spectrometer with a liquid nitrogen-cooled CCD detector (Princeton Instruments). An electrical resistance heater was set around the gasket clipped between diamond anvils, a thermal couple was fixed on one side of diamond about 500 μm away from the sample chamber for temperature calibration. The temperature was controlled by a feedback power holding a fluctuation within 1 K.Results and discussion
In this study, Brillouin scattering technology was applied on the PEEK films in symmetric platelet geometry. The Brillouin shift (Δν) was converted to sound velocity (v) using the relative equation:
 | (1) |
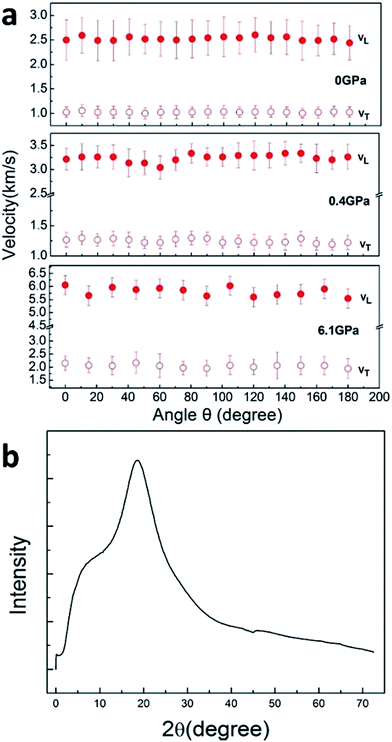
Brillouin spectra of PEEK film under high pressures at 300 K were shown in Fig. 2. Both longitudinal (VL) and transverse (VT) sound velocities were clearly observed at high pressures, but their intensity decreased remarkably with increasing pressure. Finally, the shear modes disappear at 13.9 GPa. In addition, a pair of back scattering signals (V180°) can be detected below 0.4 GPa. However, they would gradually outflow the spectral range of 20 GHz with increasing of the applied pressure. To confirm the isotropy of the PEEK film, the direction dependence of acoustic velocities for PEEK film has been checked under 0, 0.4 and 6.1 GPa at 300 K, then the resulting velocity variations are presented in Fig. 3a. Obviously, the enclosed PEEK film exhibits highly isotropic at various conditions. Although some little fluctuations with angle rotation were observed at elevated pressure, they all fall within the range of the maximum error of the peak position. Furthermore, X-ray diffraction (XRD) measurement on PEEK film was also performed under ambient pressure at 300 K. A typical broad peak was obtained and presented in Fig. 3b, which is the characteristic of amorphous material. Therefore, in our measurement of Brillouin spectra for PEEK film, the velocity is collected at only one direction at elevated temperatures and pressures.
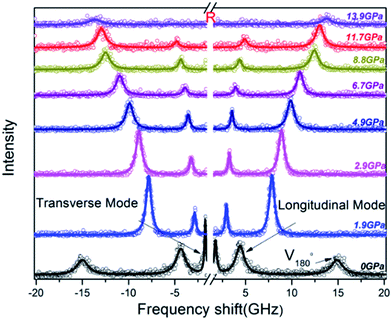 | ||
| Fig. 2 Selected Brillouin spectra of PEEK film in platelet scattering geometry at 300 K. The center R is due to inelastic Rayleigh scattering. V180° is the backscattering signal. | ||
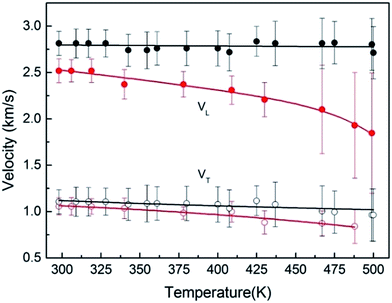
Next, we measured the temperature dependence of velocity of PEEK film under ambient pressure, as shown in Fig. 4. The soften of sound velocity for the PEEK film is observed, the longitudinal velocity decreases about 30% from 300 K to 500 K, meanwhile the transverse velocity decreases 15%. While a little pressure less than 0.1 GPa is applied on the sample, the velocity soften phenomenon derived from high temperature is suppressed (Fig. 4), which indicated that the soften phenomenon would be ignored after the application of pressure. Due to the increase of full width at half maximum with temperature changing, we draw out the scope of the maximum error of the peak position to describe its trend of changes with temperature.
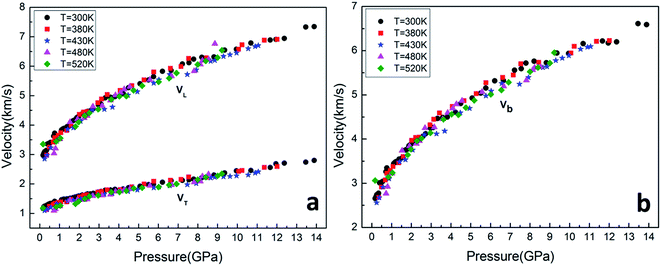
The pressure dependence of velocity along several isothermals, including 300, 380, 430, 480 and 520 K, are presented in Fig. 5. We observed that acoustic velocities of sample increase smoothly with increasing pressure at a constant temperature. However, they decrease slightly with increasing temperature at a constant pressure. Furthermore, the shear velocity is lost near 13.9 GPa at 300 K, while they are lost at relative lower pressure at high temperatures, such as losing around 9.5 GPa at 520 K.
Based on the measured velocities, the bulk sound velocity Vb was calculated according to following equation:
 | (2) |
As shown in the Fig. 5, the resultant bulk velocity increases remarkably with the elevated pressure. But slight decreases of the bulk velocity was observed with increasing temperature. Then the densities were derived from the bulk sound velocity through numerical integration of eqn (3)
 | (3) |
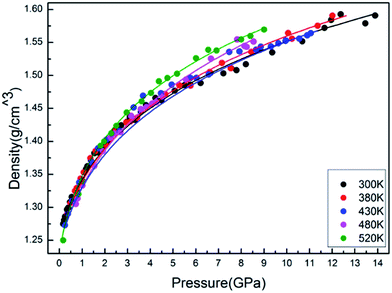
The isothermal variation of density with pressure is presented in Fig. 6. As expected, the isothermal density of PEEK film increases obviously with the elevated pressures. However, the slope of isothermal density also increases with the elevated temperature, which indicated that the enclosed PEEK film exhibits a higher density at a higher temperature under the constant high pressure.
Usually, there are different physical models to give universal relations between the pressure, volume, temperature and other parameters. Here, we tried fitting four different types of equation-of-state (EOS) forms, including third order Birch–Murnaghan, Vinet, Tait and an empirical EOS form developed by Sun et al., these forms are given as follows:
 | (4) |
 | (5) |
 | (6) |
 | (7) |
The results of the EOS fittings are listed in Table 1. All the EOS fittings give similar curves going through the experimental data except that of Sun EOS, which displays a little bit shallower fit to the isotherms in five isotherms. It is found that the Tait EOS fitting gives best results and is illustrated in the pressure–density plot in Fig. 6. After analyzing of the isotherm determined from Brillouin scattering, we found that the K0 and K′0 decrease with the increasing of temperature. The Sun EOS fitting shows a much higher K0, while the third order Birch–Murnaghan EOS fitting shows a lower K0 and a much higher K′0.
| T | 300 K | 380 K | 430 K | 480 K | 520 K | |||||
|---|---|---|---|---|---|---|---|---|---|---|
| K0 | K′0 | K0 | K′0 | K0 | K′0 | K0 | K′0 | K0 | K′0 | |
| Tait | 10.12 | — | 9.09 | — | 8.69 | — | 8.1 | — | 5.59 | — |
| BM | 6.83 | 36.40 | 6.81 | 30.76 | 6.73 | 30.10 | 5.54 | 29.18 | 5.09 | 27.49 |
| Vinet | 9.14 | 16.47 | 8.27 | 15.87 | 8.13 | 15.76 | 7.70 | 14.12 | 7.00 | 13.68 |
| Sun | 16.91 | — | 14.64 | — | 14.49 | — | 11.49 | — | 10.09 | — |
From the EOS of PEEK film, we found that the PEEK film exhibits a higher density at higher temperature under a constant pressure, which is a typical negative thermal expansion phenomenon. This abnormal phenomenon would be explained by virtue of free volume theory. Usually, the PEEK film possesses plenty of free volume because of its conventional forming conditions (t ∼ Tg; around ambient pressure). Under normal conditions, high temperature will supply more energy to the polymer chains for movement and achievement of more physical conformations, resulting a decreasing density. However, under the ultrahigh pressures, moveable polymer chains, soften by the high temperature, tend to gather and consume partial free volume. As a result, higher temperature brings about higher density of PEEK films under high pressures. This process seemed like the annealing technology in the polymer engineering, usually resulting in the drastic crystallization change. The study of crystallization change for PEEK film under extreme condition is currently undergoing in our lab, and will be presented in the future report.
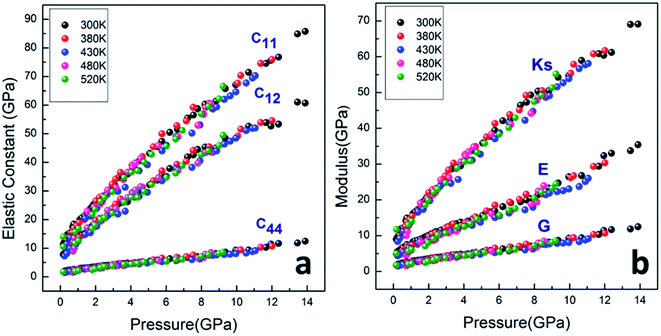
With the densities calculated above, an analysis of elastic properties and individual elastic constants as a function of applied pressure were accomplished. The elasticity of isotropic materials is fully described by the elastic constants. The elastic moduli for all pressure and temperature, including C11, C12 and C44, were calculated by the following equations.
| ρVL2 = C11 | (8) |
 | (9) |
As shown in Fig. 7a, the isothermal elastic constant increases dramatically under applied pressure. However, the elastic constants reveal little change with temperature variation under the same pressure. Contrast with C44, C11 and C12 of elastic constants are more sensitive to the pressure. Furthermore, these elastic constants allow us to calculate adiabatic bulk modulus (Ks), shear modulus (G), and Young's modulus (E), and Poisson's ratios (σ) as a function of pressure according to the following equations:
 | (10) |
 | (11) |
 | (12) |
 | (13) |
All the calculated modulus at high pressure high temperature are presented in Fig. 7b. The moduli were found to dramatically increase for PEEK film under applied pressure but little change with the elevated temperatures. The bulk modulus revealed more sensitive to the pressure than the shear and Young's modulus. The enclosed PEEK film showed good bulk modulus about 35 GPa at the pressure of 5 GPa and 55 GPa at pressure of 10 GPa, which indicated that the PEEK film possessed good compressibility. Furthermore, the slope of Ks is approximately twice of the slope of E and approximately sixfold of the slope of G. However, the other enclosed polymers (such as poly(chlorotrifluoroethylene-co-vinylidene fluoride),7 polyimde,11 cross-linked poly(dimethylsiloxane),27 cross-linked terpolymer poly(ethylene-vinyl acetate-vinyl alcohol),27 and segmented thermoplastic poly(ester urethane) copolymer27) revealed relatively high Young's moduli. Moreover, the pressure dependence of elastic constants and moduli are fitted by a linear function at 300 K, Y = Y0 + a × P, giving Y0 = 11.726, 5.536, 1.941; a = 4.388, 2.083, 0.731 for Ks, E and G, and giving Y0 = 14.314, 10.417, 1.941; a = 5.363, 3.896, 0.731 for C11, C12 and C44, respectively.
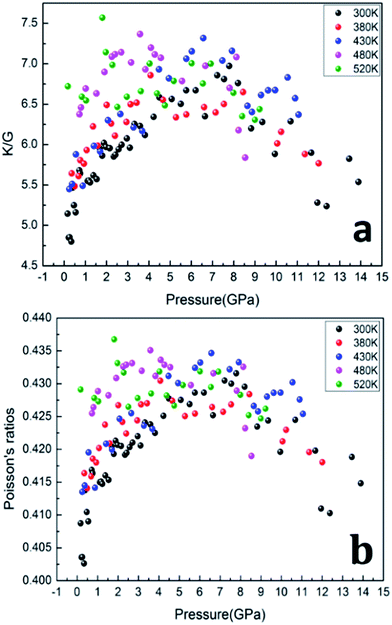
The ratios of bulk modulus to shear modulus (K/G) as function of pressure are calculated and shown in Fig. 8, which was used to estimate the brittle and ductile behavior of materials.29 Usually, a high K/G ratio means good ductility of the material, whereas a low value corresponds to the brittle essence. The critical value is considered about 1.75.30–32 As shown in Fig. 8a, the value of K/G at five isotherms is much higher than 1.75, which means that the PEEK film is of ductile essence. Furthermore, the value of K/G increases remarkably with applied pressure increasing from 0 to 8 GPa, which indicates that pressure would improve the ductility of PEEK film. However, the values of K/G begin to decrease when the applied pressure exceeds 8 GPa, which indicates that excess pressure would damage the ductility of PEEK film.
Poisson's ratios is the ratio of the relative contraction strain (or transverse strain) normal to the applied load, which is an important parameter for the mechanical characteristics of materials. As shown in the Fig. 8b, the Poisson's ratios of the PEEK film under high temperature high pressure are disclosed from 0.25 to 0.5, which is the characteristic for the polymer materials.33–35 The larger Poisson ratio between 0.404 and 0.436 signifies the better ductile of the PEEK film. When the values of K/G are much higher than 1, as well as Poisson's ratios approach 0.5, the materials are considered extremely incompressible. The Poisson's ratios for the PEEK film appear to increase with the increase of pressure and reach to the maximum 0.43 at about 8 GPa. After that, the Poisson's ratios decrease obviously from 8 GPa to 13.9 GPa. Almost all of PEEK films on various isotherms reveal similar regularity. Moreover, the Poisson's ratios increase dramatically with the enhancing temperatures.
Conclusions
In conclusion, we have studied acoustic and elastic properties variation of PEEK film under high temperature high pressure by virtue of Brillouin scattering spectrum coupled with electrical resistance heating technique and diamond anvil cell device. The sound velocities, the elastic constants, bulk, shear, and Young's moduli, Poisson's ratios, density and their respective pressure dependencies were all disclosed and studied in detail. Free volume theory was also utilized to explain a negative thermal expansion phenomenon of PEEK film under high temperature high pressure. Our demonstrated system is expected to enrich the mechanical measurements of special engineering plastics and facilitates their practical applications under extreme conditions.Acknowledgements
This work was supported by the National Natural Science Foundation of China (No. 11474127, 11574112), National Basic Research Program of China (No. 2011CB808200), Program for Changjiang Scholars and Innovative Research Team in University (No. IRT1132), National Found for Fostering Talents of basic Science (No. J1103202). We also acknowledge the support of Graduate Innovation Fund of Jilin University (2016147), and the Open Project of State Key Laboratory of Superhard Materials (Jilin University), China (Grant No. 201403).References
- K. Takamatsu, N. Ozaki, K. A. Tanaka, T. Onom, K. Nagai, M. Nakai, T. Watari, A. Sunahara, M. Nakano, T. Kataoka, H. Takenaka, M. Yoshida, K. Kondo and T. Yamanaka, Phys. Rev. E, 2003, 67, 056406–056410 CrossRef CAS PubMed.
- S. P. Marsh, LASL Shock Hugoniot Data, University of California Press, Berkeley, 1980 Search PubMed.
- S. Koda, T. Shibata, I. S. Park and S. Kojima, Curr. Appl. Phys., 2015, 15, 805–810 CrossRef.
- L. Hong, B. Begen, A. Kisliuk, C. Alba-Simionesco, V. N. Novikov and A. P. Sokolov, Phys. Rev. B: Condens. Matter Mater. Phys., 2008, 78, 134201–134211 CrossRef.
- S. Shin, J. H. Ko, J. Park, Y. H. Ko and K. J. Kim, Phys. B, 2015, 50, 466–467 Search PubMed.
- A. S. Benjamin, M. Ahart, S. A. Gramsch, L. L. Stevens, E. B. Orler, D. M. Dattelbaum and R. J. Hemley, J. Chem. Phys., 2012, 137, 014514–014520 CrossRef PubMed.
- L. L. Stevens, D. M. Dattelbaum, M. Ahart and R. Hemeley, J. Appl. Phys., 2012, 112, 023523–023526 CrossRef.
- H. Kriegs, G. Meier, J. Gapinski and A. Patkowski, J. Chem. Phys., 2008, 128, 014507–014515 CrossRef CAS PubMed.
- Z. A. Dreger, J. Zhou, N. C. Dang and Y. M. Gupta, J. Appl. Phys., 2011, 109, 083507–083576 CrossRef.
- A. S. Benjamin, M. Ahart, S. A. Gramsch, L. L. Stevens, E. B. Orler, D. M. Dattelbaum and R. J. Hemley, J. Chem. Phys., 2012, 137, 014514–014517 CrossRef PubMed.
- J. Wang, X. Zhao, E. B. Berda, C. Chen, K. Wang, S. Chen, B. Zou, B. Liu, Q. Zhou, F. Li and D. Chao, Polymer, 2016, 90, 1–8 CrossRef CAS.
- P. A. Rodgers, J. Appl. Polym. Sci., 1993, 48, 1061–1080 CrossRef CAS.
- G. R. Brannock and I. C. Sanchez, Macromolecules, 1993, 26, 4970–4972 CrossRef CAS.
- F. Yousefi, H. Karimi and M. Gomar, Fluid Phase Equilib., 2013, 355, 92–98 CrossRef CAS.
- R. B. Gupta and J. M. Prausnitz, Fluid Phase Equilib., 1996, 117, 77–83 CrossRef CAS.
- C. P. Bokis, M. D. Donohue and C. K. Hall, Ind. Eng. Chem. Res., 1994, 33, 1290–1298 CrossRef CAS.
- G. Bogdanic and A. Fredenslund, Ind. Eng. Chem. Res., 1994, 33, 1331–1340 CrossRef CAS.
- A. E. Wiącek, K. Terpiłowski, M. Jurak and M. Worzakowska, Eur. Polym. J., 2016, 78, 1–13 CrossRef.
- S. M. Kurtz and J. N. P. Devine, Biomaterials, 2007, 28, 4845–4869 CrossRef CAS PubMed.
- E. T. J. Rochford, A. H. C. Poulsson, J. Salavarrieta Varela, P. Lezuo, R. G. Richards and T. F. Moriarty, Colloids Surf., B, 2014, 113, 213–222 CrossRef CAS PubMed.
- D. D. Ragan, D. R. Clarke and D. Schiferl, Rev. Sci. Instrum., 1996, 67, 494–496 CrossRef CAS.
- Y. R. Shen, R. S. Kumar, M. Pravica and M. F. Nicol, Rev. Sci. Instrum., 2004, 75, 4450–4454 CrossRef CAS.
- X. Wang, C. Chen, X. Huang, J. Wang, M. Yao, K. Wang, F. Huang, B. Han, Q. Zhou and F. Li, RSC Adv., 2015, 5, 38056–38060 RSC.
- F. Li, Q. Cui, Z. He, T. Cui, J. Zhang, Q. Zhou and G. Zou, J. Chem. Phys., 2005, 123, 174511–174514 CrossRef PubMed.
- F. Li, M. Li, Q. Cui, T. Cui, Z. He, Q. Zhou and G. Zou, J. Chem. Phys., 2009, 131, 134502–134506 CrossRef PubMed.
- J. F. Nye, Physical Properties of Crystals: Their Representation by Tensors and Matrices, Clarendon, Oxford, 1957, ch. 6 and 10 Search PubMed.
- L. L. Stevens, E. B. Orler, D. M. Dattelbaum, M. Ahart and R. J. Hemley, J. Chem. Phys., 2007, 127, 104906–104918 CrossRef PubMed.
- E. M. Brody, H. Shimizu, H. K. Mao, P. M. Bell and W. A. Bassett, J. Appl. Phys., 1981, 52, 3583–3585 CrossRef CAS.
- S. F. Pugh, Philos. Mag., 1954, 45, 823–843 CrossRef CAS.
- Y. Cao, J. Zhu, Z. Nong, X. Yang, Y. Liu and Z. Lai, Comput. Mater. Sci., 2013, 412, 208–213 CrossRef.
- L. Qi, Y. Jin, Y. H. Zhao, X. Yang, H. Zhao and P. Han, J. Alloys Compd., 2015, 621, 383–388 CrossRef CAS.
- M. Pang, Y. Zhan, H. Wang, W. Jiang and Y. Du, J. Appl. Phys., 2011, 110, 033533–033539 CrossRef.
- D. Chen, Z. Chen, M. L. Wang, N. H. Ma and H. W. Wang, Intermetallics, 2014, 52, 64–71 CrossRef CAS.
- G. N. Greaves, A. L. Greer, R. S. Lakes and T. Rouxel, Nat. Mater., 2011, 10, 823–837 CrossRef CAS PubMed.
- P. J. Rae and D. M. Dattelbaum, Polymer, 2004, 45, 7615–7625 CrossRef CAS.
| This journal is © The Royal Society of Chemistry 2017 |


