DOI:
10.1039/C6RA27804C
(Paper)
RSC Adv., 2017,
7, 4501-4509
A comparative investigation of different chemical treatments on SiO anode materials for lithium-ion batteries: towards long-term stability†
Received
6th December 2016
, Accepted 1st January 2017
First published on 17th January 2017
Abstract
In this work, we conduct a comparative study of boron-doped SiO (HB-SiO) and carbon-coated SiO (HC-SiO) to find an effective means of improving the electrochemical performances of SiO anode materials during long-cycle tests. Carbon-coating processes are widely introduced to provide electrical pathways for charge transfer, resulting in a decrease of the internal resistance. However, capacity fading is inevitably caused by the electrical loss between the SiO anode materials and the carbon-coating upon cycling. On the other hand, even when the HB-SiO electrodes are pulverized, the remaining materials are electrochemically active owing to the presence of Li ion pathways inside the active materials created by dopant diffusion. Electrochemical impedance spectroscopy and microstructural analysis confirm that the excellent electrochemical performance of the HB-SiO electrode originates from the Li kinetic enhancement in the SiO electrodes, enhancing the reversibility of the redox reaction compared to a HC-SiO electrode during the lithiation/delithiation process. Therefore, we conclude that impurity doping of alloy-type anode materials would be a better way to ensure that the electrochemical activity remains superior to carbon-coating in terms of long-term stability.
I. Introduction
Over the last few decades, rechargeable lithium ion batteries (LIBs) have been widely used in portable devices owing to their convenient features.1–3 Very recently, there has been an explosive demand for high performance LIBs which have high energy and high power density, especially in the field of electronic transportation. However, the growth of this market is limited by the development of battery technology, which does not meet certain aspects of the demand, such as the energy density and life cycle requirements.4 An investigation of superior anode materials is of key importance to address these issues.5–7 Generally, anode materials are classified into insertion/de-insertion, alloy/de-alloy and redox conversion types, depending on their electrochemical reaction with Li ions.1,5
Si-based materials, an alloy/de-alloy type, are regarded as one of the most attractive candidates to replace carbonaceous anode materials in LIBs owing to their high theoretical specific capacity and low initial irreversible capacity compared to conversion-type electrode materials.8–14 The main obstacle of Li–Si alloys is the massive volume change that results in electrode pulverization, the loss of the electrical contacts, and drastic capacity fading during the alloying/de-alloying reactions.9–14 On the other hand, when the SiO negative electrode undergoes lithiation, Li oxide (Li2O) and Li silicates (Li4SiO4) are mainly formed, which alleviates the volume change caused by the Li–Si alloys over long cycles.15–20 However, SiO anode materials, due to their low electrical conductivity and irreversible reaction, are known for their poor electrochemical activity, which results in tardy lithiation.
Many approaches have been reported to enhance the electrochemical performances of SiO-based anode materials, most of which include commercially available SiO powders either directly forming a composite with other materials21–24 or surface carbon-coating using carbon sources.12,25–27 Among them, surface carbon-coating has been regarded as one of the most effective and common ways to improve the electrochemical properties of SiO. Dispersed carbon particles provide pathways for electron transfer and decrease the resistance of the electrode, resulting in improved conductivity and better electrochemical properties of the SiO negative electrode.12,25–27 However, it has been reported that drastic capacity fading has been observed in carbon-coated SiO active materials by losing electrical path.25,26 It is difficult to retain a stable surface coating because the volume change breaks the outer carbon layer upon repeated cycles.
In this report, we propose a comparative investigation of the electrochemical performances of SiO anode materials via carbon-coating and B-doping processes. The electrical and electrochemical performances were greatly improved in both the carbon-coated and B-doped SiO active materials compared to pristine SiO powder at the initial stage. However, we found that the carbon-coating affects only the local surface area and not the bulk properties that lead to capacity fading via microstructural changes after long cycle. Therefore, the novelty of this work is to elucidate the challenges of long-cycle stability and capacity fading on SiO anode materials in a comparison of B-doping and carbon-coating. As a consequence, we suggest that the direct doping on alloy-type materials could be a better way to maintain the electrochemical activity superior to surface carbon-coating over a long cycle life.
II. Experimental
1. HB-SiO & HC-SiO material synthesis
SiO powders (Aldrich, 325 mesh) were used as starting materials without further purification. Boron-doped SiO (HB-SiO) powders were synthesized by a heat treatment at a temperature of 900 °C for 3 h in a nitrogen (N2) gas ambient via a spin-on dopant (SOD) process. The details of the fabrication process of HB-SiO using a SOD solution are definitely described in the ESI (Fig. S1†). Carbon-coated SiO (HC-SiO) sample was prepared as follows. First, pristine SiO powders were pre-treated in a quartz tube at a temperature of 900 °C for 3 h in a nitrogen (N2) gas ambient (H-SiO). Subsequently, 1 g of heat-treated SiO was dispersed in 50 ml deionized (DI) water by ultrasonication and an amount of 10 g of α-D-glucose (C6H12O6, 96%, Aldrich) was then added to the solution as a carbon source. The mixed solution was transferred to a 100 ml Teflon-lined stainless steel autoclave, which was subsequently heated to 180 °C for 3 h. The carbon-coated SiO sample was then washed with ethanol and DI water. This sample was dried at 80 °C in a vacuum oven for 12 h and annealed at 500 °C for 2 h under an argon (Ar) atmosphere in a quartz tube, resulting in the HC-SiO materials.
2. Preparation of the electrodes and cell assembly
The electrodes were prepared by a slurry coating that consisted of the active materials (68 wt%), acetylene black (Super P, 20 wt%) as a conducting agent, carboxymethyl cellulose (CMC, 9 wt%) and styrene butadiene rubber (SBR, 3 wt%) dissolved in DI water as a binder. The slurry was spread onto a current collector consisting of a copper (Cu) foil with a thickness of 20 μm and dried in a vacuum oven at 70 °C for 12 h. The mass loadings on dried HB-SiO and HC-SiO electrodes were 1.16 mg cm−2 and 1.13 mg cm−2, respectively. CR2032-type coin cells were used to test the electrochemical performance of the samples. 1 M of LiPF6 in an ethylene carbonate (EC)/diethyl carbonate (DEC) solution with a volume ratio of 1![[thin space (1/6-em)]](https://www.rsc.org/images/entities/char_2009.gif) :1 and 10% fluoro-ethylene carbonate (FEC) as an additive was used as an electrolyte (Panaxetec. Inc). A Celgard 2400 microporous membrane was used as a separator in the coin cell. Li metal was used as a counter electrode. The cells were assembled in an Ar-filled glove box with concentrations of moisture and oxygen each below 1 ppm.
:1 and 10% fluoro-ethylene carbonate (FEC) as an additive was used as an electrolyte (Panaxetec. Inc). A Celgard 2400 microporous membrane was used as a separator in the coin cell. Li metal was used as a counter electrode. The cells were assembled in an Ar-filled glove box with concentrations of moisture and oxygen each below 1 ppm.
3. Characterization
The morphological properties of all samples were characterized using field emission scanning electron microscopy (FE-SEM, Hitachi-S4800). X-ray diffraction (XRD, PANalytical Empyrean) was used to observe the crystallographic structures. In addition, microstructural and elemental analyses were conducted using a field emission transmission electron microscope (FE-TEM, HF-3300) combined with an energy dispersive X-ray (EDX) spectrometer. The optical properties of all samples were obtained using a Raman spectrometer with 532 nm excitation lasers (Thermo Nicolet ALMECA). The electrical resistivity was measured with a powder resistance meter (Dasol Engineering, ADCMT8340). Cycling tests were performed in galvanostatic mode between 0.01 and 1.5 V versus Li/Li+ with a battery tester (WonATech, WMPG1000). All specific capacities of the samples were calculated on the basis of the weight of the active materials. A first discharge capacity of about 2400 mA h g−1 at the rate of 1C was utilized to examine the electrochemical reaction of the SiO mixture model. The electrochemical impedance spectra (EIS) were measured from 100 kHz to 0.01 Hz with an alternating current amplitude of 10 mV using a VersaSTAT3 potentiostat (Princeton Applied Research).
III. Results and discussion
Fig. 1 provides illustrations of the preparation procedures for the HB-SiO and HC-SiO samples. HB-SiO powders were synthesized by a facile one-step heat treatment with B-dopants. On the other hand, the fabrication process of the HC-SiO powders consisted of a thermal treatment and a carbonization step. It is well known that the electrochemical performance of disproportionated SiO depends on the amounts and valence states of the nanocrystalline-Si (nc-Si) and SiOx matrix.18,19,22 Therefore, in the case of HC-SiO, we initially prepared disproportionated SiO powders (H-SiO) under conditions identical to those used with HB-SiO, apart from SOD source. Subsequently, a carbon-coating process was introduced to increase the electrical conductivity of the disproportionated SiO powders.
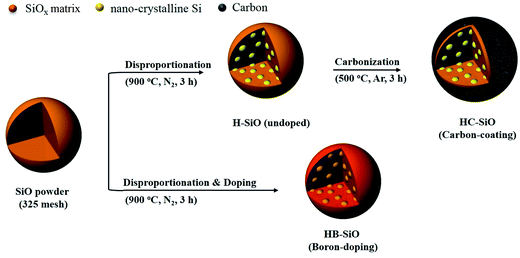 |
| | Fig. 1 Schematics of the fabrication processes for HB-SiO and HC-SiO samples. | |
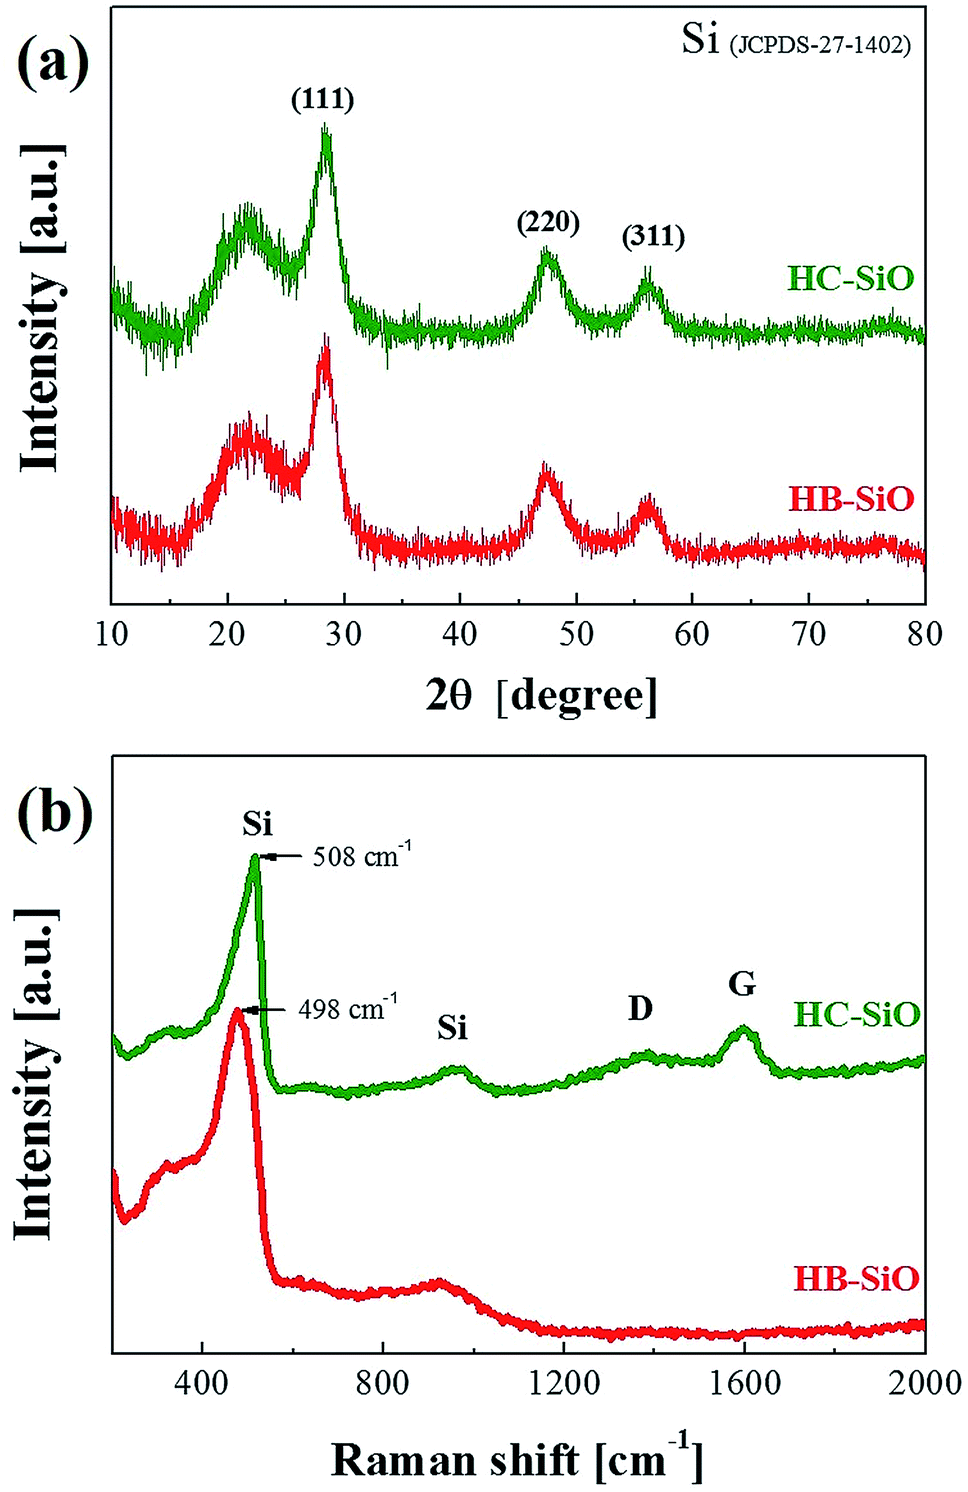
The crystal structures of the HB and HC-SiO powders were analyzed by observing the XRD patterns, as shown in Fig. 2(a). Many peaks appeared in the XRD patterns after the preparation of both samples. The peaks at 2θ = 28.3°, 48.6°, and 56° were defined as the (111), (220), and (311) planes of Si, respectively. These broad peaks indicate that a portion of the nc-Si was formed in the SiOx matrix due to thermal disproportionation. However, direct evidence of B-doping and the carbon-coating on SiO was not clearly found in the XRD measurements. For a further structural investigation of the B-doping and carbon-coating on the SiO powders, we used Raman spectroscopy on both samples, as shown in Fig. 2(b), as Raman spectroscopy provides information about the vibrations of atoms in crystals and can be used as a tool complementary to XRD. Two observable changes were found. First, a Raman shift of the Si peak from 508 cm−1 for the un-doped SiO sample to 498 cm−1 for the B-doped SiO was clearly observed. This shift is attributed to distortion in the Si network due to the stress acting in the surrounding Si atomic structure after B doping.28,29 Other distinguishable Raman shifts, resulting from the D and G-bands at about 1340 cm−1 and 1596 cm−1, respectively, were found only in HC-SiO. The G-band is associated with the allowed E2g optical modes of the crystalline graphite, while the D-band is attributed to disorder-allowed phonon modes, reflecting a lack of long-range order in amorphous graphite.30 The representative D and G peaks are observed only in the HC-SiO, which clearly indicates that carbon layers exist and that HC-SiO consisted of SiOx–C composites.
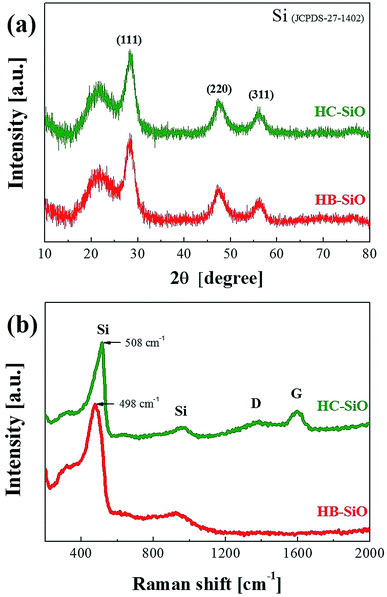 |
| | Fig. 2 (a) X-ray diffraction patterns and (b) Raman spectra of HB-SiO and HC-SiO powders. | |
The microstructure and elemental distributions of the HC-SiO powder were investigated further using scanning transmission electron microscopy (STEM). As shown in Fig. 3(a), the STEM image confirms that a carbon layer with a thickness of about 20 nm was uniformly coated onto the surface of the disproportionated SiO powders. The elemental mapping of carbon demonstrates that a homogeneous and amorphous carbon layer existed on the surface of the SiOx particles as demonstrated in a comparison of the STEM and EDX images in Fig. 3(b) and (c), respectively. In addition, as depicted in Fig. 3(d) and (e), the elemental signals of O and Si nearly overlap, indicating a mixed distribution of Si and O in the SiOx phase. We conclude that uniform contact between SiOx and the amorphous carbon layer was well established by the hydrothermal and subsequent carbonization process.31,32 Moreover, we observed that the HC-SiO composites have a carbon content of less than 1% by thermal gravimetric analysis (see ESI Fig. S2†).
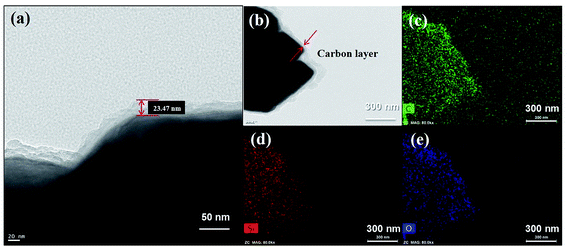 |
| | Fig. 3 (a) Magnified STEM image reveals the amorphous carbon layer. (b) STEM images of the HC-SiO powder. Corresponding EDX element mappings of (c) carbon, (d) silicon and (e) oxygen distribution. | |
To measure the electrical properties of each sample directly, the volume resistivity was measured by a powder resistivity measurement system using the four-point probe method under an applied pressure of 2000 kgf cm−2. When applying a voltage drop of 500 V between the center and the sample boundary, the resistivity of the sample was determined by measuring the output current. A pellet with a diameter of 25 mm was prepared by mechanical milling and subsequent pressurizing with 3 g of each powder. All samples were measured more than five times for accuracy, and the results obtained are described in Table 1. As expected, the electrical resistivity was greatly decreased by the B-doping and carbon-coating processes compared to the use of H-SiO powder. These results indicate that HB-SiO and HC-SiO clearly provide electrical conducting pathways. It should also be noted that the small variation of the bulk resistivity in the HB and HC-SiO samples reflects the uniform doping and coating on the SiO powders.
Table 1 Electrical resistivity for HB-SiO and HC-SiO samples. (H-SiO sample is given for reference)
| Samples |
Resistivity (unit: ohm cm) |
| H-SiO |
1.286 × 10¹⁵ ± 0.256 |
| HB-SiO |
3.177 × 10¹⁴ ± 0.079 |
| HC-SiO |
1.823 × 10¹⁴ ± 0.017 |
Fig. 4(a) and (b) show the galvanostatic charge–discharge curves of HB-SiO and HC-SiO electrodes at a rate of 0.5C with cutoff voltages of 0.01 and 1.5 V versus Li/Li+ from 100 cycle to 500 cycle with intervals at every 100 cycles, respectively. Both electrodes exhibit similar charging and discharging curves, showing that the discharge capacity mainly occurred below 0.3 V and that the charge capacity appeared from 0.3 V to 0.7 V, confirming the lithiation–delithiation characteristics of the nc-Si/SiOx electrodes.22,25,29 Compared to the HB-SiO electrode, the voltage profiles showed gradual capacity fading in the HC-SiO electrode, resulting in a large capacity reduction upon cycling. The rate capabilities of the HB-SiO and HC-SiO electrodes were also tested under various current density levels (0.1–2C) using fresh cells and cell after 500 cycles. As shown in Fig. 4(c), the specific capacity of HB-SiO is nearly identical to that of HC-SiO at all C rates with fresh cells. These results confirm that the electrochemical activity of both electrodes were maintained during low and high C rates in the initial stage. However, when the rate capability tests were conducted with the cells which were cycled 500 times, it should be noted that the large capacity difference was found between the HB-SiO and HC-SiO electrodes. We conclude that B-doping instead of the use of a carbon-coating in SiO negative electrodes strongly influences on the electrical and electrochemical behaviors in terms of specific capacity and rate capability during long cycle tests. Fig. 4(d) shows the continuous charge–discharge processes of each sample at a rate of 0.5C. During a period of 10 to 40 cycles, the HB-SiO and HC-SiO negative electrode demonstrated an increasing capacity. The capacity-climbing phenomenon is frequently found in SiOx anodes due to their sluggish lithiation and large particle sizes.21,24 It should be noted that no capacity fading was observed in both HB-SiO and HC-SiO sample before 100 cycles. For comparison with B-doping and carbon-coating, the H-SiO electrode was given for reference. However, as displayed in Fig. 4(e), the capacity difference between HB-SiO and HC-SiO was greatly increased with an increase in the number of cycles, and the capacity fading of HC-SiO was much faster than that of HB-SiO. After 500 cycles, HB-SiO and HC-SiO maintained reversible capacity of 592 and 361 mA h g−1, retaining more than 67% and 41% of their maximum capacity, respectively. The capacity of the HB-SiO electrode is 64% higher than that of the HC-SiO electrode after 500 cycles at a 0.5C rate. We suggest that this is mainly attributed to the inevitable surface deformation, which results in electrical disconnections between SiO particles and the carbon-coating layer in the HC-SiO electrode during long cycle tests. Meanwhile, the electrochemical performances of HB-SiO did not fade compared to those of the HC-SiO electrode. These results will be discussed later with the EIS results and the microstructural analysis results.
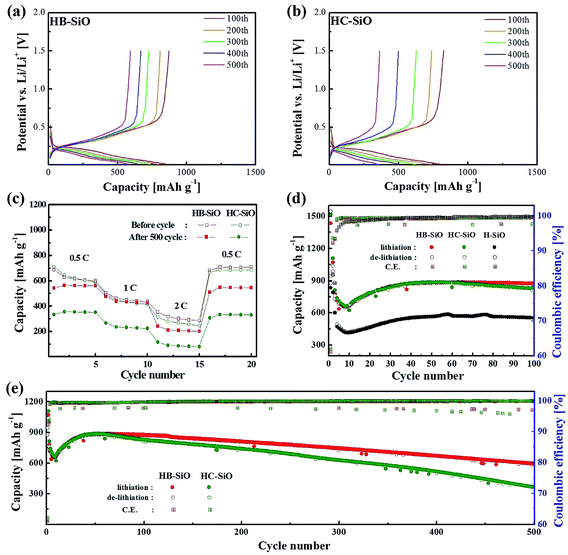 |
| | Fig. 4 Electrochemical performances of both electrodes: voltage profiles of (a) HB-SiO and (b) HC-SiO electrodes at 0.1C, (c) rate capability of fresh and 500 cycle tested cells at various rates from 0.5 to 2C, (d) cycling performance and coulombic efficiency during 100 cycles, (e) long-term cycling performance. | |
To clarify the origin of the improved electrochemical performances, all samples were analyzed using EIS measurements in a delithiation state from fresh cells to those cycled 500 times, with intervals at every 100 cycles. As shown in Fig. 5(a), the HB-SiO and HC-SiO electrodes show nearly identical EIS results for the fresh cells, indicating that the electrolyte resistance (Rs) and the charge transfer resistance (Rct) are identical for each sample. In contrast to the initial stages, the HB-SiO electrode shows a smaller semicircle compared to that of the HC-SiO, which suggests a much lower value of Rct after 500 cycles, as described in Fig. 5(b). These results imply that impurity dopants provide effective Li ion pathways to the inside of the SiO negative electrodes, which enhances the reversible electrochemical reaction during the long cycle life.20,28,33,34 In contrast, the Rct value of the HC-SiO electrode increased considerably after 200 cycles. This phenomenon is ascribed to electrode degradation caused by the electrical disconnections between SiO particles and the carbon-coating layer. By plotting the EIS results with further cycling, it is clearly shown in Fig. 5(c) that the electrochemical performance of the HC-SiO electrode gradually fade, attributing to the sluggish transportation of Li ions and electrons during the lithiation/delithiation process as compared to that in the HB-SiO electrode.
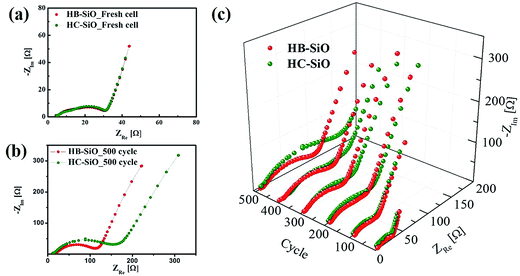 |
| | Fig. 5 Nyquist plots of both electrodes: (a) fresh cell, (b) after 500 cycles, and (c) at different cycles. | |
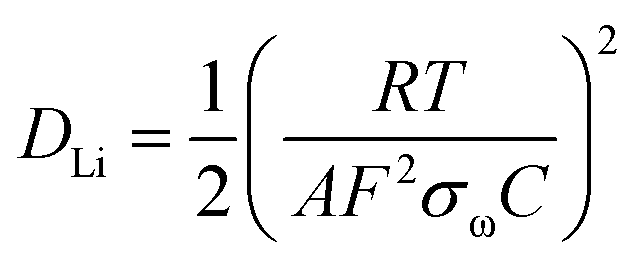
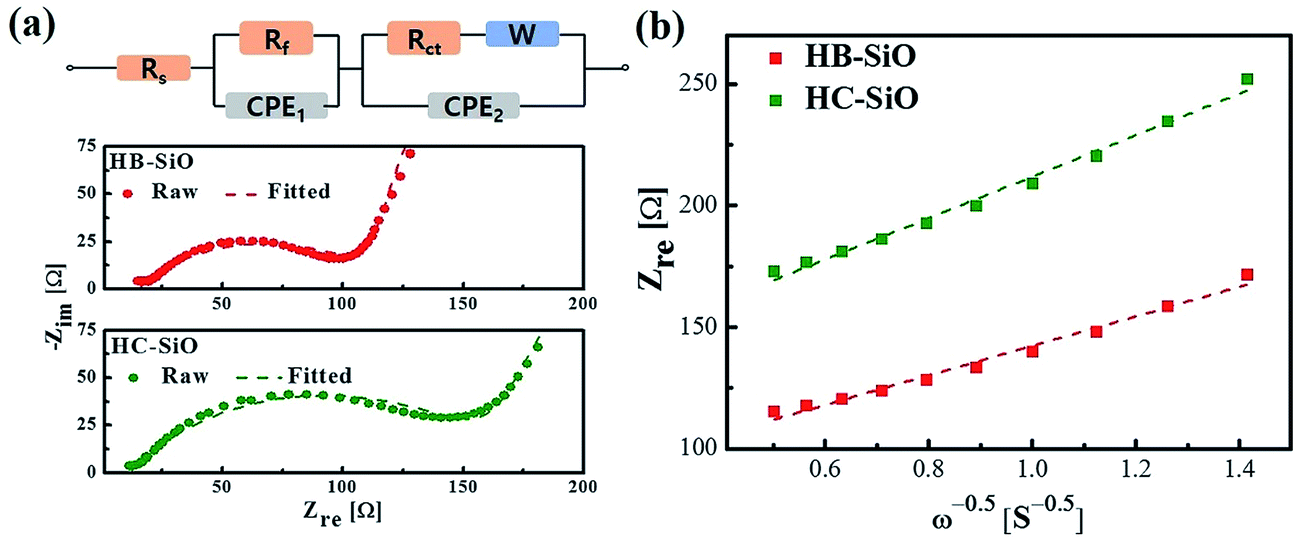
For further investigation, the experimental impedance data after 500 cycle samples were fitted to an equivalent circuit as plotted in Fig. 6(a). In this equivalent circuit, W is the Warburg impedance of solid-phase diffusion, and Rs and Rf represent the electrolyte resistance and the SEI formed on the electrode. Rct is the charge transfer resistance related to the Li ion interfacial transfer and CPE1 and CPE2 are the SEI and double layer capacitance, respectively. The fitting values from the equivalent circuit for each sample are reported in Table 2. According to Table 2, the Rs and Rf value of HB-SiO electrode is almost same as HC-SiO electrode, but the Rct value of HB-SiO electrode is significantly lower than that of HC-SiO after 500 cycles. To investigate the behavior of Li ion in electrode materials, the relationship between the real impedance (Zre) and the reciprocal square root of the lower angular frequencies (ω−1/2) after 500 cycles is plotted in Fig. 6(b). It is well known that the oblique lines in low frequency region correspond to the Li ion diffusion within the negative electrodes, i.e., Warburg diffusion.35,36 From the Fig. 6(b), Warburg impedance coefficient (σω) can be derived from the slope of straight line according to the eqn (1), and the diffusion coefficient values of the Li ions (DLi) in the bulk electrode materials are obtained using eqn (2):37,38
| | |
Zre = Rs + Rf + Rct + σωω−1/2
| (1) |
| |
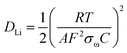 | (2) |
where the
R is the gas constant,
T the absolute temperature,
F the Faraday's constant,
A the area of the electrode surface, and
C is the molar concentration of Li ions. The calculated
σω and
DLi is shown in
Table 2. It is found that the value of Warburg impedance coefficient (
σω) after 500 cycles is 48.55 Ω s
−1/2 for HB-SiO, which is considerably lower than 68.93 Ω s
−1/2 of HC-SiO. Also, the obtained
DLi values for the samples explain the higher mobility for Li
+ diffusion in HB-SiO electrode rather than the HC-SiO electrode. The enhanced Li
+ behaviors indicate that the B-doping instead of carbon coating on SiO negative electrodes provides effective Li
+ diffusion pathway on SiO, which helps reversible redox reaction during long cycles.
 |
| | Fig. 6 (a) Equivalent circuit and fitting spectra and (b) relationship between real impedance with the low frequencies of HB-SiO and HC-SiO electrodes after 500 cycles. | |
Table 2 The EIS parameters of HB-SiO and HC-SiO electrodes after 500 cycles
| Sample |
Rs (Ω) |
Rf (Ω) |
Rct (Ω) |
σω (Ω s−1/2) |
D (cm2 s−1) |
| HB-SiO |
14.95 |
9.4 |
87.94 |
48.55 |
1.71 × 10⁻¹¹ |
| HC-SiO |
11.35 |
9.96 |
145.87 |
68.93 |
7.46 × 10⁻¹² |
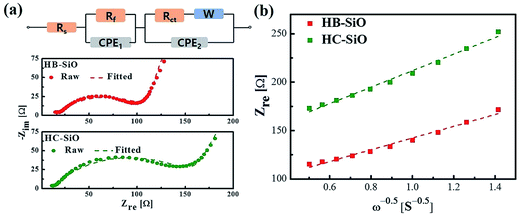
The evidence of capacity fading is explained by directly observing the morphological changes of both electrode materials. As shown in Fig. 7(a)–(d), surface deformation and increased surface roughness of both electrodes compared to those in pristine SiO particles were confirmed by a FE-TEM analysis in a full delithiation state using the electrodes operated for 500 cycles. Moreover, as described in Fig. 7(e) and (f), cross-sectional images of the HB-SiO electrode were obtained using focused ion beam (FIB) sputtering along the direction perpendicular to the Cu foil. From the TEM image and EDX mapping of the Si element, we noted that the micro-sized SiO particles retain their original shapes after 500 cycles, apart from some surface crumbling. Moreover, the EDX element mapping results reveal that the nanoporous surface regions of SiO particles mainly consist of solid electrolyte interphases (SEI) arising from the reaction with the LiPF6 electrolyte and the FEC additives (see ESI Fig. S3†). As we observed, both electrodes were affected by structural deformation that was driven by the inevitable volume expansion and chemical reaction during the long cycling. Once the electrode materials are electrically disconnected from the conducting network, they can no longer reversibly take part in the alloying/de-alloying process. As the surface crumbling of the HC-SiO electrode proceeded, the electrical loss between the SiO and the carbon-coating layer worsened upon cycling, and it is the main reason for the enhancement of capacity fading of HC-SiO electrode. Therefore, we suggest that the carbon-coating affects only the local surface area and not the bulk properties that cause capacity fading due to the microstructural changes upon cycling. On the other hand, even when the surfaces of the HB-SiO electrodes are pulverized, the remaining materials are electrochemically active due to the presence of Li ion diffusion pathways created by the B-doping process.20,28 Thus, without carbon-coating of the surface in HB-SiO electrodes, Li ions could diffuse into the inside of the bulk SiO and be released during the de-alloying process upon long cycling, leading to a highly reversible reaction. The comparative Li ion behavior after 500 cycles in both electrodes is schematically depicted in Fig. 7(g).
 |
| | Fig. 7 TEM images of (a and b) HB-SiO and (c and d) HC-SiO electrodes after 500 cycles. (e) Cross-sectional STEM images of the HB-SiO and (f) corresponding EDX element mapping of Si. (g) Comparative illustrations of Li+ behavior for both electrodes after 500 cycles. | |
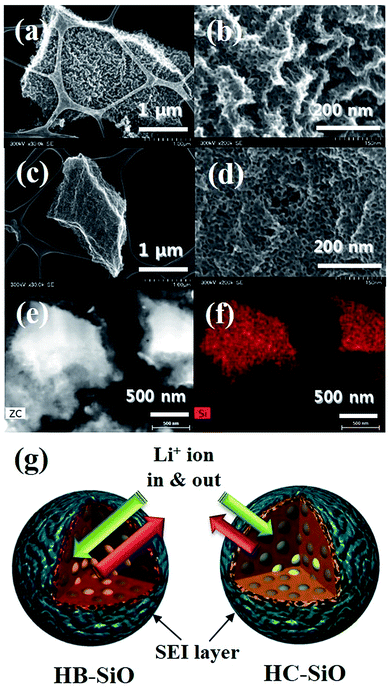
To verify our claims, the differential capacity–voltage (dQ/dV) curves of these two samples are derived from their voltage profiles, as depicted in Fig. 8(a) and (b). At initial lithiation processes, SiO is reduced to Si and the electrochemically irreversible Li2O and Li4SiO4 phases are generated simultaneously. Also, the Si is lithiated and forms the amorphous LixSi alloys. Therefore, the conversion and alloying reactions are occurred during initial stages as described in the following equations.34,39
| | |
SiO + 2Li+ + 2e− → Li2O + Si
| (3) |
| | |
4SiO + 4Li+ + 4e− → Li4SiO4 + 3Si
| (4) |
 |
| | Fig. 8 (a and b) Differential capacity vs. voltage (dQ/dV) at different cycles for both electrodes. (c) Ex situ XRD patterns of fresh and 500 cycle tested electrodes. | |
From the Fig. 8(a) and (b), we suggest that the broad cathodic region ranging from 0.25 V to 0.5 V was attributed to the decomposition of electrolyte and the formation of inactive products.40,41 In the following cycles, a much more prominent lithiation peak appeared due to the formation of Li–Si phases. The cathodic peaks appearing at 0.23 and 0.08 V are associated with the phase transition of amorphous LixSi, as this region is the only dominant region for amorphous LixSi phases upon cycles.42,43 During the de-alloying reactions, the anodic peaks at 0.3 and 0.48 V stem from phase transitions between the amorphous LixSi phases.42,43 When Li was extracted, the decomposition of LixSi was observed at 0.3 V.44 It should be noted that the oxidation peaks at 0.3 V are clearly retained during the oxidation processes in the HB-SiO electrode, representing the excellent Li ion kinetics during the delithiation process. Moreover, the peak intensity due to the de-alloying of the Li ions from the LixSi phase does not decrease even after 500 cycles in the HB-SiO electrode, suggesting that the Li ions were inserted into the connected nc-Si/SiOx, and they could be easily released along to the Li ion diffusion pathway leading to an excellent reversible reaction during the de-alloying process. In contrast, the oxidation peaks of the HC-SiO electrode are gradually decreased upon cycling, which reflects the poor Li ion kinetics due to the deficiency of Li ion pathways. From the XRD measurements in a fully delithiation state, we found that the SEI, mostly Li2CO3 and LiF, were mainly formed in both tested electrodes, as displayed in Fig. 8(c).45,46 Furthermore, it should be mentioned that nc-Si peaks, as indicated by the red box in Fig. 8(c), clearly observed only in the HB-SiO electrode after 500 cycle tests. These results imply that the existence of the nc-Si phase can be attributed to the enhancement of the Li ion kinetics in the HB-SiO electrode compared to that in the HC-SiO electrode. However, the HC-SiO electrode that is delithiated after 500 cycles does not show diffraction peaks for nc-Si, meaning that Li ions in the HC-SiO electrode were not fully extracted upon the delithiation process due to the poor reversible reaction. Therefore, we suggest that long cycle stability is strongly related to the Li ion diffusion path provided by B-doping on the SiO anode materials rather than electrical pathways created by the carbon-coating process.
IV. Conclusion
This work proposed a comparative study of B-doped and carbon-coated SiO anode materials for the purpose of improving the electrochemical performances in terms of long cycle-stability. We found that capacity fading inevitably arises due to the electrical loss between the SiO anode materials and the carbon-coating during repetitive cycling. In contrast, the HB-SiO electrodes retain good electrochemical activity in spite of the morphological changes and surface cracking. We suggest that the excellent electrochemical performances of the HB-SiO electrode are attributed to the Li ion diffusion pathways inside the B-doped SiO materials, which enhances the reversible redox reaction during the alloying/de-alloying process. As a result, our findings indicate that suitable impurity doping instead of conventional carbon-coating can provide an effective route for alloy-type anode materials for high performance LIB applications.
Acknowledgements
This work was financially supported by a basic research program (16-EN-01 & 15-HRMA-01) through the Daegu-Gyeongbuk Institute of Science and Technology (DGIST) funded by the Ministry of Science, ICT and Future Planning of the Korean government (MSIP).
References
- P. Poizot, S. Laruelle, S. Grugeon, L. Dupont and J.-M. Tarascon, Nature, 2000, 407, 496–499 CrossRef CAS PubMed.
- M. Armand and J.-M. Tarascon, Nature, 2008, 451, 652–657 CrossRef CAS PubMed.
- M. M. Thackeray, C. Wolverton and E. D. Isaacs, Energy Environ. Sci., 2012, 5, 7854–7863 CAS.
- M. R. Palacín and A. de Guibert, Science, 2016, 351, 1253292 CrossRef PubMed.
- A. S. Aricò, P. G. Bruce, B. Scrosati, J. M. Tarascon and W. V. Schalkwijk, Nat. Mater., 2005, 4, 366–377 CrossRef PubMed.
- V. Etacheri, R. Marom, R. Elazari, G. Salitra and D. Aurbach, Energy Environ. Sci., 2011, 4, 3243–3262 CAS.
- S. Goriparti, E. Miele, F. De Angelis, E. Di Fabrizio, R. P. Zaccaria and C. Capiglia, J. Power Sources, 2014, 257, 421–443 CrossRef CAS.
- Y. Idota, T. Kubota, A. Matsufuji, Y. Maekawa and T. Miyasaka, Science, 1997, 276, 1395–1397 CrossRef CAS.
- J. O. Besenhard, J. Yang and M. Winter, J. Power Sources, 1997, 68, 87–90 CrossRef CAS.
- W. J. Weydanz, M. Wohlfahrt-Mehrens and R. A. Huggins, J. Power Sources, 1999, 81, 237–242 CrossRef.
- T. D. Hatchard and J. R. Dahn, J. Electrochem. Soc., 2004, 151, A838–A842 CrossRef CAS.
- U. Kasavajjula, C. S. Wang and A. J. Appleby, J. Power Sources, 2007, 163, 1003–1039 CrossRef CAS.
- H. Park, S. Lee, S. Yoo, M. Shin, J. Kim, M. Chun, N.-S. Choi and S. Park, ACS Appl. Mater. Interfaces, 2014, 6, 16360–16367 CAS.
- H. Wu, G. Chan, J. W. Choi, I. Ryu, Y. Yao, M. T. McDowell, S. W. Lee, A. Jackson, Y. Yang, L. Hu and Y. Cui, Nat. Nanotechnol., 2012, 7, 310–315 CrossRef CAS PubMed.
- H. Morimoto, M. Tatsumisago and T. Minami, Electrochem. Solid-State Lett., 2001, 4, A16–A18 CrossRef CAS.
- A. Netz, R. A. Huggins and W. Weppner, J. Power Sources, 2003, 119–121, 95–100 CrossRef CAS.
- Y. Nagao, H. Sakaguchi, H. Honda, T. Fukunaga and T. Esaka, J. Electrochem. Soc., 2004, 151, A1572–A1575 CrossRef CAS.
- M. Miyachi, H. Yamamoto, H. Kawai, T. Ohta and M. Shirakata, J. Electrochem. Soc., 2005, 152, A2089–A2091 CrossRef CAS.
- T. Kim, S. Park and S. M. Oh, J. Electrochem. Soc., 2007, 154, A1112–A1117 CrossRef CAS.
- J. Woo, S.-H. Baek, J.-S. Park, Y.-M. Jeong and J. H. Kim, J. Power Sources, 2015, 299, 25–31 CrossRef CAS.
- T. Morita and N. Takami, J. Electrochem. Soc., 2006, 153, A425–A430 CrossRef CAS.
- J.-H. Kim, H.-J. Sohn, H. Kim, G. Jeong and W. Choi, J. Power Sources, 2007, 170, 456–459 CrossRef CAS.
- A. Veluchamy, C.-H. Doh, D.-H. Kim, J.-H. Lee, D.-J. Lee, K.-H. Ha, H.-M. Shin, B.-S. Jin, H.-S. Kim, S.-I. Moon and C.-W. Park, J. Power Sources, 2009, 188, 574–577 CrossRef CAS.
- H. Zhao, N. Yuca, Z. Zhang, Y. Fu, V. S. Battaglia, G. Abdelbast, K. Zaghib and G. Liu, ACS Appl. Mater. Interfaces, 2015, 7, 862–866 CAS.
- I. Choi, M. J. Lee, S. M. Oh and J. J. Kim, Electrochim. Acta, 2012, 85, 369–376 CrossRef CAS.
- K. W. Kim, H. Park, J. G. Lee, J. Kim, Y.-U. Kim, J. H. Ryu, J. J. Kim and S. M. Oh, Electrochim. Acta, 2013, 103, 226–230 CrossRef CAS.
- J. Wang, M. Zhou, G. Tan, S. Chen, F. Wu, J. Lu and K. Amine, Nanoscale, 2015, 7, 8023–8034 RSC.
- R. Yi, J. Zai, F. Dai, M. L. Gordin and D. Wang, Electrochem. Commun., 2013, 36, 29–32 CrossRef CAS.
- D. Wang, M. Gao, H. Pan, J. Wang and Y. Liu, J. Power Sources, 2014, 256, 190–199 CrossRef CAS.
- F. Tuinstra and J. L. Koenig, J. Chem. Phys., 1970, 53, 1126–1130 CrossRef CAS.
- J. I. Lee, K. T. Lee, J. Cho, J. Kim, N. S. Choi and S. Park, Angew. Chem., Int. Ed., 2012, 124, 2821–2825 CrossRef.
- C. M. Park, W. Choi, Y. Hwa, J. H. Kim, G. Jeong and H. J. Sohn, J. Mater. Chem., 2010, 20, 4854–4860 RSC.
- T. Tabuchi, H. Yasuda and M. Yamachi, J. Power Sources, 2005, 146, 507–509 CrossRef CAS.
- M. Miyachi, H. Yamamoto and H. Kawai, J. Electrochem. Soc., 2007, 154, A376–A380 CrossRef CAS.
- E. Pollak, G. Salitra, V. Baranchugov and D. Aurbach, J. Phys. Chem. C, 2007, 111, 11437–11444 CAS.
- R. Ruffo, S. S. Hong, C. K. Chan, R. A. Huggins and Y. Cui, J. Phys. Chem. C, 2009, 113, 11390–11398 CAS.
- A. J. Bard and L. R. Faulkner, Electrochemical Methods, John Wiley & Sons, New York, 2nd edn, 2001, p. 380 Search PubMed.
- N. Ding, J. Xu, Y. X. Yao, G. Wegner, X. Fang, C. H. Chen and I. Lieberwirth, Solid State Ionics, 2009, 180, 222–225 CrossRef CAS.
- Q. Si, K. Hanai, T. Ichikawa, M. B. Phillipps, A. Hirano, N. Imanishi, O. Yamamoto and Y. Takeda, J. Power Sources, 2011, 196, 9774–9779 CrossRef CAS.
- I. W. Seong and W. Y. Yoon, J. Power Sources, 2010, 195, 6143–6147 CrossRef CAS.
- L. Shi, W. Wang, A. Wang, K. Yuan, Z. Jin and Y. Yang, J. Power Sources, 2016, 318, 184–191 CrossRef CAS.
- M. N. Obrovac and L. J. Krause, J. Electrochem. Soc., 2007, 154, A103–A108 CrossRef CAS.
- Y. Oumellal, N. Delpuech, D. Mazouzi, N. Dupre, J. Gaubicher, P. Moreau, P. Soudan, B. Lestriez and D. Guyomard, J. Mater. Chem., 2011, 21, 6201–6208 RSC.
- W.-S. Chang, C.-M. Park, J.-H. Kim, Y.-U. Kim, G. Jeong and H.-J. Sohn, Energy Environ. Sci., 2012, 5, 6895–6899 CAS.
- B. Philippe, R. Dedryvère, J. Allouche, F. Lindgren, M. Gorgoi, H. Rensmo, D. Gonbeau and K. Edström, Chem. Mater., 2012, 24, 1107–1115 CrossRef CAS.
- T. Jaumann, J. Balach, M. Klose, S. Oswald, U. Langklotz, A. Michaelis, J. Eckert and L. Giebeler, Phys. Chem. Chem. Phys., 2015, 17, 24956–24967 RSC.
Footnote |
| † Electronic supplementary information (ESI) available. See DOI: 10.1039/c6ra27804c |
|
| This journal is © The Royal Society of Chemistry 2017 |
Click here to see how this site uses Cookies. View our privacy policy here. 
 Open Access Article
 This Open Access Article is licensed under a Creative Commons Attribution-Non Commercial 3.0 Unported Licence
 *
*