DOI:
10.1039/C6RA27733K
(Paper)
RSC Adv., 2017,
7, 11550-11560
Simulation of a conventional water treatment plant for the minimization of new emerging pollutants in drinking water sources: process optimization using response surface methodology†
Received
4th December 2016
, Accepted 31st January 2017
First published on 14th February 2017
Abstract
This study describes the ability of conventional water treatment plants towards the removal of non-targeted new emerging pollutants (NEPs) by optimizing the variables such as pH and polyaluminium chloride (PAC), activated carbon, and chlorine (Cl2) concentrations. Gas chromatography-mass spectrometry (GC-MS) was used for the separation and quantification of NEPs. Several NEPs, including ibuprofen, a drug expected to exhibit carcinogenicity at lower concentrations, were identified in selected river water samples. The simulation experiments were conducted using jar tests to minimize the turbidity, TOC, and ibuprofen concentrations in water samples. In addition, response surface methodology (RSM) with central composite design (CCD) was chosen for process optimization as well as to study the influences of the four factors viz., pH of the solution, PAC dosage, and activated carbon and Cl2 concentrations, on the treatment process. The quadratic models established for the three responses viz., turbidity, TOC, and ibuprofen removal, evidenced the lower values of 0.51 NTU, 1.21 mg L−1, and 52.53% for the turbidity, TOC, and % removal of ibuprofen, respectively, upon optimization of the selected variables. Moreover, the optimum conditions were evaluated, aiming at 90% ibuprofen removal, which was found to be attained at 26.50 ppm of PAC, 49.20 ppm of activated carbon, and 12.10 ppm of Cl2 concentration at the pH value of 7.99. It was also confirmed that the experimental results are very close to the predicted values. In addition, the removal of other NEPs, turbidity, and TOC was also maximum under the optimized conditions. Finally, our results imply that NEPs are not only removed by coagulation itself, but also by adjusting other parameters such as pH and Cl2 concentration. Herein, the advantages of the RSM approach in achieving good predictions have been explained via conducting minimum number of experiments.
1. Introduction
The presence of new emerging pollutants (NEPs) in the environment is not new and they have remained in the environment for a long time. However, researchers are now trying to elucidate their presence and significance. These are often referred as contaminants of emerging concern (CEC) because of their risk associated with human health and the environment.1,2 These pollutants are entering the aquatic and terrestrial ecosystems by different routes and from different origins such as human and animal excretion, discharge from the production centers, disposition of surplus drugs etc.3 Among the various categories of emerging pollutants, pharmaceuticals and pesticide residues are considered as a major class as they are being detected in various ecosystems. Most of these pollutants raise considerable toxicological concerns since they are intrinsically and biologically active molecules. Different inspections in Europe and the US have revealed the presence of hundreds of these pollutants in trace amounts in surface water, ground water, drainage water, wastewater effluents, and alarmingly in tap water.4
The presence of NEPs, such as pharmaceuticals and pesticides, in surface water is of special concern since surface water is a key source of drinking water in the growing urban population areas. Therefore, the presence of these pollutants in the drinking water even at low concentrations, such as ppb or ppt, will impact human health due to chronic exposure. There are many widely used pharmaceuticals, such as acetaminophen, caffeine, carbamazepine, diclofenac, and ibuprofen, whose presence has been acknowledged in different water sources in many countries.5 In recent years, low concentrations of pharmaceutical compounds have been detected in drinking water supplies.6–8 In addition, studies have also described the existence of various pharmaceuticals in surface water and the inability of conventional water treatment plants towards their removal.9,10 The extensive occurrence of these NEPs in surface waters may cause severe problems as these surface waters are preferably used for drinking purposes.11
Ibuprofen (2-(4-isobutylphenyl)propionic acid) is a derivative of propionic acid and is the leading non-steroidal anti-inflammatory drug (NSAID) marketed in many countries. It is primarily used for musculoskeletal therapy and less importantly used as an analgesic. This drug is marketed in the doses of 400 mg and 600 mg as tablets or capsules and is extensively used all over the world. Among the top most drugs prescribed in the US in the year 2005, ibuprofen has occupied the 17th position.12,13 Numerous studies have confirmed the presence of ibuprofen in surface waters in the concentration range of 0.05–0.28 mg L−1. Therefore, it is necessary to evolve potential treatment practices for the removal of pharmaceuticals. Although, to date, there is no strong evidence regarding the adverse effects of ibuprofen on human health at trace levels, it would be beneficial to consider the principle of precaution and make the drinking water free from ibuprofen, thus reducing the potential long term risks.14 The negative impacts of ibuprofen on the biological systems were well studied and are inevitable. The toxic response of frog embryos towards various doses of ibuprofen using a frog embryo teratogenesis assay-Xenopus (FETAX) has been studied by Richards and Cole. The inhibition of embryo growth was noticed at a concentration of 30 mg L−1 after 96 h of exposure and no single embryo survived at concentrations above 70 mg L−1.15 However, note that this concentration is extreme and has never been reported in the environment. The abovementioned results have been produced, thriving concerns in the scientific community, to come up with the possibility that certain drugs and their combinations may damage human health when people consume considerable amount of water every day for decades unlike the most specific foods. Hence, water quality regulations and safety limits have been established considering the existence of pharmaceuticals at trace levels.
In recent years, several studies have been reported on the removal of NEPs during the water treatment process. Some of these have monitored the removal of NEPs using WTP samples, whereas the majority of them have reported the removal of NEPs by conducting laboratory experiments. However, the process efficiency is somewhat different with the removal processes conducted on a laboratory scale and in the WTP. Numerous studies have shown that conventional treatment processes are not effective for the removal of these compounds.16–20 Although studies have proved that a combination of a natural system with any advanced treatment process will effectively work for the removal of organic pollutants, these technologies are very expensive to adopt in the water treatment plants of developing countries.21 However, coagulation, flocculation, and chlorination processes are extensively used to treat water as they are economical and simple to operate. A number of parameters, including type and dosage of coagulant/flocculant, pH of the water, mixing speed and time, temperature, and retention time, influence the process efficiency. In addition, the removal efficiency will increase with the appropriate optimization of these parameters.22 In conventional multifactor experiments, optimization is generally achieved by changing the values of a single parameter, whereas keeping all the other parameters constant under a specific set of conditions. However, this is not only a time-consuming, but also an inadequate process for achieving the optimum values since the interactions among these variables are neglected. Therefore, RSM has been proposed to overcome these disadvantages, in which the influence of individual factors and their interactions can be well studied. RSM helps to design the experiments, build the models, evaluate the effects of various parameters, and find the optimum values to obtain the best response. Further, RSM helps to find the possible interactions among the selected parameters using a very limited number of experiments.23
Although many studies have been reported for the removal of specific NEPs using RSM for process optimization, no studies have monitored the removal of turbidity and TOC during the removal of NEPs.24–27 These two parameters are also crucial when the studies are conducted for the drinking water purposes. Therefore, in the present study, we aimed to identify the non-targeted NEPs present in the river water samples and also to assess their removal along with the turbidity and TOC by optimizing the pH, PAC, and activated carbon and Cl2 concentrations. All the selected variables were optimized using RSM to achieve the best removal of NEPs. The effect of initial pH, coagulant dose, and activated carbon and Cl2 concentrations were explored using a full factorial CCD. All the experiments were performed using the jar test, a commonly used process to assess the treatment efficacy. Eventually, the goal of this study was to apply these results to minimize the NEPs in the drinking water sources, from which we can improve the quality of drinking water.
2. Materials and methods
2.1. Reagents
Ibuprofen and bisphenol A standards were supplied by Sigma-Aldrich (St Louis, MO, USA) with purities >98%. Other reference standards of benzene, ethyl benzene, xylene, toluene, and dodecene were obtained from Merck (Darmstadt, Germany). Acetonitrile, acetone, dichloromethane, hexane, ethyl acetate, and methanol were procured from S.D. fine chemicals (Mumbai, India) and were of analytical/HPLC grade. Activated carbon, PAC, and sodium hypochlorite were provided by a local water treatment plant (SAJ Skudai, Johor, Malaysia). SPE cartridges of Oasis HLB from Waters (Milford, MA, USA) and Chromabond C18 (Macherey-Nagel, Germany) were used for the clean-up and preconcentration of water samples. A Milli-Q water system was used to obtain ultrapure water (Millipore, Bedford, MA, USA).
2.2. Sampling
River water samples were collected in a single attempt during October 2015. A total of 25 liters of river water was collected and stored in a chiller. Sampling was carried out at the in-flow of the water treatment plant at Skudai River, a major drinking water source of Johor city in Malaysia. This river is the source of drinking water for more than three million population in Johor. The preliminary characteristics of the collected water samples are listed in Table S1.†
2.3. Test variables
Initially, 20 preliminary experiments were conducted to determine the range of the selected variables viz., pH value, PAC, activated carbon, and Cl2 concentrations. The working ranges of the selected variables were 6.0–8.0 for pH, 5.0–25 ppm for PAC, 10–50 ppm for activated carbon, and 10–30 ppm for Cl2. The jar test experiments were performed and the variables were fixed considering the final turbidity of water < 1.0 NTU. Moreover, the ranges for pH and Cl2 were selected following the guidelines of “Council Directive 98/83/EC (1998), established benchmarks for the quality of drinking water for human consumption in Europe”.
2.4. Jar test experiments
Simulation of coagulation, flocculation, sedimentation, and chlorination practices of conventional treatment plants was achieved using scaled-down jar tests. The jar test experiments were carried out in 500 mL beakers with six paddle stirrers obtained from Phipps and Bird. The time and speed of the stirrer to increase and reduce the mixing speed was adjusted with an automatic controller. After adding PAC and activated carbon in their respective concentrations, the solution pH was adjusted in the range between 6.0 and 8.0 using 0.1 M hydrogen chloride and sodium hydroxide solutions. The samples were rapidly stirred at a fixed speed of 140 rpm for 5.0 min to provide fast mixing, followed by slow mixing at 45 rpm for 10 min to provide flocculation, and then the solutions were kept undisturbed for 15 min for the particles to settle down. Later, the samples were collected from water about 2.0 cm depth from the surface to measure the turbidity, pH, TOC, and removal percentage of the NEPs. The solution pH was measured using a pH meter (F-54 BW, Horiba, Japan) and the turbidity was measured by a standard nephelometric method using turbidimeter (2100N, HACH, USA), followed by the percentage removal of NEPs using GC-MS.
2.5. Sample analysis
The identification and quantification of NEPs were carried out using GC-MS after solid phase extraction of the samples. Preconcentration of the non-targeted NEPs in the water samples was carried out by passing the samples through Chromabond C18 solid phase extraction cartridges. First, the preconditioning was carried out using 5.0 mL of methanol followed by 10 mL of Milli-Q water. After this, 500 mL of water samples were passed through the cartridges at a flow rate of 15 mL min−1. After removing the residual water from the cartridges, 5.0 mL of methanol was used for the elution. Finally, the extracts were evaporated to attain a final volume of 1.0 mL and were immediately injected for GC-MS analysis after the preparation of the samples. Among all the identified NEPs, ibuprofen was selected for the removal experiments. The removal percentage of ibuprofen by varying the selected parameters (pH value, PAC, activated carbon, and Cl2 concentrations) in the jar test experiments was examined to select the most effective composition to achieve the best removal of ibuprofen and other NEPs.
2.6. GC-MS operating conditions
A HP 6890 gas chromatograph (GC) was equipped with a HP 7683 auto sampler and a HP 5973 mass detector (MSD) was equipped with a BPX5 column (50 m × 0.25 mm i.d. with 0.25 μm thickness). The instrument parameters were applied as follows: injector temperature 250 °C, column oven temperature ranged from 50 °C (2.0 min) to 110 °C (2.0 min) at 6.0 °C min−1, and then to 230 °C (4.0 min) at 10 °C min−1, injection volume 2.0 μL in splitless mode, and carrier gas flow rate of 1.0 mL min−1. The transfer line and quadrupole temperatures were retained as 240 °C and 150 °C, respectively. The filament (70 eV) was turned on after a 3.0 min run of the GC program. The GC injections were carried out using a Varian 8200 auto sampler via a 100 μL syringe into a SPI/1079 split/splitless programmed temperature injector operated using the broad volume injection technique. The total analysis time was 30 min and the equilibration time was 0.5 min. The analysis was achieved in selected ion recording (SIR) mode with a mass-to-charge ratio between m/z 50 to 500. The non-targeted NEPs were identified based on their m/z values. The ion fragment m/z 207 was used for the confirmation of ibuprofen. The ion fragments m/z 77, m/z 92, m/z 106, m/z 106, and m/z 227 were monitored for the confirmation of benzene, toluene, ethyl benzene, xylene, and bisphenol A, respectively. In addition, Table S2† shows the list of non-targeted NEPs and their possible routes of entry into the drinking water sources.
2.7. Sample preparation
Prior to sample preparation, all the samples were sieved through a 150 μm sieve and homogenized. Initially, various SPE cartridges, including Oasis HLB (200 mg and 500 mg) and Chromabond C18 (200 mg and 500 mg), were evaluated for the best extraction recoveries. First, 2.0 mL of methanol was added to the blank samples (500 mL) to extend the retention of analytes on the cartridges and were spiked with 1.0 μg L−1 of ibuprofen. From the results, it was found that the best recoveries were obtained in the range of 82.45–91.60% with Chromabond C18 cartridges using methanol as the eluent. It was also confirmed that the recoveries were best with 500 mg rather than 200 mg of sorbent, which confirms that the cartridges with 200 mg of sorbent were not able to retain ibuprofen and other NEPs. Further, several organic solvents were tested for the best elution of ibuprofen loaded on the selected SPE cartridges. Multiple solvents, such as dichloromethane, acetonitrile, ethyl acetate, hexane, methanol, acetone, and their mixtures were used to test the recoveries. Moreover, PTFE containers were used instead of glass in the sample preparation process to avoid loss of the analytes because the analytes tend to bind to the glass that may result in a significant loss. The recoveries of the analytes were determined as a ratio of the analytes concentration in the spiked samples to that of the standard calibration solutions. The best results were obtained when the elution was carried out using 5.0 mL of methanol.
2.8. Response surface methodology
It is necessary to design the experiments to adequately measure the selected responses. Generally, it is highly complicated to represent the relation between the selected responses (turbidity, TOC, and ibuprofen removal) and independent variables (pH, PAC, activated carbon, and Cl2 concentrations) using a first-order model. Therefore, a model that is capable to approximate the response in a region closer to the optimum is normally required and in most cases, a second-order model is sufficient. Hence, in this study, we selected CCD, which is a very efficient tool to fit in the second-order models. The required number of experiments for CCD are as follows: standard 2k cube points, 2 × k axial points axially fixed at a distance say α, from the center to produce the quadratic terms, and replicate tests at the center of the experimental region, where k denotes the number of variables. The independent evaluation of the experimental error is very important and can be obtained from the replicates of a test at the center. Commonly, five to seven center runs are recommended to know the exact experimental error. A CCD with 4 factors and 6 replicate tests at the center results a total of 16 + 08 + 06 = 30 runs. All 30 experiments were randomly conducted to avoid the impact of uncontrolled variables on the responses.
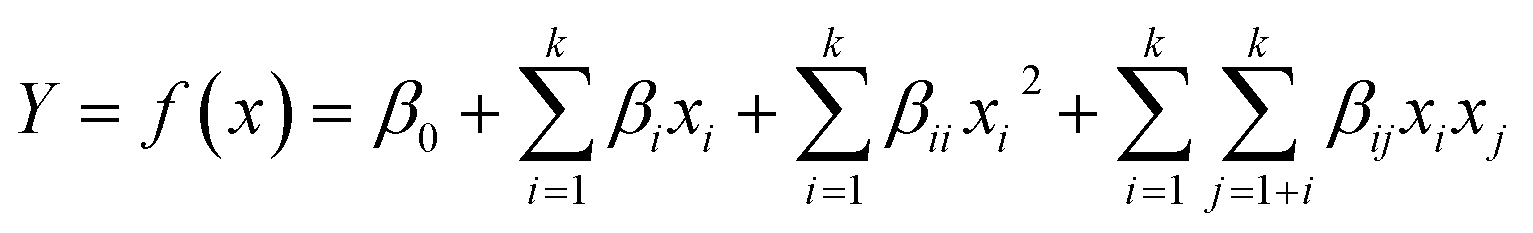
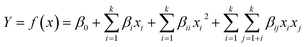
The composed data was statistically evaluated applying a regression analysis to ascertain if any relationship existed among the factors and their responses were examined. Further, a regression design was employed to model the response as a mathematical function of a few continuous factors and where ‘good’ model criterion estimates were desired.28 Every individual response of Y can be expressed using a mathematical equation that correlates the response surface. The responses can also be described by second-order polynomial equations, according to eqn (1)
| |
 | (1) |
where
Y stands for the predicted response (turbidity removal, ibuprofen removal, and TOC removal) employed as the dependent variable,
k denotes the number of independent variables,
xi and
xj denotes the independent variables that influence
Y,
β0 is a constant coefficient, and
βi,
βij, and
βii are the coefficients of linear, interaction, and quadratic terms, respectively. The actual design used in this study is displayed in
Table 1. A multiple linear regression analysis was conducted to estimate the coefficient parameters using Design-Expert software (version 8.0.1). The software was further utilized to express the 3D surface and 2D contour plots of the response models.
Table 1 The levels of the variables tested in 30 central composite designs
| Parameter |
Range and level |
| −α |
−1 |
0 |
1 |
α |
| A: pH |
6.0 |
6.5 |
7.0 |
7.5 |
8.0 |
| B: PAC (ppm) |
5.0 |
10 |
15 |
20 |
25 |
| C: activated carbon (ppm) |
10 |
20 |
30 |
40 |
50 |
| D: Cl2 dosage (ppm) |
10 |
15 |
20 |
25 |
30 |
To find the acceptable experimental domain, preliminary assessments were conducted to regulate the more effective ranges of pH value, PAC, activated carbon, and Cl2 concentrations prior to designing the experimental runs. From the preliminary investigations, it was observed that coagulation was most effective in the PAC range between 5 and 25 ppm, activated carbon range between 10 and 50 ppm, Cl2 dosage between 10 and 30 ppm, and pH range between 6.0 and 8.0. After determining the ranges of the variables, they were coded to lie at ±1 for the factorial points, 0 for the center points, and ±α for the axial points. The codes were determined as a function of the range of interest of each factor. A CCD experiment with 16 factorial points, 8 axial points, and 6 additional trials (run numbers 25–30) as replicates of the center point are presented in Table 2.
Table 2 The central composite design and response results for the four selected variables
| Std. |
Run |
Block |
Factor 1 |
Factor 2 |
Factor 3 |
Factor 4 |
Response 1 |
Response 2 |
Response 3 |
| A: pH |
B: PAC ppm |
C: Act car ppm |
Cl2 ppm |
Turbidity removal (NTU) |
TOC removal mg L−1 |
Ibuprofen removal (%) |
| 1 |
12 |
Block 1 |
7.50 |
20.00 |
20.00 |
25.00 |
0.77 |
1.91 |
39.11 |
| 2 |
10 |
Block 1 |
7.50 |
10.00 |
20.00 |
25.00 |
0.41 |
1.48 |
39.23 |
| 3 |
25 |
Block 1 |
7.00 |
15.00 |
30.00 |
15.00 |
0.86 |
1.99 |
48.99 |
| 4 |
05 |
Block 1 |
6.50 |
10.00 |
40.00 |
15.00 |
0.84 |
2.59 |
27.66 |
| 5 |
07 |
Block 1 |
6.50 |
20.00 |
40.00 |
15.00 |
0.51 |
1.38 |
29.44 |
| 6 |
27 |
Block 1 |
7.00 |
15.00 |
30.00 |
15.00 |
0.87 |
1.97 |
48.10 |
| 7 |
24 |
Block 1 |
7.00 |
15.00 |
30.00 |
25.00 |
0.87 |
1.81 |
51.89 |
| 8 |
15 |
Block 1 |
6.50 |
20.00 |
40.00 |
25.00 |
0.93 |
1.81 |
40.62 |
| 9 |
30 |
Block 1 |
7.00 |
15.00 |
30.00 |
15.00 |
0.89 |
2.01 |
48.18 |
| 10 |
02 |
Block 1 |
7.50 |
10.00 |
20.00 |
15.00 |
0.93 |
2.32 |
46.65 |
| 11 |
28 |
Block 1 |
7.00 |
15.00 |
30.00 |
15.00 |
0.86 |
1.92 |
49.60 |
| 12 |
16 |
Block 1 |
7.50 |
20.00 |
40.00 |
25.00 |
0.99 |
2.15 |
57.69 |
| 13 |
22 |
Block 1 |
7.00 |
15.00 |
50.00 |
30.00 |
0.91 |
2.41 |
54.87 |
| 14 |
18 |
Block 1 |
8.00 |
15.00 |
30.00 |
20.00 |
1.12 |
2.68 |
53.28 |
| 15 |
06 |
Block 1 |
7.50 |
10.00 |
40.00 |
15.00 |
0.75 |
2.31 |
48.03 |
| 16 |
13 |
Block 1 |
6.50 |
10.00 |
40.00 |
25.00 |
1.11 |
2.54 |
48.80 |
| 17 |
29 |
Block 1 |
7.00 |
15.00 |
30.00 |
15.00 |
0.91 |
1.91 |
49.19 |
| 18 |
03 |
Block 1 |
6.50 |
20.00 |
20.00 |
15.00 |
0.89 |
1.91 |
48.38 |
| 19 |
20 |
Block 1 |
7.00 |
25.00 |
30.00 |
20.00 |
0.91 |
1.31 |
45.84 |
| 20 |
04 |
Block 1 |
7.50 |
20.00 |
20.00 |
15.00 |
0.95 |
1.99 |
48.87 |
| 21 |
21 |
Block 1 |
7.00 |
15.00 |
10.00 |
20.00 |
0.46 |
1.54 |
52.27 |
| 22 |
26 |
Block 1 |
7.00 |
15.00 |
30.00 |
15.00 |
0.87 |
1.90 |
47.51 |
| 23 |
09 |
Block 1 |
6.50 |
10.00 |
20.00 |
25.00 |
0.51 |
1.73 |
54.20 |
| 24 |
23 |
Block 1 |
7.00 |
15.00 |
30.00 |
30.00 |
0.55 |
1.58 |
48.88 |
| 25 |
14 |
Block 1 |
7.50 |
10.00 |
40.00 |
25.00 |
1.05 |
2.21 |
54.60 |
| 26 |
08 |
Block 1 |
7.50 |
20.00 |
40.00 |
15.00 |
0.64 |
1.49 |
59.33 |
| 27 |
11 |
Block 1 |
6.50 |
20.00 |
20.00 |
25.00 |
0.68 |
1.47 |
49.13 |
| 28 |
19 |
Block 1 |
7.00 |
5.00 |
30.00 |
20.00 |
0.85 |
2.28 |
45.11 |
| 29 |
17 |
Block 1 |
6.00 |
15.00 |
30.00 |
20.00 |
1.11 |
2.76 |
39.82 |
| 30 |
01 |
Block 1 |
6.50 |
10.00 |
20.00 |
15.00 |
0.88 |
2.88 |
49.17 |
3. Results and discussion
3.1. Statistical analysis
The experimental outcomes, experimental design model, and the predicted turbidity, TOC, and ibuprofen removal are presented in Table 2. The CCD model was used to develop mathematical equations, in which each response Y = f(x) was determined as a function of pH value, PAC, activated carbon, and Cl2 concentrations. The results of the fitted models for turbidity, TOC, and ibuprofen removal are presented in eqn (2)–(4).| | |
Turbidity removal Y (NTU) = 0.98 + 0.13A − 8.333 × 10⁻⁵B + 0.10C + 8.970 × 10⁻⁵ + 0.15A2 − 0.085B2 − 0.040C2 − 0.041D2 + 0.13AB − 0.015AC − 0.040AD − 0.31BC + 0.18BD + 0.64CD
| (2) |
| | |
TOC removal Y (mg L−1) = 1.88 − 0.051A − 0.49B + 0.11C − 0.19D + 0.85A2 − 0.072B2 − 0.20C2 − 0.070D2 + 0.60AB + 0.032AC + 0.21AD − 0.42BC + 0.68BD + 0.87CD
| (3) |
| | |
Ibuprofen removal (%) = 52.41 + 6.09A + 0.47B − 1.44C + 3.42D − 6.10A2 − 7.17B2 − 2.57C2 − 8.11D2 + 7.19AB + 25.04AC − 12.59AD + 2.94BC − 6.20BD + 11.66CD
| (4) |
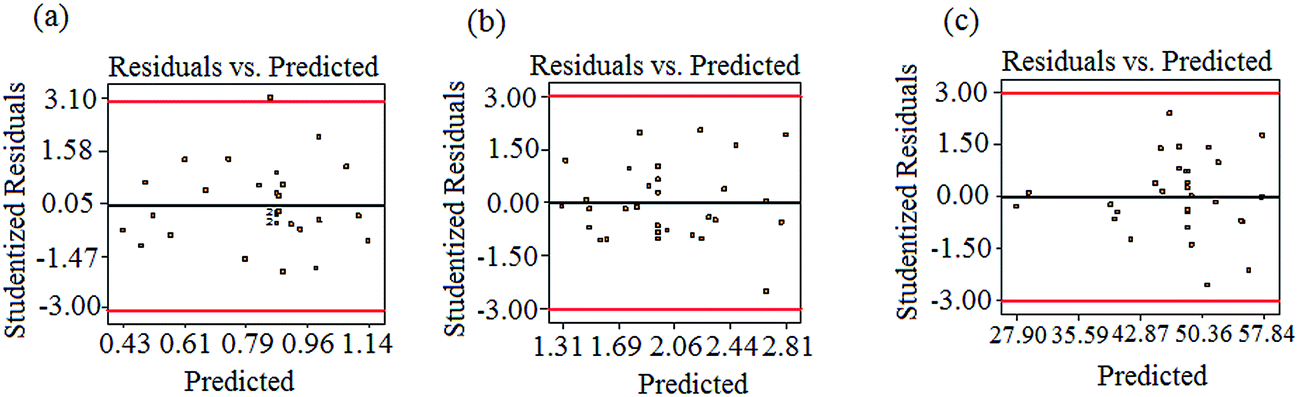
ANOVA results for the removal of turbidity, TOC, and ibuprofen are listed in Table 3. From the experimental results, the P-value of the regression model equation i.e., 0.0001 (P < 0.05) confirms that the results are best fitted to second-order polynomial model. As presented in Table 3, the model was found to be significant at a 95% confidence level with all p-values of regression ≤ 0.05, following the F-test. Moreover, the lack-of-fit values were also determined from the experimental error (pure error) and residuals. F-Values for the lack-of-fit are 4.82, 1.86, and 4.18 for turbidity, TOC, and ibuprofen removal, respectively, and indicate the significance of the model correlation among the selected variables and resulting process responses, as depicted in Fig. 1. Further, the lack-of-fit tests help to find the breakdown of a model and to represent the data of the points in an experimental domain, which are not incorporated in the regression. If a model is significant and contains one or more important terms that explain that the model does not suffer from the lack-of-fit, it does not necessarily mean that the model is good. If the experimental domain is absolutely noisy or some crucial variables are omitted from the experiment, there is a possibility to obtain a high residual value in the data, which was not explained by the model. Thus, the coefficient of determination, denoted by R2, must be considered to measure any model's overall performance. Moreover, the adjusted R2 allows for the degrees of freedom associated with the sum of the squares also to be considered in the lack-of-fit test, which is an approximate value of R2. When the difference between R2 and adjusted R2 values is vast it indicates the involvement of non-significant terms in the model. In addition, the value of R2 and R2(adj) for all the three parameters approves the model's accuracy. Moreover, the R2 values are not significantly different in the parity plots of the experimental and predicted values, as shown in Table 3. In addition, there is no strong evidence for the departures of normality from the normal probability plots of the residuals for turbidity, TOC, and ibuprofen removal, as shown in Fig. 2. As seen in Fig. 2, all the points in the plot form a fairly straight line, and hence, the normality hypothesis was relatively satisfied. As a result, we can say that the model is fairly suitable to describe the removal of turbidity, TOC, and ibuprofen using response surface methodology varying the pH value, PAC, activated carbon, and Cl2 concentrations. Hence, the second-order models, as presented in eqn (2)–(4), used to measure the responses are significant and acceptable.
Table 3 ANOVA results for the three responses viz., turbidity, TOC, and ibuprofen removal
| Turbidity removal |
| Source |
Sum of squares |
DF |
Mean square |
F value |
Prob > F |
|
| Model |
1.03 |
14 |
0.074 |
53.61 |
<0.0001 |
Significant |
| Residual |
0.021 |
15 |
1.372 × 10⁻³ |
|
|
|
| Lack of fit |
0.019 |
10 |
1.865 × 10⁻³ |
4.82 |
0.0482 |
Not significant |
| Pure error |
1.933 × 10⁻³ |
5 |
3.867 × 10⁻⁴ |
|
|
|
| Cor total |
1.05 |
29 |
|
|
|
|
| Std. Dev. |
0.037 |
R-Squared |
0.9804 |
| Mean |
0.83 |
Adj R-squared |
0.9621 |
| C.V. |
4.47 |
Pred R-squared |
0.8857 |
| PRESS |
0.12 |
Adeq precision |
27.366 |
| TOC removal |
| Source |
Sum of squares |
DF |
Mean square |
F value |
Prob > F |
|
| Model |
5.16 |
14 |
0.37 |
110.39 |
<0.0001 |
Significant |
| Residual |
0.050 |
15 |
3.339 × 10⁻³ |
|
|
|
| Lack of fit |
0.039 |
10 |
3.949 × 10⁻³ |
1.86 |
0.02553 |
Not significant |
| Pure error |
0.011 |
5 |
2.120 × 10⁻³ |
|
|
|
| Cor total |
5.21 |
29 |
|
|
|
|
| Std. Dev. |
0.058 |
R-Squared |
0.9904 |
| Mean |
2.01 |
Adj R-squared |
0.9814 |
| C.V. |
2.88 |
Pred R-squared |
0.9490 |
| PRESS |
0.27 |
Adeq precision |
36.617 |
| Ibuprofen removal |
| Source |
Sum of squares |
DF |
Mean square |
F value |
Prob > F |
|
| Model |
1436.06 |
14 |
102.58 |
52.82 |
<0.0001 |
Significant |
| Residual |
29.13 |
15 |
1.94 |
|
|
|
| Lack of fit |
26.02 |
10 |
2.60 |
4.18 |
0.0641 |
Not significant |
| Pure error |
3.11 |
5 |
0.62 |
|
|
|
| Cor total |
1465.19 |
29 |
|
|
|
|
| Std. Dev. |
1.39 |
R-Squared |
0.9801 |
| Mean |
47.48 |
Adj R-squared |
0.9616 |
| C.V. |
2.94 |
Pred R-squared |
0.8824 |
| PRESS |
172.34 |
Adeq precision |
30.383 |
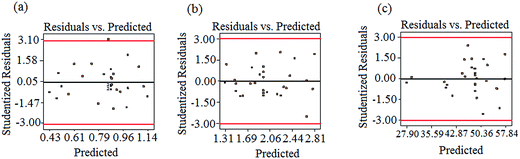 |
| | Fig. 1 The design expert plots of residuals vs. predicted values for (a) turbidity, (b) TOC, and (c) ibuprofen removal from water samples. | |
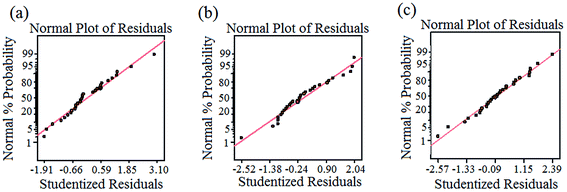 |
| | Fig. 2 The normal probability plots of the standardized residual for (a) turbidity, (b) TOC, and (c) ibuprofen removal. | |
3.2. Interpretation of the operational parameters using the response surface and counter plotting
According to the RSM model, the solution pH, PAC, activated carbon, and Cl2 concentrations are the terms that influence the removal of turbidity, TOC, and ibuprofen at a 95% confidence level. Further, 3D plots and their corresponding contour plots were described to better explain the independent variables and their influence on the removal of turbidity, TOC, and ibuprofen, as shown in Fig. 3. In Fig. 3(a)–(c), the pH value and Cl2 concentration were kept constant at 7.0 and 20 ppm, respectively, and the influence of PAC and activated carbon on the removal efficiency was studied. The best removal of turbidity was obtained at 22.38 ppm and 10.47 ppm of PAC, and 48.18 ppm and 15.43 ppm of activated carbon. The resultant turbidity of water at the abovementioned concentrations was 0.51 NTU. A relatively higher turbidity was observed between these concentrations and a lower turbidity was observed beyond the abovementioned limits. Moreover, the best removal of TOC i.e., 1.21 mg L−1 was observed at 22.86 ppm of PAC and 43.20 ppm of activated carbon. The removal efficiency was increased upon increasing the concentrations of PAC and activated carbon up to 25 ppm and 50 ppm, respectively, and then decreased upon further increase in their concentrations. Moreover, the best removal of ibuprofen (52.53%) was observed at 13.97 ppm of PAC and 20.69 ppm of activated carbon. Slightly lower removal rates for ibuprofen were obtained when the concentrations deviated from the abovementioned values. Overall, the removal of turbidity, TOC, and ibuprofen is highly dependent on PAC and activated carbon, whereas slightly dependent on the initial pH value and Cl2 concentration.
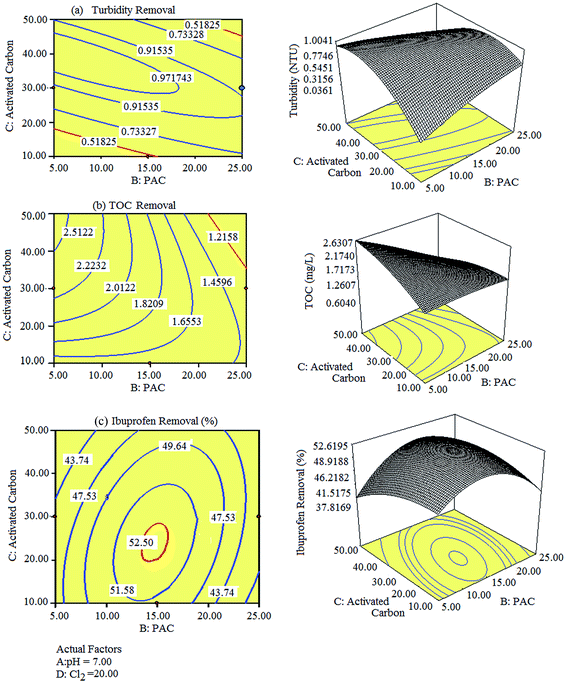 |
| | Fig. 3 Representative 3D images and their 2D contour plots obtained for the removal of (a) turbidity, (b) TOC, and (c) ibuprofen. | |
3.3. NEPs removal during the water treatment process
It is not easy to evaluate the removal of NEPs at a particular stage in the conventional treatment processes as the processes depend on several aspects (e.g., system arrangements, operation schedules, treatment conditions, and influent loadings in source waters) in WTPs. Hence, a detailed study is required to investigate the removal mechanism of various pollutants. In this study, we described the removal of several non-targeted NEPs at each stage of treatment in the WTP by comparing it with laboratory scale experiments. Generally, coagulation is the most common process for the removal of colloidal particles. However, research has disclosed that the coagulation process itself is not effective for the elimination of pollutants. Several researchers have reported that the coagulation process is capable of removing only 15% of pharmaceuticals and other NEPs.29–31 In addition, the removal of micropollutants during the coagulation process is not only achieved by coagulation, but also by the combination of adsorption and electrostatic interactions between the micropollutants and the coagulant. Then, the chlorination step is effective to eliminate microbial activity and it triggers the oxidation of organic materials. Moreover, it starts the ring cleavage of aromatic compounds and helps in the formation of oxidative by-products from pesticides and pharmaceuticals.31 However, the efficiency of chlorination is less than coagulation towards the removal of micropollutants.28 Moreover, it is highly complicated to determine the removal of NEPs at each stage as we do not handle these three processes side-by-side. Therefore, laboratory scale chlorination experiments were conducted to determine the efficacy of chlorination by varying the Cl2 concentration and solution pH. The turbidity, TOC, and NEPs removal rates were satisfactory when maintained at a higher Cl2 concentration i.e. 20 ppm. However, low removal rates of the NEPs were obtained using the higher Cl2 concentration (20 ppm) at a lower pH (6.0). Therefore, the Cl2 concentration and pH value were maintained at 20 ppm and 7.0, respectively, for the best removal of NEPs, turbidity, and TOC. A previous study also recommended that the solution pH plays an important role in the effective removal of pollutants.31 Our results suggest that the optimization of control factors, such as pH and Cl2 concentration, are necessary for the effective removal of micropollutants during the disinfection process.
3.4. Process optimization
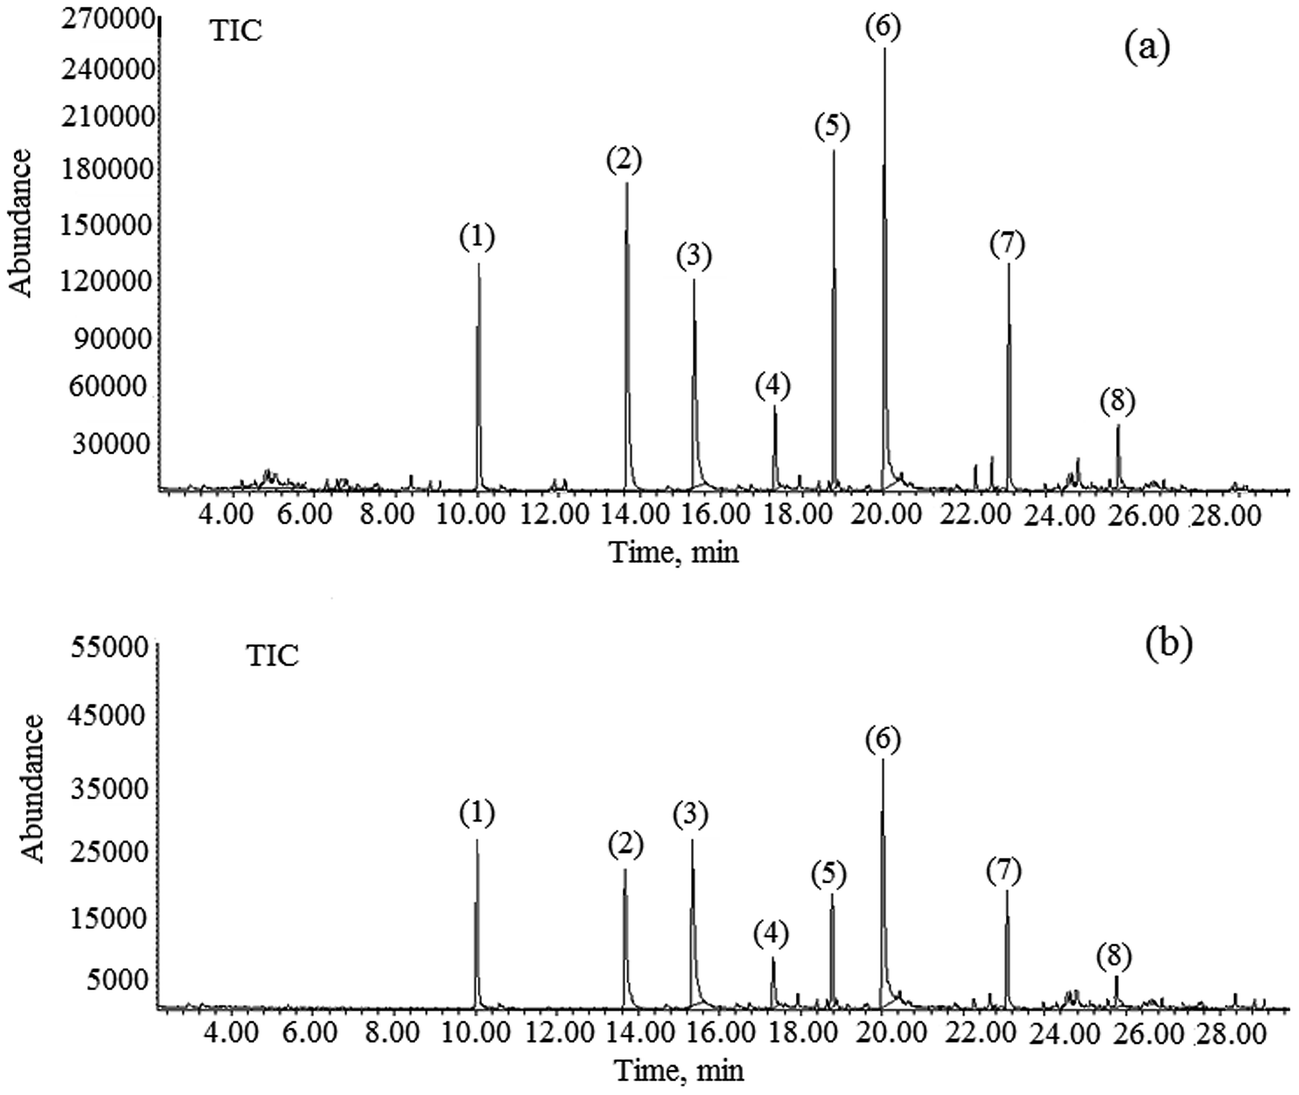
The optimum values to achieve a 90% removal of ibuprofen were determined first in coded units, and then converted into un-coded units using eqn (2)–(4). A solution pH of 7.99, Cl2 concentration of 12.10 ppm, PAC concentration of 26.50, and activated carbon concentration of 49.20 ppm were found as the optimum conditions using the RSM model. The experiments were repeated three times under these optimum conditions and the ibuprofen removal efficiencies were found to be 89.20%, 91.60%, and 88.10% with a % RSD < 3.0 (Table 4). The average removal efficiency of ibuprofen was 89.63%, which is closer to the model prediction of 90%. Fig. 4(a) and (b) illustrate the 3D response surface plot and 2D contour plot of the quadratic models for pH value, PAC, activated carbon, and Cl2 concentrations with respect to ibuprofen removal. As shown in Fig. 4(a), ibuprofen removal increased upon increasing the PAC and activated carbon concentrations. However, the concentrations of Cl2 and PAC were moderately maintained to avoid the formation of residual Cl2 in the final treated water. Hence, the concentration of Cl2 was restricted to 12.10 ppm and that of PAC was restricted to 35 ppm to avoid further health issues due to residual Cl2 if present in the final treated water. In addition, the concentrations of other non-targeted NEPs were also found to be minimal at this optimized level, which is an added advantage of the procedure. The gas chromatograms of the identified NEPs before and after the optimization process are shown in Fig. 5.
Table 4 Estimation of the second-order response surface parameters for the removal of ibuprofen
| Name |
Goal |
Lower limit |
Upper limit |
Solution |
Predicted value |
Experimental value |
Error (%) |
| pH |
Is in range |
6 |
8 |
7.99 |
— |
— |
— |
| PAC |
Is in range |
5 |
40 |
26.50 |
— |
— |
— |
| Activated carbon |
Is in range |
5 |
70 |
49.20 |
— |
— |
— |
| Cl2 |
Is in range |
10 |
40 |
12.10 |
— |
— |
— |
| Turbidity removal |
Is maximum |
0.41 |
1.12 |
— |
0.69 |
0.71 ± 0.42 |
2.89 |
| TOC removal |
Is maximum |
1.31 |
2.88 |
— |
1.25 |
1.23 ± 0.88 |
−1.62 |
| Ibuprofen removal |
Is target = 90% |
27.66 |
98 |
— |
90.0 |
89.63 ± 2.25 |
−0.46 |
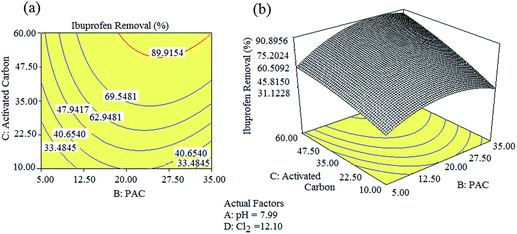 |
| | Fig. 4 2D contour plots and their 3D surface plots obtained for the removal of ibuprofen under the optimized conditions. | |
 |
| | Fig. 5 Gas chromatograms of all non-targeted NEPs viz., (1) benzene, (2) fluorides, (3) toluene, (4) ethyl benzene, (5) xylene, (6) bisphenol A, (7) dodecene, and (8) ibuprofen (a) before and (b) after the optimization process. | |
4. Conclusions
The benefits of RSM to attain the optimal conditions used during a conventional water treatment process via adjusting the pH value, PAC, activated carbon, and Cl2 concentrations were demonstrated in this study. Further, the RSM model was enforced as an experimental design to explore the optimal variables to remove the turbidity, TOC, and ibuprofen from river water samples by adjusting the pH value and PAC, activated carbon, and Cl2 concentrations. The impact and interactions of the four operating variables, including the initial pH value and PAC, activated carbon, and Cl2 concentrations, during the water treatment process were examined. The results of this study have proved that RSM is a powerful statistical optimization and modeling tool for the removal of pollutants using a conventional water treatment process. The models were represented as 3D response surfaces and 2D contour graphs to better explain the optimal performance. Moreover, the four variables viz., pH value and PAC, activated carbon, and Cl2 concentrations play crucial roles in minimizing the turbidity, TOC, and ibuprofen and other NEPs in the drinking water sources.
Conflict of interest
The authors declared that there is no conflict of interest.
Acknowledgements
The authors would like to acknowledge the Research University Grant, Universiti Teknologi Malaysia for supporting their postdoctoral fellowship and extended their thanks to the Ministry of Education Malaysia for funding the LRGS Grant on Water Security entitled Protection of Drinking Water: Source Abstraction and Treatment (203/PKT/6720006).
References
- S. Sauve and M. Desrosiers, A review of what is an emerging contaminant, Chem. Cent. J., 2014, 8, 1–5 CrossRef PubMed.
- V. Geissen, H. Mol, E. Klumpp, G. Umlauf, M. Nadal, M. Van der Ploeg, S. E. A. T. M. Van de Zee and C. J. Ritsema, Emerging pollutants in the environment: a challenge for water resource management, International Soil and Water Conservation Research, 2015, 3, 57–65 CrossRef.
- L. Lamastra, M. Balderacchi and M. Trevisan, Inclusion of emerging organic contaminants in ground water monitoring plans, MethodsX, 2016, 3, 459–476 CrossRef PubMed.
- A. Vijaya Bhaskar Reddy, V. Madhavi, K. Gangadhara Reddy and G. Madhavi, Remediation of chlorpyrifos contaminated soils by laboratory synthesized zero-valent nanoiron particles: effect of pH and aluminium salts, Journal of Chemistry, 2013, 521045 Search PubMed.
- S. E. Paul, J. Gibs, E. T. Furlong, M. T. Meyer, Z. D. Steven and R. L. Lee, Efficiency of conventional drinking-water-treatment processes in removal of pharmaceuticals and other organic compounds, Sci. Total Environ., 2007, 377, 255–272 CrossRef PubMed.
- C. Postigo and S. D. Richardson, Transformation of pharmaceuticals during oxidation/disinfection processes in drinking water treatment, J. Hazard. Mater., 2014, 279, 461–475 CrossRef CAS PubMed.
- C. C. Gordon, C. H. Yen and C. L. Wang, Monitoring and removal of residual phthalate esters and pharmaceuticals in the drinking water of Kaohsiung City, Taiwan, J. Hazard. Mater., 2014, 277, 53–61 CrossRef PubMed.
- S. Gabarron, W. Gernjak, F. Valero, A. Barcelo, M. Petrovic and I. R. Roda, Evaluation of emerging contaminants in a drinking water treatment plant using electrodialysis reversal technology, J. Hazard. Mater., 2016, 309, 192–201 CrossRef CAS PubMed.
- S. R. Mozaz, M. Ricart, M. K. Schulmeyer, G. Helena, C. Bonnineau, L. Proia, M. L. Alda, S. Sabater and D. Barcelo, Pharmaceuticals and pesticides in reclaimed water: efficiency assessment of a microfiltration-reverse osmosis (MF-RO) pilot plant, J. Hazard. Mater., 2015, 282, 165–173 CrossRef PubMed.
- Q. Bu, B. Wang, J. Huang, S. Deng and G. Yu, Pharmaceuticals and personal care products in the aquatic environment in China: a review, J. Hazard. Mater., 2013, 262, 189–211 CrossRef CAS PubMed.
- A. Ziylan and N. H. Ince, The occurrence and fate of anti-inflammatory and analgesic pharmaceuticals in sewage and fresh water: treatability by conventional and non-conventional processes, J. Hazard. Mater., 2011, 187, 24–36 CrossRef CAS PubMed.
- A. Loudiki, W. Boumya, H. Hammani, H. Nasrellah, Y. El Bouabi, M. Zeroual, A. Farahi, S. Lahrich, K. Hnini, M. Achak, M. Bakasse and M. A. El Mhammedi, Ibuprofen analysis in blood samples by palladium particles-impregnated sodium montmorillonite electrodes: validation using high performance liquid chromatography, Mater. Sci. Eng., C, 2016, 69, 616–624 CrossRef CAS PubMed.
- A. Patel, G. H. Panter, H. T. Trollope, Y. C. Glennon, S. F. Owen, J. P. Sumpter and M. R. Weaver, Testing the “read-across hypothesis” by investigating the effects of ibuprofen on fish, Chemosphere, 2016, 163, 592–600 CrossRef CAS PubMed.
- V. Matozzo, S. Rova and M. G. Marin, The nonsteroidal anti-inflammatory drug, ibuprofen, affects the immune parameters in the clam Ruditapes philippinarum, Mar. Environ. Res., 2012, 79, 116–121 CrossRef CAS PubMed.
- M. R. Sean and S. E. Cole, A toxicity and hazard assessment of fourteen pharmaceuticals to Xenopus laevis larvae, Ecotoxicology, 2006, 15, 647–656 CrossRef PubMed.
- J. O. Alissa, D. A. Lytle, S. Harmon, K. Vu, H. Chait and D. D. Dionysiou, Removal of strontium from drinking water by conventional treatment and lime softening in bench-scale studies, Water Res., 2016, 103, 319–333 CrossRef PubMed.
- M. J. Mckie, A. A. Susan and R. C. Andrews, Conventional drinking water treatment and direct biofiltration for the removal of pharmaceuticals and artificial sweeteners: a pilot-scale approach, Sci. Total Environ., 2016, 544, 10–17 CrossRef CAS PubMed.
- C. F. Lopez, J. M. G. Navarro, J. J. Padilla and J. R. Parsons, Comparison of the removal efficiencies of selected pharmaceuticals in waste water treatment plants in the region of Murcia, Spain, Ecological Engineering, 2016, 95, 811–816 CrossRef.
- V. Reguero, R. L. Fernandez, J. Fermoso, O. Prieto, P. Pocostales, R. Gonzalez, R. Irusta and S. Villaverde, Comparison of conventional technologies and a submerged membrane photocatalytic reactor (SMPR) for removing trihalomethanes (THM) precursors in drinking water treatment plants, Desalination, 2013, 330, 28–34 CrossRef CAS.
- N. G. Vaquero, E. Lee, R. J. Castaneda, J. Cho and J. A. L. Ramirez, Comparison of drinking water pollutant removal using a nanofiltration pilot plant powered by renewable energy and a conventional treatment facility, Desalination, 2014, 347, 94–102 CrossRef.
- S. Zhang, S. Gitungo, L. Axe, J. E. Dyksen and R. F. Raczko, A pilot plant study using conventional and advanced water treatment processes: evaluating removal efficiency of indicator compounds representative of pharmaceuticals and personal care products, Water Res., 2016, 105, 85–96 CrossRef CAS PubMed.
- Y. Chen, J. Vymazal, T. Brezinova, M. Kozeluh, L. Kule, J. Huang and Z. Chen, Occurrence, removal and environmental risk assessment of pharmaceuticals and personal care products in rural wastewater treatment wetlands, Sci. Total Environ., 2016, 566–567, 1660–1669 CrossRef CAS PubMed.
- D. Cheng, W. Gong and N. Li, Response surface modeling and optimization of direct contact membrane distillation for water desalination, Desalination, 2016, 394, 108–122 CrossRef CAS.
- E. Radaei, M. A. M. Reza and M. Arami, Removal of reactive blue 19 from aqueous solution by pomegranate residual-based activated carbon: optimization by response surface methodology, J. Environ. Health Sci. Eng., 2014, 12, 1–8 CrossRef PubMed.
- J. K. Im and K. D. Zoh, Application of response surface method to carbamazepine removal in photo-ozonation reaction under alkaline condition, Water Sci. Technol., 2013, 67, 74–80 CrossRef CAS PubMed.
- S. Selvakumar, R. Manivasagan and K. Chinnappan, Biodegradation and decolourization of textile dye wastewater using Ganoderma lucidum, 3 Biotech, 2013, 3, 71–79 CrossRef.
- N. Vieno, T. Tuhkanen and L. Kronberg, Removal of pharmaceuticals in drinking water treatment: effect of chemical coagulation, Environ. Technol., 2006, 27, 183–192 CrossRef CAS PubMed.
- W. Yang, Y. Wu, L. Zhang, J. Jiang and L. Feng, Removal of five selected pharmaceuticals by coagulation in the presence of dissolved humic acids and kaolin, Desalin. Water Treat., 2015, 54, 4–5 Search PubMed.
- A. Kumar and I. Xagoraraki, Human health risk assessment of pharmaceuticals in water: an uncertainty analysis for meprobamate, carbamazepine, and phenytoin, Regul. Toxicol. Pharmacol., 2010, 57, 146–156 CrossRef CAS PubMed.
- S. W. Nam, B. Jo, Y. Yoon and K. D. Zoh, Occurrence and removal of selected micropollutants in a water treatment plant, Chemosphere, 2014, 95, 156–165 CrossRef CAS PubMed.
- K. E. Pinkston and D. L. Sedlak, Transformation of aromatic ether- and amine-containing pharmaceuticals during chlorine disinfection, Environ. Sci. Technol., 2014, 38, 4019–4025 CrossRef.
Footnote |
| † Electronic supplementary information (ESI) available. See DOI: 10.1039/c6ra27733k |
|
| This journal is © The Royal Society of Chemistry 2017 |
Click here to see how this site uses Cookies. View our privacy policy here. 
 Open Access Article
 This Open Access Article is licensed under a
  ab,
Zulkifli Yusopb,
Jafariah Jaafar*a,
Azmi B. Arisbc and
Zaiton A. Majida
ab,
Zulkifli Yusopb,
Jafariah Jaafar*a,
Azmi B. Arisbc and
Zaiton A. Majida