 Open Access Article
Creative Commons Attribution 3.0 Unported Licence
Enhancement of hydrogen production of a Cu–TiO2 nanocomposite photocatalyst combined with broad spectrum absorption sensitizer Erythrosin B†
Piyong Zhang ,
Ting Song,
Tingting Wang and
Heping Zeng*
Key Laboratory of Functional Molecular Engineering of Guangdong Province, School of Chemistry and Chemical Engineering, South China University of Technology, Guangzhou, 510641, P. R. China. E-mail: hpzeng@scut.edu.cn; Fax: +86-20-87112631; Tel: +86-20-87112631
First published on 23rd March 2017
Abstract
A broad spectrum absorption photocatalytic system has been expected for a long time, especially for catalysts where the absorption mainly concentrates on the ultraviolet region, like TiO2. Here, dye sensitization was used to realize this expectation for TiO2. Anatase TiO2 was prepared by a hydrothermal method and then modified with Cu nanoparticles (NPs) by chemical reduction reaction. The highest H2 production rate was 3.33 mmol g−1 h−1 for Cu(3%)–TiO2 (content of Cu NPs was 3 wt%) and for pure TiO2 was only 0.356 mmol g−1 h−1. Next, the Cu(3%)–TiO2 photocatalyst was sensitized with various amounts of Erythrosin B (ErB) and the highest H2 production rate was 13.4 mmol g−1 h−1 with 3 mg of ErB in the photoreaction system. Under monochromatic light irradiation (500, 550, 600 and 650 nm), no photocatalytic activity was detected for Cu(3%)–TiO2 and some photocatalytic activities were obtained for sensitized Cu(3%)–TiO2, indicating that ErB sensitization can extend the visible light harvesting ability efficiently. Through photoelectrochemical analysis, electron–hole separation and transfer processes were promoted significantly by modification with Cu NPs and then sensitization by ErB. A possible ErB sensitization mechanism is proposed between ErB and Cu–TiO2 for the improvement of the photocatalytic activity.
1. Introduction
Enhancement of photocatalytic H2 production research from water reduction has attracted a lot of attention due to environmental pollution and increasing concerns about the global energy crisis. Numerous photocatalysts have been used for the H2 production from water including TiO2, g-C3N4, BiPO4 etc.1–14 TiO2 nanorods have many significant advantages originating from nano-scaled length and large specific surface area which are beneficial to improve photocatalytic activity.15 However, electron–hole recombination rate would be increased in nano-sized photocatalysts due to the confined space in nanorods.16 Incorporation of metals nanoparticles (NPs) as a co-catalyst is an effective method to improve photocatalytic activity.17–20 It is reported that copper NPs have drawn much attention because they can enhance the photocatalytic activity by preventing photoexcited electron–hole recombination and surface plasmon resonance (SPR) effect of Cu NPs.21–25During past years, dye sensitization had been an effective method to convert long wavelength light to energy for photocatalyst in photocatalytic reaction.26–30 Sensitizer molecule is excited and the state of triplet is formed under irradiation.28 Electrons are released from the state of triplet to the conduction band of semiconductor and then take part in photocatalytic reaction. Qin et al. reported that photocatalytic hydrogen production of Ag/g-C3N4 was improved by dye sensitization.31 Moreover, Wang et al. gave an enhancement of H2 production about carbon nitride nanosheets by ErB (molecular structure is shown in Fig. S1†) sensitization and the highest H2 production rate was 652.5 μmol h−1 which was 13.7 times of not sensitization.29 Therefore, dye sensitization is proved to be suitable for photocatalysis.26–30
Based on our researches,24,25,31,32 Cu–TiO2 nanocomposites were prepared and the photocatalytic activity of H2 production was investigated. Then Cu–TiO2 nanocomposites sensitized by photoexcited ErB and their H2 production rate was also researched at same condition. Furthermore, photocatalytic hydrogen production was investigated for Cu–TiO2 and sensitized Cu–TiO2 system under different wavelength monochromatic light irradiation. Persistent photocatalytic activities of Cu–TiO2 and dye-sensitized Cu–TiO2 were studied with several recycles and a possible photocatalytic mechanism was preliminarily discussed.
2. Experimental
2.1. Materials
All reagents were analytical grade and used without further purification. Deionized water was used in all experiments. Tetrabutyl titanate (Ti(OC4H9)4), copper nitrate trihydrate (Cu(NO3)2·3H2O AR), ethanol (AN, analytical grade) and HF were purchased from Sinopharm Chemical Reagent Co. Ltd., P. R. China. Sodium borohydride (NaBH4), triethanolamine and Erythrosin B (ErB) were purchased from Aladdin Chemistry Co. Ltd.2.2. Synthesis of TiO2 nanorods
Anatase TiO2 nanorods were prepared by hydrothermal method.14 10 mL of hydrofluoric acid solution (40 wt%) was added into 75 mL of Ti(OC4H9)4 under stirring at room temperature for 30 min and the light yellow solution was obtained. The solution was transferred into a Teflon-lined autoclave with a 150 mL capacity, heated to and kept at 180 °C for 20 h. After hydrothermal reaction, the obtained white precipitate was harvested by centrifugation at 10![[thin space (1/6-em)]](https://www.rsc.org/images/entities/char_2009.gif) 000 rpm for 20 min and washed with ethanol and deionized water for 3 times, respectively. The residues were dried in vacuum drying oven at 50 °C for 3 h, and subsequently ground into fine powders using an agate mortar.
000 rpm for 20 min and washed with ethanol and deionized water for 3 times, respectively. The residues were dried in vacuum drying oven at 50 °C for 3 h, and subsequently ground into fine powders using an agate mortar.
2.3. Preparation of Cu NPs modified TiO2 nanorods
The Cu–TiO2 nanocomposites were synthesized by chemical reduction method. Typically, 10 mg TiO2 nanorods were dispersed into deionized water under vigorous stirring, and 1–6.0 mL of 50 mM Cu(NO3)2 solutions was added into the TiO2 nanorods suspensions. The suspension was equilibrated for 60 min, and then 2–12 mL fresh prepared 50 mM NaBH4 solution was added and stirred for another 60 min in ice bath. The obtained Cu–TiO2 nanorods were harvested by centrifugation at 10![[thin space (1/6-em)]](https://www.rsc.org/images/entities/char_2009.gif) 000 rpm for 20 min and washed with ethanol and deionized water for 3 times. The whole processes were carried out under nitrogen protection. The residues were dried at 50 °C under condition of vacuum for 4 h, and subsequently ground into fine powders using an agate mortar. The reduction mechanism is shown in eqn (1). TiO2 nanorods loaded with different amounts of Cu NPs, which were denoted as TiO2 (pure TiO2 nanorods), Cu(1%)–TiO2 (content of Cu NPs is 1 wt% in theory), Cu(2%)–TiO2 (content of Cu NPs is 2 wt% in theory), Cu(3%)–TiO2 (3 wt%), Cu(4%)–TiO2 (4 wt%), Cu(5%)–TiO2 (5 wt%). Cu NPs was synthesized by the same processes for Cu–TiO2 nanocomposites except the existence of TiO2.
000 rpm for 20 min and washed with ethanol and deionized water for 3 times. The whole processes were carried out under nitrogen protection. The residues were dried at 50 °C under condition of vacuum for 4 h, and subsequently ground into fine powders using an agate mortar. The reduction mechanism is shown in eqn (1). TiO2 nanorods loaded with different amounts of Cu NPs, which were denoted as TiO2 (pure TiO2 nanorods), Cu(1%)–TiO2 (content of Cu NPs is 1 wt% in theory), Cu(2%)–TiO2 (content of Cu NPs is 2 wt% in theory), Cu(3%)–TiO2 (3 wt%), Cu(4%)–TiO2 (4 wt%), Cu(5%)–TiO2 (5 wt%). Cu NPs was synthesized by the same processes for Cu–TiO2 nanocomposites except the existence of TiO2.
 | (1) |
2.4. Material characterization
X-ray diffraction (XRD) patterns were recorded on a D8 X-ray diffractometer (Bruker AXS, German). The UV-Vis diffuse reflection absorption spectra (UV-Vis/DR spectra) were recorded by a UV-Vis spectrometer (U3010, Hitachi, Japan) equipped with an integrating sphere accessory in the diffuse reflectance mode (R), and referenced by BaSO4. The Brunauer–Emmett–Teller (BET) specific surface area of samples were evaluated on the basis of nitrogen adsorption isotherms measured at 77 K using a 3H-2000PS1 static volume method instrument. The analysis of photo-luminescence spectra (PL) were carried out at room temperature on a Hitachi F-4500 fluorescence spectrophotometer. Transmission electron microscope (TEM) images were obtained on a JEOL JEM-2100 electron microscope with an accelerating voltage of 200 kV equipped with energy dispersive X-ray (EDX) spectrometer. X-ray photoelectron spectroscopy (XPS) data were obtained on a Kratos Axis-Ultra DLD (with AES) instrument with a monochromatized Al Kα line source (150 W). Inductively coupled plasma atomic emission spectrometry (ICP-AES) data were obtained by Prodigy ICP-AES (American LEEMAN-LABS INC.). Raman spectra were obtained by Laser Confocal Raman Microscopy system (LabRAM Aramis, H.J.Y, France).2.5. Photocatalytic hydrogen production
Photocatalytic experiments were performed in a 300 mL flask, using a 300 W Xe lamp to simulated sunlight without any wavelength filter. The intensity of light source was estimated to be 0.15 W cm−2. 5 mg of catalyst was dispersed into a solution mixture of 70 mL water containing 10 vol% triethanolamine by ultrasonication for 20 min. Triethanolamine was used as sacrificial reagent. The reaction flask was kept at about 25 °C by a cooling water jacket. Hydrogen gas production was measured by gas chromatography with a thermal conductivity detector (GC-7900, Tian mei, nitrogen as a carrier gas with a 5 Å molecular sieve column). Then, Cu(3%)–TiO2 was chosen for dye sensitization experiments. 5 mg Cu(3%)–TiO2 and various amount (1, 3, 5, 10, 15 mg) of ErB were dispersed into 70 mL solution containing 10 vol% triethanolamine under stirring for 40 min to form a homogenous solution. Sensitization experiments are also performed under sunlight. Hydrogen gas production was measured as above. 650, 600, 550 and 500 nm wavelength band pass filters were installed on xenon lamp for monochromatic light photocatalytic experiment and other experimental conditions remain unchanged. Bandwidth of band pass filters were 650 ± 10, 600 ± 10, 550 ± 10 and 500 ± 10 nm. The Cu–TiO2/ErB samples were obtained through centrifugation of reaction solution at 10![[thin space (1/6-em)]](https://www.rsc.org/images/entities/char_2009.gif) 000 rpm for 20 min when they were characterized.
000 rpm for 20 min when they were characterized.
2.6. Photoelectrochemical measurements
Electrochemical measurements were conducted with electrochemical analyzer (CHI660C Instruments, Shanghai, China) in a conventional three electrode cell, using a Pt plate as counter electrode and an Ag/AgCl electrode (3 M KCl) as reference electrode. The electrolyte was 0.1 M Na2SO4 aqueous solution without additive. The working electrode was prepared on indium-tin oxide (ITO) glass that was cleaned by sonication in ethanol for 30 min and dried at 323 K. The boundary of ITO glass was protected using Scotch tape. 5 mg sample was dispersed in 1 mL of DMF by sonication to get a slurry mixture. The slurry was spread onto pretreated ITO glass. After vacuum-drying, the working electrode was further dried at 353 K for 2 h to improve adhesion. Then, the Scotch tape was unstuck, and the uncoated part of the electrode was isolated with epoxy resin. Sunlight was used in photocurrent response.2.7. Adsorption amount of ErB on Cu(3%)–TiO2
Adsorption amounts of ErB on Cu(3%)–TiO2 were determined in a similar method as described in ref. 33. 5 mg Cu(3%)–TiO2 and various amounts (1, 3, 5, 10, 15 mg) of ErB were dispersed into 70 mL solution containing 10 vol% triethanolamine under stirring for 5 h to form a homogenous solution. After 5 h stirring, Cu(3%)–TiO2 was removed by centrifugation. The concentration of ErB left in the solution was measured on a Hitachi U-3310 spectrophotometer at 521 nm. The concentration change before and after the adsorption was determined to calculate the adsorption amount of ErB on Cu(3%)–TiO2.3. Results and discussions
3.1. Formation and characterization
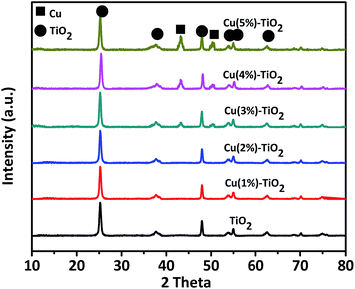
The XRD patterns of the prepared Cu–TiO2 composites and the pure TiO2 nanorods are shown in Fig. 1. The main diffraction peaks at 25.3° (101), 37.8° (004), 48.1° (200), 54.0° (105), and 55.1° (211) are observed in the patterns corresponding to the TiO2 anatase crystalline phase (JCPDS 21-1272).34 The other diffraction peaks match well with the reference Cu (JCPDS 85-1326).24 In addition, the corresponding oxide compounds (CuxOy) are not observed. XRD technique does not detect normally metallic concentrations under 3 wt%. So Cu(1%)–TiO2, Cu(2%)–TiO2 and Cu(3%)–TiO2 have few peaks for Cu NPs compared with Cu(4%)–TiO2 and Cu(5%)–TiO2. It can also be inferred from Fig. 1 that the crystalline form of anatase has not been changed by modification with Cu NPs. For Cu–TiO2 composites, the XRD patterns reveal a coexistence of TiO2 and Cu NPs.Fig. 2a shows UV-Vis diffuse reflectance spectra of pure TiO2 nanorods and Cu–TiO2 composites. The absorption band edge at 392 nm is attributed to the band gap transition of TiO2 nanorods.34,35 For Cu NPs-loaded photocatalysts, a great increase is observed in the absorption at wavelength longer than 400 nm, which can be attributed to SPR peak of plasmonic Cu NPs.36 The broadening of the SPR peak can be explained as follows. Firstly, aggregation of Cu NPs can broaden the SPR peak. If metal NPs are aggregated, neighboring NPs induce a destructive interference of the plasmon resonance and broaden the absorption peak.37 Secondly, NPs attach to other particles, showing broader plasmon peaks than isolated NPs.38 Cu NPs are not dispersed in the solution but are loaded on TiO2 nanorods, thereby leading to a broadening of the plasmon peak. Due to the broadening of the SPR peak, a large portion of visible light spectrum can be utilized for the photocatalytic H2 production of the Cu–TiO2. The absorption intensity increases gradually with increase of plasmonic Cu NPs, suggesting that modification with more Cu NPs (under wt 5%) on the surface could enhance visible light capture due to principle of superposition about Cu NPs. It can also illustrate that Cu particles which are loaded on surface of TiO2 are nanoparticles, because nubbly Cu don't possess SPR effect. The band gaps of TiO2 and Cu–TiO2 were estimated from the Tauc plot and the results are shown in Fig. S2.†
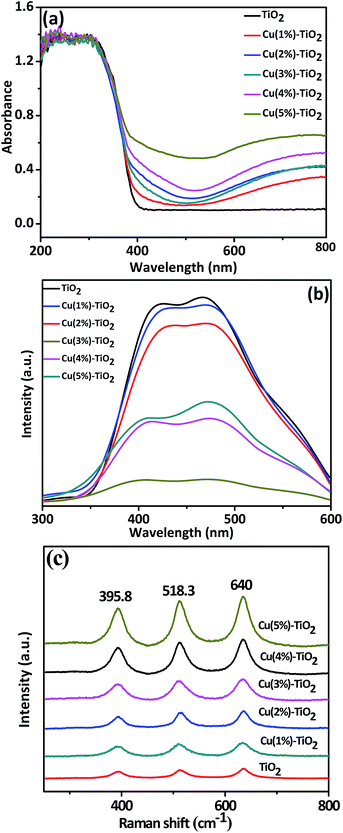 | ||
| Fig. 2 (a) UV-Vis diffuse reflectance spectra, (b) photo-luminescence spectra (λexcitation = 300 nm), (c) Raman spectra of pure TiO2 and Cu–TiO2 composites with different amounts of Cu. | ||
Photo-luminescence (PL) spectroscopy has been widely used to examine the charge separation and migration in photocatalysts.39 As shown in Fig. 2b, the PL emission intensity exhibits the highest value for pure TiO2 and decrease with loading Cu NPs on the surface of TiO2. This indicates that recombination of photogenerated charge carriers is inhibited in the photocatalysts due to charge transfer at the interfaces, with driving force originated from the co-catalyst of Cu NPs.40 Although PL emission intensity decreases with presence of Cu NPs, content of 3% is the optimal deposition amount to suppress recombination because its PL intensity is the smallest indicating the most efficient charge separation. As content of Cu NPs increases to certain degree, Cu NPs aggregate on the surface of TiO2 and become recombination centers to decrease suppression.41
Laser Raman spectra of pure TiO2 and Cu–TiO2 composites are shown in Fig. 2c. Three Raman bands of composites which appear at 640, 518.3 and 395.8 cm−1 in Fig. 2c are assigned to anatase TiO2 (ref. 42) and no band for Cu NPs because it is not responsive in Raman spectra.42 Compared with pure TiO2, the stepwise enhanced three bands indicate existence of surface-enhanced Raman scattering (SERS) effect of Cu NPs with appropriate shape and size. As we all know, one important factor which arises SERS signal enhancement is charge transfer between the molecular and metal because of excitations.43 So this result could also demonstrate that an interaction exists between Cu and TiO2 molecules to facilitate charge transfer. It is important to note that Cu(5%)–TiO2 which has the strongest peak doesn't mean the best charge transfer, because SERS signal enhancement induces mainly from two mechanisms:44–46 (1) excitations in the metal NPs lead to enhance local electromagnetic fields, and (2) resonance enhancements due to charge transfer between metal NPs and molecule because of excitations. So this result and PL spectra aren't contradictory.
The microstructure of Cu(3%)–TiO2 was investigated by TEM. The low-magnification TEM image (Fig. 3a) shows the rod morphology of as-synthesized composites, demonstrating the nanorods of anatase TiO2 were obtained. From the high-resolution TEM (HRTEM) image of Cu(3%)–TiO2 (Fig. 3b), two phases of Cu and TiO2 are clearly observed and closely contact to form an intimate interface. The interlayer distance of 0.35 nm corresponds well with (101) plane of TiO2 while 0.21 nm is consistent with the lattice fringe about (111) plane of Cu. From energy-dispersive X-ray spectroscopy (EDX) spectrum (Fig. 3c) and elemental mapping pattern (Fig. 3d), we can see the existence of Ti, O, Cu. These observations suggest the formation of Cu–TiO2 composite and an excellent photocatalytic performance should be expected. In addition, the dark-field of TEM image (Fig. 3e) reveals that Cu NPs are well dispersed on the TiO2 nanorods surface with a mean particle size of 5.9 nm and size distribution of Cu NPs is shown in Fig. 3f. Particle size of Cu NPs is found to be 3–10 nm, showing that the synthesis method used in our work is effective for the preparation of Cu NPs with homogeneous particle size distribution.
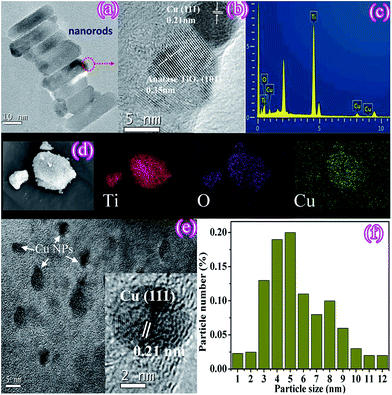 | ||
| Fig. 3 TEM (a), HRTEM (b), EDX spectrum (c), elemental mapping patterns (d), HRTEM (e) and size distribution (f) of Cu particles. | ||
XPS spectral were carried out to determine the chemical composition of Cu(3%)–TiO2 and the results are shown in Fig. 4. The binding energies which obtained in the XPS analysis were corrected by referencing C 1s to 284.8 eV with specimen charging. Fig. 4a indicates the presence of Ti, O and Cu in the composite. High-resolution XPS spectra of Ti 2p (Fig. 4b) at 458.4 and 464.0 eV are attributed to Ti 2p3/2 and 2p1/2.47 The curve fitting of O 1s spectra (Fig. 4c) basically indicates two components center at 529.7 and 531.5 eV in Cu(3%)–TiO2 hybrid which are attributed to lattice oxygen and hydroxyl radicals.48 Fig. 4d shows the characteristic peaks of the Cu 2p at 932.6 and 952.8 eV which are attributed to the binding energy of Cu 2p3/2 and Cu 2p1/2, respectively. Peaks are assigned to Cu2O or Cu (Cu1+ or Cu0) due to absence of satellite structure (Fig. 4d). However, it is difficult to differentiate Cu2O and Cu by the XPS feature of Cu 2p3/2 and Cu 2p1/2 because their binding energies are very close. According to previous reports,49,50 Cu LMM peak region provides a clear means to distinguish the two oxidation states: the main LMM peaks of kinetic energy for Cu0 and Cu2O are located at 921 eV and 918 eV, respectively. Fig. 4e shows that the Cu LMM peak of the sample occurs at 921.1 eV. It indicates that composites contain Cu, which can also be proved by XRD patterns. Surface element composition of Cu(3%)–TiO2 determined by XPS and it is shown in Table S1.† Elemental concentration is consistent with theoretical calculation.
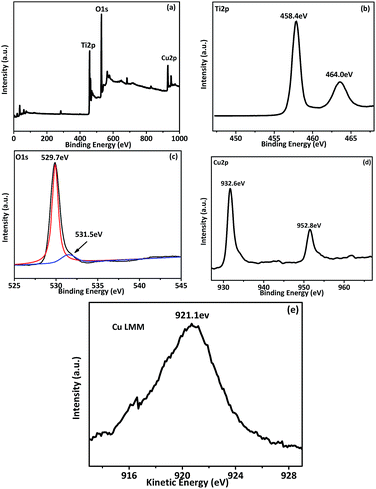 | ||
| Fig. 4 XPS spectral of Cu(3%)–TiO2; (a) survey spectrum, (b) Ti 2p, (c) O 1s, (d) Cu 2p and (e) Cu LMM. | ||
Table 1 summarizes surface properties of different Cu-loaded TiO2 systems. The theoretical and experimental (determined by EDX and ICP-AES) Cu content is similar in all prepared Cu–TiO2 nanocomposites. The content determined by EDX is relative lower than ICP-AES and this phenomenon could be attributed to the difference of two detection methods. EDX is surface analysis and ICP-AES is bulk analysis. The BET specific surface area (SBET) and pore structure of the as-prepared samples were investigated using adsorption–desorption measurements and results are shown in Table 1. It can be seen that Cu(3%)–TiO2 shows the highest SBET among the six samples and this phenomenon can be explained as follows. Cu NPs are smaller than TiO2 nanorods when content of Cu is tiny and these Cu NPs load on the surface of TiO2 resulting in surface area increase. As content of Cu increases gradually, Cu NPs could aggregate into bigger nanoparticles which have opposite effect. Larger surface area of the nanocomposites can supply more surface active sites and make charge carrier transport easier, resulting in an enhancement of the photocatalytic hydrogen production.51 In the meantime, the average pore diameters of the samples were analyzed from the Barrett–Joyner–Halenda (BJH) pore size distribution. A hysteresis loop type of plot (Fig. S3†) is usually associated with the filling and emptying of the mesoporous pores by capillary condensation and this hysteresis illustrates the distribution of a bottleneck in the pore structure.52 These mesoporous pores permit a quick dispersion of a variety of reactants and products through the photocatalytic reaction to improve the photocatalytic activity.53 As shown in Table 1, average pore diameter and pore volume have a slight decrease because Cu NPs load inside the pore. Summarily, the results discussed above indicate that the nanocomposites of Cu–TiO2 are successfully prepared by a simple hydrothermal process followed by chemical reduction method.
| Sample | SBET (m2 g−1) | Average pore size (nm) | Pore volume (cm3 g−1) | Cu/Ti from EDXa | Cu/Ti from ICP-AESa |
|---|---|---|---|---|---|
| a Cu/Ti is the ratio of two masses. | |||||
| TiO2 | 68.73 | 11.63 | 0.213 | — | — |
| Cu(1%)–TiO2 | 78.25 | 10.29 | 0.200 | 0.00498 | 0.00534 |
| Cu(2%)–TiO2 | 77.17 | 10.56 | 0.191 | 0.01020 | 0.01074 |
| Cu(3%)–TiO2 | 80.26 | 10.05 | 0.179 | 0.01872 | 0.01932 |
| Cu(4%)–TiO2 | 75.66 | 9.88 | 0.170 | 0.02394 | 0.02322 |
| Cu(5%)–TiO2 | 65.56 | 9.52 | 0.168 | 0.03012 | 0.03138 |
3.2. Photocatalytic hydrogen production
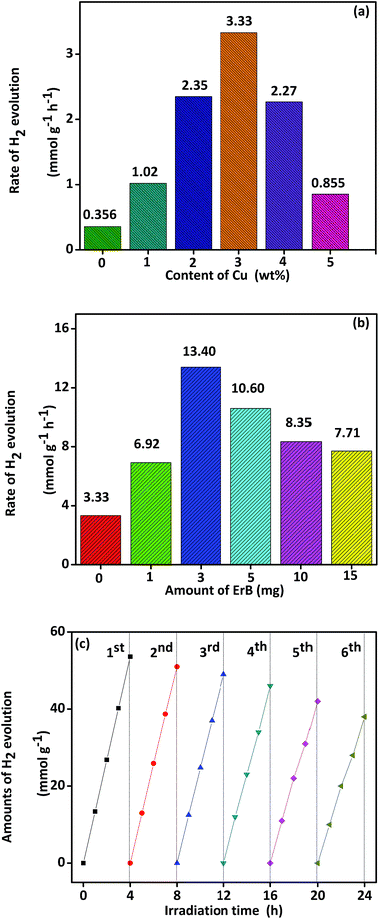
The actual photocatalytic activities for hydrogen production of nanocomposites have been evaluated in aqueous solution with triethanolamine used as sacrificial reagent under solar light irradiation. Control experiments were carried out and no appreciable H2 production was detected in the absence of photocatalyst or irradiation, indicating that H2 was produced on a photocatalyst with irradiation. As shown in Fig. 5a, average H2 production rates of all the composites are higher than pure TiO2 nanorods, which denotes that the modification with Cu NPs could improve photocatalytic ability of TiO2. Photocatalytic activity increases stepwise from Cu(1%)–TiO2, Cu(2%)–TiO2 and then the highest value (3.33 mmol g−1 h−1) for Cu(3%)–TiO2. Compared with Cu(3%)–TiO2, Cu(4%)–TiO2 and Cu(5%)–TiO2 show slow decrease with further increase of Cu NPs content. This result implies that suitable mass ratio of Cu NPs could form an efficient interface between two components, and thus increase photocatalytic reaction rate. On the contrary, unsuitable mass ratio would make an agglomerating state, thus reducing photocatalytic ability.54–57 When Cu loading content exceeds 3%, Cu NPs will aggregate on the surface of TiO2 and become recombination centers of electron–hole.44 TEM imagine of Cu loading content at 4% was investigated and agglomerating state was observed in Fig. S4.†Repeatability of Cu(3%)–TiO2 was tested in six consecutive runs of accumulatively 24 h under the same conditions and the result is shown in Fig. S5.† Crystal structure and surface property of Cu(3%)–TiO2 before and after repeatability test are characterized by XRD patterns (Fig. S6a†), XPS (Fig. S6b–d†) spectra and surface element composition (Table S2†). Moreover, photocatalytic ability comparison was performed between Pt–TiO2 and Cu–TiO2 and the results are shown in Fig. S7.†
In the dye sensitization experiments, Erythrosin B (ErB) was selected to sensitize Cu(3%)–TiO2 due to its absorption of light with long wavelength. As shown in Fig. 5b, the highest H2 production rate is obtained (13.4 mmol g−1 h−1) when 3 mg ErB is added in solution. However, with amount of ErB increases further, the H2 production rates decrease indicating superfluous ErB have an opposite effect on photocatalytic activity due to adsorption of ErB on catalyst. Adsorption of ErB on catalyst was investigated and the results are shown in Table S3.† When adsorption of ErB reaches saturation, some incident light is absorbed by superfluous ErB molecules in the suspension but could not involve in the charge transfer to catalyst. Superfluous ErB makes light utility efficiency decrease which results in reducing the photocatalytic activity.28 In addition, the repeatability of Cu(3%)–TiO2 with 3 mg ErB (marked as Cu(3%)–TiO2/ErB-3 mg) was tested in six consecutive runs of accumulatively 24 h under the same conditions (Fig. 5c). After six recycling tests, decrease of H2 production occurs upon repeatability use, implying that it exhibits slow attenuation. This phenomenon is mainly attributed to the photobleaching of ErB and consumption of TEOA as electron donors. Fortunately, this attenuation is very slow and still keeps 75% H2 production rate after 24 h. Cu(3%)–TiO2/ErB-3 mg was characterized by FTIR (Fig. S8a†), XPS (Fig. S8b†) spectra and surface element composition (Table S4†) before and after recycling tests. There are no obvious changes in locations of the peaks or elemental concentration, suggesting that it has considerable photostability. Furthermore, apparent quantum efficiency of photocatalysts was supplied and the results are shown in Table S5.†
Wavelength-dependent H2 production was investigated with different wavelength monochromatic light. No H2 was detected for sample Cu(3%)–TiO2 owing to its little response when wavelength longer than 500 nm (Fig. 6a). For sample Cu(3%)–TiO2/ErB-3 mg, H2 production trend (Fig. 6b) matches well with the absorption spectral (Fig. 6a), indicating that the H2 production is primarily driven by light-excitation electrons in ErB when wavelength longer than 500 nm. This result could also prove that ErB sensitization is efficient for Cu(3%)–TiO2 and can extend the light harvesting ability (to 600 nm) efficiently. In order to further improve research, TiO2 and Cu NPs photocatalytic H2 production were investigate with ErB sensitization under sunlight irradiation and the results are shown in Fig. S9.†
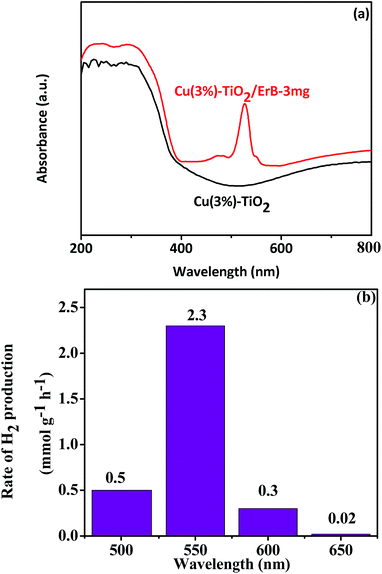 | ||
| Fig. 6 (a) UV-Vis diffuse reflectance spectra of Cu(3%)–TiO2 and Cu(3%)–TiO2/ErB-3 mg, (b) photocatalytic H2 production of Cu(3%)–TiO2/ErB-3 mg with monochromatic light irradiation. | ||
In order to further improve the experiment, a comparison with other systems was investigated. Firstly, fluorescein dye was used as sensitizer for Cu–TiO2 and comparison of hydrogen production are shown in Fig. S10.† Hydrogen production of ErB system is slight higher than fluorescein system due to their different structures. Secondly, hydrogen production of Au–TiO2 and Ag–TiO2 were also investigated with the sensitizer ErB and results are shown in Fig. S11.† Rate of hydrogen production order is Au > Ag ≈ Cu.
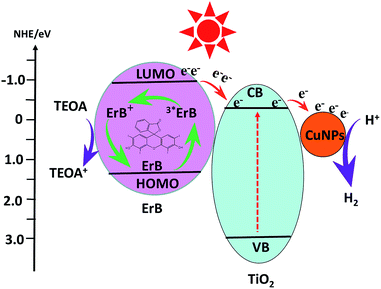
3.3. Mechanism
A possible mechanism of H2 production over ErB sensitized Cu–TiO2 photocatalyst is proposed and illustrated in Fig. 7. Before this, we should illustrate that the conduction band (CB) and valence band (VB) edge potentials of TiO2 are at −0.27 eV and 2.89 eV,8 respectively. Meanwhile, the LUMO and HOMO potentials of ErB are about −0.9 and 1.4 eV vs. NHE.27 Therefore, the charge transfer is thermodynamically favourable from the photoinduced ErB dye to TiO2, and then to Cu NPs for H2 production. In aqueous solution with presence of ErB, ErB molecule is excited and the state of triplet 3*ErB is formed under irradiation.28 Electrons are released from 3*ErB to the CB of TiO2 and then to the Cu nanoparticles which results in reducing the bonded H+, leading to H2 production. Due to the collective oscillations of the surface electrons,58 SPR effect of Cu NPs will happen which can enhance the rapid capture and steady transportation of photo-generated electrons, making them react with H+ for H2 production more easily.31,59 In addition, a Schottky barrier is created on Cu nanoparticles by accumulation of electrons that could prevent recombination of photo-generated electrons and holes. Meanwhile, the 3*ErB becomes oxidized ErB+ and then it is reduced back to ErB by sacrificial reagent triethanolamine.The photocatalytic activities of catalysts for hydrogen production are mainly influenced by the effective separation and transportation of electron–hole pairs.25,31 In order to illustrate it, additional evidences for above analysis results are provided. Fig. 8a shows the photocurrent–time curves of samples with five on–off intermittent solar light irradiation cycles. Apparently, the photocurrent value rapidly decreases to zero as soon as light is turned off, and then increases and remains constant when light is turned on again, exhibiting good repeatability. The photoelectrode of Cu(3%)–TiO2/ErB-3 mg shows the highest value than others and this indicates the smallest recombination and most efficient carrier separation at the interface of Cu(3%)–TiO2/ErB-3 mg. More efficient carrier separation is beneficial to photocatalytic hydrogen production. In addition, composites were evaluated by electrochemical impedance spectra (EIS) and an evidently decreased EIS radius (Fig. 8b) is revealed for catalysts. This suggests reduced electronic impedance, improved charge separation and enhancement of photocatalytic ability. Actually, all of the electrochemical experiments illustrate that the efficient carrier separation of the TiO2 loaded with Cu and then sensitized by ErB are enhanced stepwise.
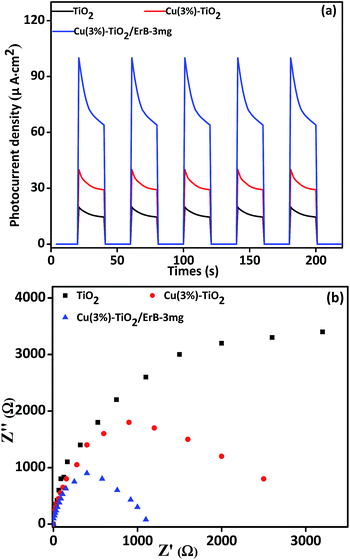 | ||
| Fig. 8 (a) Photocurrent response under solar light irradiation and (b) electrochemical impedance spectroscopy plots of TiO2, Cu(3%)–TiO2 and Cu(3%)–TiO2/ErB-3 mg. | ||
In order to confirm ErB dye molecules contact with Cu(3%)–TiO2 which dominates photocatalytic H2 production, FTIR, XRD, UV-Vis and photo-luminescence (PL) spectra were investigated and the results are shown in Fig. S12.† Moreover, the morphology comparison of Cu(3%)–TiO2 and Cu(3%)–TiO2/ErB-3 mg were researched by TEM and the images are shown in Fig. S13.† Elemental mapping pattern of Cu(3%)–TiO2/ErB-3 mg is shown in Fig. S14† and it shows the same conclusion with EDX in Fig. S13.†
4. Conclusions
In summary, a novel photocatalyst of Erythrosin B sensitized Cu–TiO2 nanocomposites were designed, synthesized and characterized. The photocatalytic H2 production activity was enhanced significantly after loading with Cu NPs and then sensitization by Erythrosin B. In addition, photocatalytic hydrogen production of Cu(3%)–TiO2 and Cu(3%)–TiO2/ErB-3 mg were evaluated under different wavelength (500, 550, 600 and 650 nm) monochromatic light irradiation. Only Cu(3%)–TiO2/ErB-3 mg has photocatalytic activity which can be attributed to the charge transfer from the photo-excited ErB dye to TiO2. In addition to achieve the highest activity of Cu–TiO2 and dye-sensitized Cu–TiO2 photocatalysts, we demonstrated that Cu–TiO2 and dye-sensitized Cu–TiO2 have sustained activity after six recycling tests. Moreover, the photocatalytic mechanism was preliminarily discussed. This work may be significant to provide an approach to develop a dye sensitization strategy to improve photocatalytic activity.Acknowledgements
We are grateful to the National Natural Science Foundation of China (No. 21571064, 21371060) and the research fund of the Key Laboratory of Fuel Cell Technology of Guangdong Province for financial support.Notes and references
- Y. Wang, H. Sun, S. Tan, H. Feng, Z. Cheng, J. Zhao, A. Zhao, B. Wang, Y. Luo, J. Yang and J. G. Hou, Nat. Commun., 2013, 4, 2214 Search PubMed.
- P. Zhang, T. Wang and H. Zeng, Appl. Surf. Sci., 2017, 391, 404 CrossRef CAS.
- Y. F. Zhang, M. Park, H. Y. Kim, M. El-Newehy, K. Y. Rhee and S. J. Park, Composites, Part B, 2015, 80, 355 CrossRef CAS.
- Y. F. Zhang, M. Park, H. Y. Kim, B. Ding and S. J. Park, Appl. Surf. Sci., 2016, 384, 192 CrossRef CAS.
- C. Lu, Z. Bao, C. Qin, L. Dai and A. Zhu, RSC Adv., 2016, 6, 110155 RSC.
- Y. F. Zhang, M. Park, H. Y. Kim and S. J. Park, J. Alloys Compd., 2016, 686, 106 CrossRef CAS.
- J. W. Hong, D. H. Wi, S. Lee and S. W. Han, J. Am. Chem. Soc., 2016, 138, 15766 CrossRef CAS PubMed.
- Q. Fu, X. Wang, C. Li, Y. Sui, Y. Han, Z. Lv, B. Song and P. Xu, RSC Adv., 2016, 6, 108883 RSC.
- L. Yuan, C. Han, M. Yang and Y. Xu, International Reviewers in Physical Chemistry, 2016, 35, 1 CrossRef CAS.
- M. Yang, C. Han and Y. Xu, J. Phys. Chem. C, 2015, 119, 27234 CAS.
- N. Zhang, C. Han, Y. Xu, J. J. Foley IV, D. Zhang, J. Codrington, S. K. Gray and Y. Sun, Nat. Photonics, 2016, 10, 473 CrossRef CAS.
- S. Liu, C. Han, Z. Tang and Y. Xu, Mater. Horiz., 2016, 3, 270 RSC.
- H. Yu, R. Shi, Y. Zhao, G. I. N. Waterhouse, L. Z. Wu, C. H. Tung and T. Zhang, Adv. Mater., 2016, 28, 9454 CrossRef CAS PubMed.
- X. Wang, D. Baiyila and X. Li, RSC Adv., 2016, 6, 107233 RSC.
- F. Amano, O. O. Prieto-Mahaney, Y. Terada, T. Yasumoto, T. Shibayama and B. Ohtani, Chem. Mater., 2009, 21, 2601 CrossRef CAS.
- N. Murakami, Y. Kurihara, T. Tsubota and T. Ohno, J. Phys. Chem. C, 2009, 113, 3062 CAS.
- K. Zhao, H. Liu, T. Wang and H. Zeng, J. Mater. Sci.: Mater. Electron., 2016, 27, 5183 CrossRef CAS.
- J. Fang, S. W. Cao, Z. Wang, M. M. Shahjamali, S. C. J. Loo, J. Barber and C. Xue, Int. J. Hydrogen Energy, 2012, 37, 17853 CrossRef CAS.
- A. Ramchiary and S. K. Samdarshi, Appl. Surf. Sci., 2014, 305, 33 CrossRef CAS.
- S. Yang, H. Wang, H. Yu, S. Zhang, Y. Fang, S. Zhang and F. Peng, Int. J. Hydrogen Energy, 2016, 41, 3446 CrossRef CAS.
- J. Fei and J. Li, Adv. Mater., 2015, 27, 314 CrossRef CAS PubMed.
- P. Zhang, T. Song, T. Wang and H. Zeng, Appl. Catal., B, 2017, 206, 328 CrossRef CAS.
- E. Z. Liu, L. L. Qi, J. J. Bian, Y. H. Chen, X. Y. Hu, J. Fan, H. C. Liu, C. J. Zhu and Q. P. Wang, Mater. Res. Bull., 2015, 68, 203 CrossRef CAS.
- H. Y. Liu, T. T. Wang and H. P. Zeng, Part. Part. Syst. Charact., 2015, 32, 869 CrossRef CAS.
- J. P. Huo and H. P. Zeng, J. Mater. Chem. A, 2015, 3, 17201 CAS.
- A. Hagfeldt, G. Boschloo, L. Sun, L. Kloo and H. Pettersson, Chem. Rev., 2010, 110, 6595 CrossRef CAS PubMed.
- Z. Y. Li, Y. L. Fang, X. Q. Zhan and S. Xu, J. Alloys Compd., 2013, 564, 138 CrossRef CAS.
- Y. P. Yuan, L. S. Yin, S. W. Cao, G. S. Xu, C. H. Li and C. Xue, Appl. Catal., B, 2015, 168–169, 572 CrossRef CAS.
- Y. Wang, J. D. Hong, W. Zhang and R. Xu, Catal. Sci. Technol., 2013, 3, 1703 CAS.
- J. Y. Xu, Y. X. Li and S. Q. Peng, Int. J. Hydrogen Energy, 2015, 40, 353 CrossRef CAS.
- J. Y. Qin, J. P. Huo, P. Y. Zhang, J. Zeng, T. T. Wang and H. P. Zeng, Nanoscale, 2016, 8, 2249 RSC.
- J. P. Huo and H. P. Zeng, J. Mater. Chem. A, 2015, 3, 6258 CAS.
- J. Xu, Y. Li, S. Peng, G. Lu and S. Li, Phys. Chem. Chem. Phys., 2013, 15, 7657 RSC.
- Y. L. Tian, B. B. Chang, J. Fu, B. C. Zhou, J. Y. Liu, F. N. Xi and X. P. Dong, J. Solid State Chem., 2014, 212, 1 CrossRef CAS.
- J. P. Huo, L. T. Fang, Y. L. Lei, G. C. Zeng and H. P. Zeng, J. Mater. Chem. A, 2014, 2, 11040 CAS.
- K. Dai, L. H. Lu, C. H. Liang, Q. Liu and G. P. Zhu, Appl. Catal., B, 2014, 156–157, 331 CrossRef CAS.
- G. Collins and J. D. Holmes, Adv. Mater., 2016, 28, 5689 CrossRef CAS PubMed.
- J. Pal, A. K. Sasmal, M. Ganguly and T. Pal, J. Phys. Chem. C, 2015, 119, 3780 CAS.
- M. V. Dozzi, A. Saccomanni, M. Altomare and E. Selli, Photochem. Photobiol. Sci., 2013, 12, 596 Search PubMed.
- L. Lin, F. Weniger, H. Neumann and M. Beller, Angew. Chem., Int. Ed., 2016, 55, 12582 CrossRef PubMed.
- S. H. Shen, P. H. Guo, L. Zhao, Y. C. Du and L. J. Guo, J. Solid State Chem., 2011, 184, 2250 CrossRef CAS.
- J. Zhang, M. Zhang, R. Q. Sun and X. C. Wang, Angew. Chem., Int. Ed., 2012, 124, 10292 CrossRef.
- E. Z. Liu, L. M. Kang, Y. H. Yang, T. Sun, X. Y. Hu, C. J. Zhu, H. C. Liu, Q. P. Wang, X. H. Li and J. Fan, Nanotechnology, 2014, 25, 165401 CrossRef PubMed.
- J. L. Cao, G. S. Shao, T. Y. Ma, Y. Wang, T. Z. Ren, S. H. Wu and Z. Y. Yuan, J. Mater. Sci., 2009, 44, 6717 CrossRef CAS.
- W. Xie, R. Grzeschik and S. Schlucker, Angew. Chem., Int. Ed., 2016, 55, 13729 CrossRef CAS PubMed.
- S. M. Morton, D. W. Silverstein and L. Jensen, Chem. Rev., 2011, 111, 3962 CrossRef CAS PubMed.
- M. Yan, G. Li, C. Guo, W. Guo, D. D. Ding, S. Zhang and S. Liu, Nanoscale, 2016, 8, 17828 RSC.
- B. Sun, T. Shi, Z. Liu, Z. Tang, J. Zhou and G. Liao, RSC Adv., 2016, 6, 110120 RSC.
- Z. Chen, P. Kang, M. T. Zhang, B. R. Stoner and T. J. Meyer, Energy Environ. Sci., 2013, 6, 813 CAS.
- J. Gong, H. Yue, Y. Zhao, S. Zhao, L. Zhao, J. Lv, S. Wang and X. Ma, J. Am. Chem. Soc., 2012, 134, 13922 CrossRef CAS PubMed.
- T. Ghodselahi, M. A. Vesaghi, A. Shafiekhani, A. Baghizadeh and M. Lameii, Appl. Surf. Sci., 2008, 255, 2730 CrossRef CAS.
- C. Zhu, A. Osherov and M. J. Panzer, Electrochim. Acta, 2013, 111, 771 CrossRef CAS.
- M. Waki, Y. Maegawa, K. Hara, Y. Goto, S. Shirai, Y. Yamada, N. Mizoshita, T. Tani, W. J. Chun, S. Muratsugu, M. Tada, A. Fukuoka and S. Inagaki, J. Am. Chem. Soc., 2014, 136, 4003 CrossRef CAS PubMed.
- R. Bashiri, N. M. Mohamed, C. F. Kait and S. Sufian, Int. J. Hydrogen Energy, 2015, 40, 6021 CrossRef CAS.
- Y. Xu, C. Zhang, L. Zhang, X. Zhang, H. Yao and J. Shi, Energy Environ. Sci., 2016, 9, 2410 CAS.
- Y. Fang, B. Zhang, L. Hong, K. Zhang, G. Li, J. Jiang, R. Yan and J. Chen, Nanoscale, 2016, 8, 17004 RSC.
- L. Ge, C. Han and J. Liu, Appl. Catal., B, 2011, 108–109, 100 CrossRef CAS.
- S. Linic, P. Christopher and D. B. Ingram, Nat. Mater., 2011, 10, 911 CrossRef CAS PubMed.
- J. Huo and H. Zeng, Appl. Catal., B, 2016, 199, 342 CrossRef CAS.
Footnote |
| † Electronic supplementary information (ESI) available. See DOI: 10.1039/c6ra27686e |
| This journal is © The Royal Society of Chemistry 2017 |

