DOI:
10.1039/C6RA27684A
(Paper)
RSC Adv., 2017,
7, 10660-10667
8-Styryl-substituted coralyne derivatives as DNA binding fluorescent probes†
Received
2nd December 2016
, Accepted 30th January 2017
First published on 8th February 2017
Abstract
Six new 8-styryl-substituted coralyne derivatives 4a–f were synthesized from coralyne (2) by a base catalysed Knoevenagel type reaction. It was shown by photometric and fluorimetric titrations of double stranded and quadruplex DNA to 4b–d as well as by fluorimetric DNA denaturation experiments that these ligands bind to DNA with different binding modes at varying ligand-DNA ratios (LDR). Specifically, the addition of DNA caused initially a hypochromic effect in absorbance and, at a particular LDR, the development of a new red shifted absorption band with a hyperchromic effect. Furthermore, 4b–d induced a significant and selective stabilization of quadruplex DNA towards unfolding (ΔTm = 31.6–32.9 °C at LDR = 5), which is even more pronounced as compared to the parent compound coralyne (2). Most notably, the addition of DNA to the dimethylamino-substituted derivative 4b leads to a new, strongly red-shifted emission band at 695 nm. Hence, this derivative is a fluorescent probe that changes its fluorescence colour from green to red in the presence of DNA and even allows the fluorimetric analysis of living cells by staining of the nucleoli.
Introduction
The desire to develop efficient fluorescent probes for the detection of nucleic acids has gained great attention in chemistry, biology and medicine because emission spectroscopy is a highly sensitive method that requires only a relatively simple setup.1 Especially, there is an increasing interest for the selective detection of higher order DNA forms, e.g. G-quadruplex DNA structures (G4 DNA).2 Hence, a large number of so called “light-up” probes including (benz)imidazole,3 benzindole,4 benzothiazole,5 berberine,6 coumarin,7 cyanine,8 pyridinium,9 quinolinium,10 quinolizinium11 and thioflavine12 based dyes have been developed whose emission quantum yield increases drastically upon binding to DNA.
Because of the proposed biological relevance of quadruplex DNA,13 numerous ligands have been investigated regarding their binding affinity and selectivity towards G4 DNA.14 In order to achieve a high binding affinity, such a ligand should consist of an extended polycyclic (hetero)aromatic π system, which allows sufficient overlap with the surface of the G-quartet. Moreover, it should have at least one positive charge in the core or in a side chain.15 Nevertheless, many ligands vary in topology and substitution pattern as the most prominent examples include porphyrines, acridines, anthraquinones, azoniahetarenes, cyanine dyes and heteroaromatic natural products.16 G4 DNA was also targeted with heterocyclic alkaloids and their derivatives, such as palmatine, sanguarine, berberine (1) and coralyne (2).17 In this context, absorption and fluorescence studies with intramolecular anti-parallel G-quadruplex forming human telomeric TTAGGG repeat sequences revealed non-cooperative 1![[thin space (1/6-em)]](https://www.rsc.org/images/entities/char_2009.gif) :1 binding for all the molecules, with 2 having a stronger binding affinity than the related alkaloids.18 Coralyne (2) also stabilizes G4 DNA more efficiently against thermal denaturation and it has a higher anti-telomerase activity (IC50 = 70 μM) than berberine (1).19 Furthermore, it binds and stabilizes the anti-parallel G4 DNA structure formed by the insulin-linked polymorphic region (ILPR) (Kba2 = 2.5 × 10⁶).20 It also exhibits anti-leukemic activity21 as well as human topoisomerase I poisoning activity22 and it efficiently causes photoinduced DNA damage.23 It was found, too, that 2 forms strong inclusion complexes with cyclodextrins, which could be relevant for the development of drug delivery systems.24 Lastly, its high selectivity for triplex DNA in comparison to duplex DNA was established.25
:1 binding for all the molecules, with 2 having a stronger binding affinity than the related alkaloids.18 Coralyne (2) also stabilizes G4 DNA more efficiently against thermal denaturation and it has a higher anti-telomerase activity (IC50 = 70 μM) than berberine (1).19 Furthermore, it binds and stabilizes the anti-parallel G4 DNA structure formed by the insulin-linked polymorphic region (ILPR) (Kba2 = 2.5 × 10⁶).20 It also exhibits anti-leukemic activity21 as well as human topoisomerase I poisoning activity22 and it efficiently causes photoinduced DNA damage.23 It was found, too, that 2 forms strong inclusion complexes with cyclodextrins, which could be relevant for the development of drug delivery systems.24 Lastly, its high selectivity for triplex DNA in comparison to duplex DNA was established.25
Along with its many positive attributes one drawback of coralyne (2) is that its interaction with DNA leads to fluorescence quenching. As quenching may also be induced by other external factors it is rather unspecific, so that the parent compound 2 can hardly be used for selective fluorimetric DNA detection. In this study we wanted to extend the π system of the heterocyclic alkaloid coralyne (2) with a styryl substituent in order to functionalize it as a potential fluorescent probe and to achieve an increased affinity towards G4 DNA. We considered it an advantage that the DNA binding properties of 2 have already been investigated in detail (see above)26 and that styryl dyes have been established as useful probes in bioanalytical chemistry. In addition, synthesis of styryl dyes is straightforward and at the same time they generally exhibit a higher photostability than classical cyanine dyes.27 Moreover, styryl substituents were already introduced into several fluorescent ligands because they offer a flexible conjugated linkage.3c,9 Hence, we modified the 8-position of coralyne (2) to obtain the 8-styryl-substituted derivatives 4a–f with different donor and acceptor substituents.
Results
Synthesis
Coralyne sulfoacetate (2SA)28 was converted to the tetrafluoroborate salt 2BF4 by ion metathesis (Scheme 1). The latter was subsequently made to react with the aldehydes 3a–f or their respective bis(1-piperidino)phenyl derivatives in a base catalysed Knoevenagel type reaction29 to give the 8-styryl-substituted coralyne derivatives 4a–f in 36–90% yield (cf. ESI†). The structures of the new compounds 4a–f30 were confirmed by NMR spectroscopic analysis (1H, 13C, COSY, HSQC, HMBC), mass-spectrometric data and elemental analysis. The anthryl-substituted derivative 4g could not be obtained because 2BF4 decomposed under the reaction conditions. Presumably the steric hindrance of the peri-hydrogen atoms of the anthracene moiety suppresses the reaction. The E-configuration of the double bond in 4a–f was established by the characteristic coupling constant of the vicinal alkene protons (3J = 16–17 Hz).
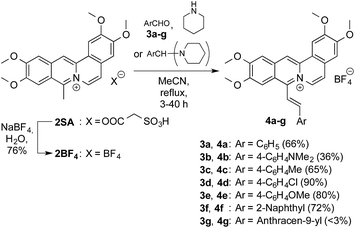 |
| | Scheme 1 Synthesis of the 8-styryl-substituted coralyne derivatives 4a–f. | |
Photophysical properties
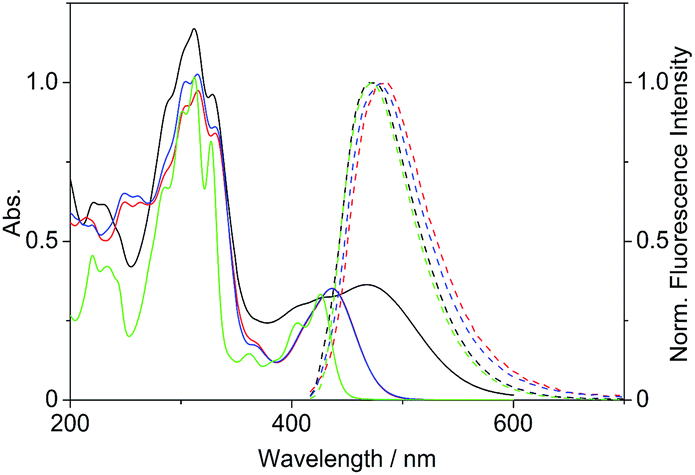
Firstly, we investigated the photophysical properties of the coralyne derivatives 4a–f. The compounds 4a and 4c–f exhibit nearly the same spectroscopic properties with long wavelength absorption maxima at λabs = 434–438 nm and broad emission bands at λfl = 475–484 nm in MeCN (Table 1, Fig. 1).
Table 1 Absorption and emission properties of 2 and 4a–f in MeCN
| Derivative |
λabsa/nm |
lgεb |
λflc/nm |
Φfld/10−2 |
| Long-wavelength absorption maximum; c = 20 μM. Molar extinction coefficient. Fluorescence maximum (Abs. = 0.10 at excitation wavelength λex = 400 nm). Fluorescence quantum yield relative to coumarin 307 (Φfl = 0.58);31 estimated error for fluorescence quantum yields: ±10%. |
| 2 |
426 |
4.22 |
473 |
51 |
| 4a |
434 |
4.22 |
475 |
4.1 |
| 4b |
468 |
4.26 |
471 |
3.8 |
| 4c |
436 |
4.25 |
484 |
0.8 |
| 4d |
436 |
4.25 |
479 |
1.8 |
| 4e |
438 |
4.27 |
479 |
1.9 |
| 4f |
438 |
4.27 |
478 |
1.7 |
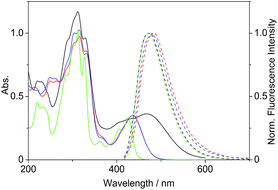 |
| | Fig. 1 Absorption (c = 20 μM in MeCN, solid lines) and normalized emission spectra (Abs. = 0.10 at λex = 400 nm, dashed lines) of derivatives 2 (green), 4b (black), 4c (red) and 4d (blue). | |
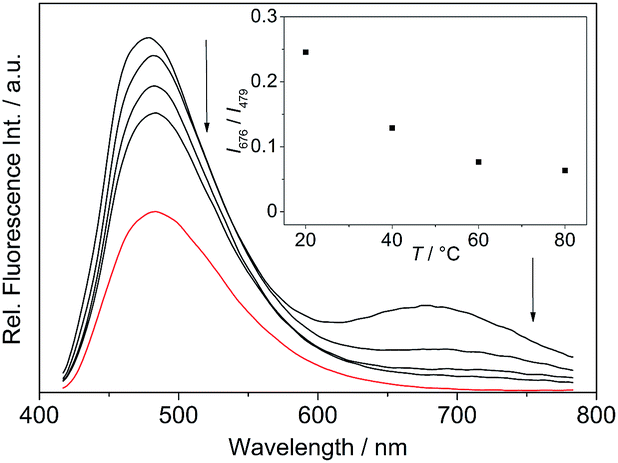
The absorption maximum of the 4-dimethylaminostyryl-substituted derivative 4b, however, is red-shifted to λabs = 468 nm, whereas its emission maximum remains in the same wavelength region than that of the derivatives 4a and 4c–f (λfl = 471 nm). Moreover, 4b exhibits dual fluorescence in glycerol with an additional red-shifted emission band at λfl = 676 nm, that is not present in MeCN or in aqueous buffer solution (Fig. 2 and S2†). Remarkably, in glycerol both band intensities and their ratio I676/I479 decrease with increasing temperature from 20 °C to 80 °C (inset in Fig. 2). In general, all derivatives 4a–f are only weakly fluorescent (Φfl < 0.04 in MeCN) as compared to the parent compound coralyne (2) (Φfl = 0.51).
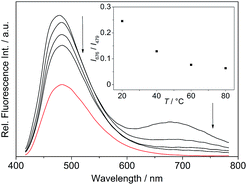 |
| | Fig. 2 Emission spectra of 4b (c = 2.5 μM, with 0.25% v/v DMSO) in glycerol (black lines) and in phosphate buffer (cNa+ = 16 mM, pH 7.0) at 20 °C (red line); λex = 400 nm. The arrows indicate the changes in emission intensity with increasing temperature. Inset: plot of the relative fluorescence intensity I676/I479 versus temperature. | |
DNA binding properties
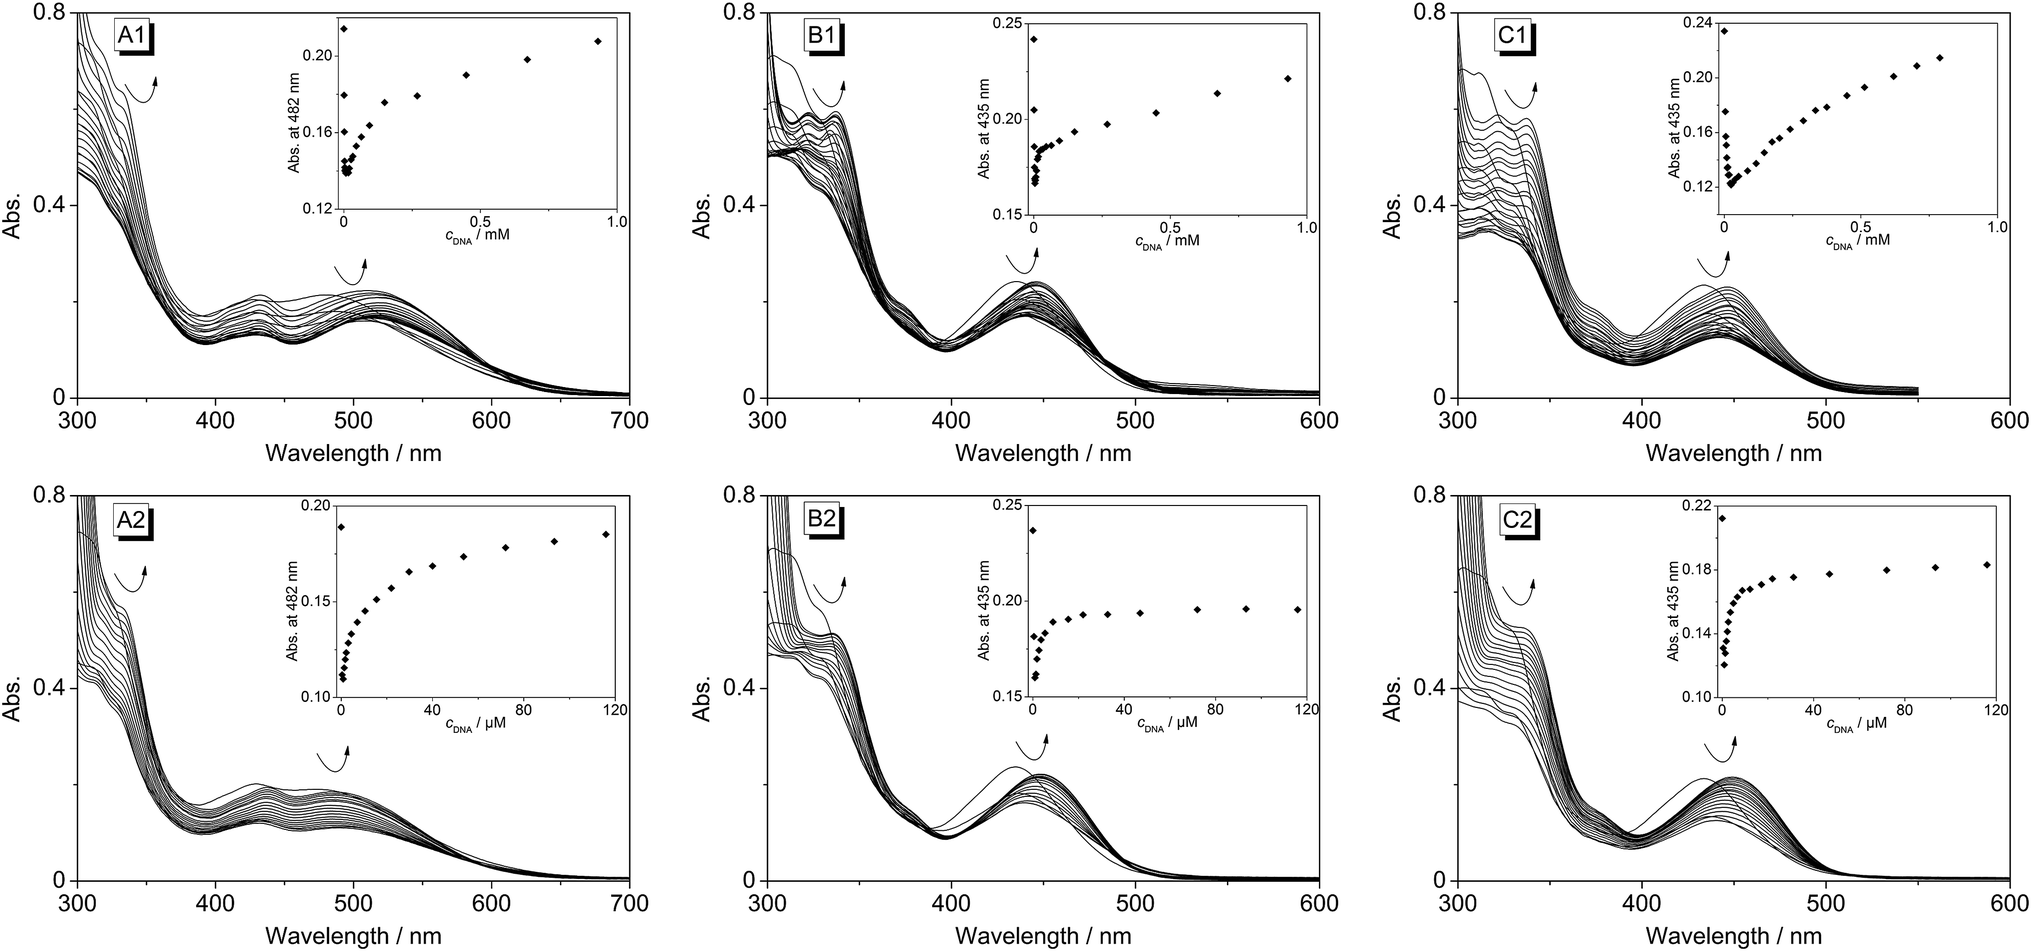
Spectrophotometric and spectrofluorimetric titrations. The changes of the absorbance upon addition of double-stranded ct DNA and the G4 DNA d[A(GGGTAA)3GGG] (22AG) to the derivatives 4b–d were followed by spectrophotometric titrations. At the beginning of each titration the absorbance decreased until a particular ligand-to-DNA ratio (LDR) was reached (Fig. 3). This hypsochromic effect occurred for 4b–d at the same LDR (>22) upon addition of 22AG, but at different LDRs upon addition of ct DNA (4b: LDR > 2.7, 4c: LDR > 4.8, 4d: LDR > 1.4). Subsequently, the absorption increased at lower LDR, and a red shift of the absorption maximum was observed. In the case of ligands 4c and 4d, the red shift is slightly more pronounced upon addition of 22AG (Δλ = 14 nm) as compared to addition of ct DNA (Δλ = 11 nm). The largest red shift was observed when ct DNA was added to 4b (Δλ = 28 nm), whereas no red shift occurred in the presence of 22AG (Table 2). In general, isosbestic points could not be detected during the titrations.
 |
| | Fig. 3 Spectrophotometric titration of ct DNA (A1, B1, C1) and 22AG (A2, B2, C2) to the coralyne derivatives 4b (A), 4c (B), 4d (C) in phosphate buffer (cNa+ = 16 mM, pH 7.0; with 10% v/v DMSO) [cL = 20 μM, cct-DNA,bp = 1.34 mM (A1 and B1), cct-DNA,bp = 1.45 mM (C1), c22AG = 360 μM (A2, B2, C2)]. Insets: plot of absorption versus DNA concentration. The arrows indicate the changes of absorption upon addition of DNA. | |
Table 2 Absorption and emission properties of 2 and 4b–d in the presence of ct DNA and 22AG
| Derivative |
λabsa/nm |
lgεb |
Δλabs,ct-DNAc/nm |
Δλabs,22AGc/nm |
λfld/nm |
Δλfl,ct-DNAe/nm |
Δλfl,22AGe/nm |
Kct-DNAf/105 M−1 |
K22AGf/105 M−1 |
| Long-wavelength absorption maximum; c = 20 μM in phosphate buffer (cNa+ = 16 mM, pH 7.0; with 10% v/v DMSO). Molar extinction coefficient. Shift of the long-wavelength absorption maximum between free and bound ligand. Long-wavelength emission maximum; c = 20 μM in phosphate buffer (cNa+ = 16 mM, pH 7.0; with 10% v/v DMSO); λex = 400 nm. Shift of the long-wavelength emission maximum between free and bound ligand. Binding constant K determined from fluorimetric titrations. Ref. 26. Not determined. Ref. 18. |
| 2 |
421g |
4.16g |
—h |
3g |
472g |
—h |
—h |
7.0i |
50g |
| 4b |
482 |
4.03 |
28 |
0 |
480 |
215 |
215 |
2.3 |
0.33 |
| 4c |
435 |
4.08 |
11 |
14 |
492 |
15 |
9 |
—h |
—h |
| 4d |
435 |
4.07 |
11 |
14 |
486 |
13 |
13 |
—h |
—h |
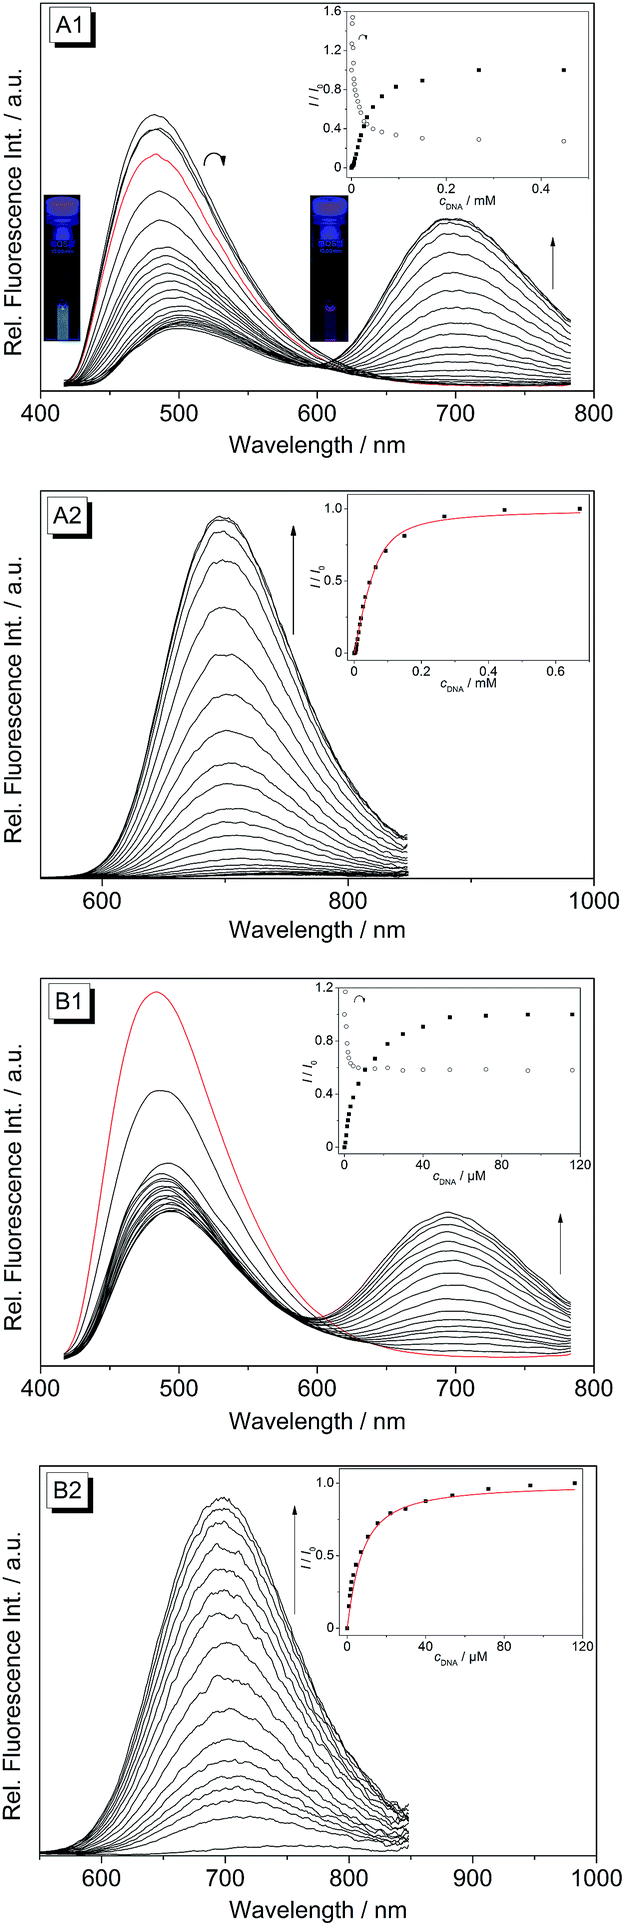
Upon excitation at λex = 400 nm the derivatives 4b–d exhibit broad emission bands at 480 nm (4b), 492 nm (4c) and 486 nm (4d) in aqueous buffer solution (Fig. 4 and S1†). The addition of ct DNA and 22AG to 4b led to a continuous decrease of the fluorescence intensity with increasing DNA concentration at the emission maximum (λfl = 480 nm), and also to the development of a new emission band at 695 nm. Since the ligand is not fluorescent between 600 and 850 nm in the absence of DNA, the spectra were also recorded at an excitation wavelength of λex = 500 nm in order to achieve a better light-up effect. The increase in fluorescence intensity of the red-shifted emission band is more pronounced upon addition of ct DNA (I/I0 = 125) as compared to addition of 22AG (I/I0 = 53). The binding isotherms were analysed according to an established protocol32 assuming a non-competitive binding mode (insets in Fig. 4A2 and B2, red lines) to obtain the binding constants for 4b (Kct-DNA = 2.3 × 10⁵ M−1, K22AG = 3.3 × 10⁴ M−1). Unfortunately, the results of the fluorimetric titrations of DNA to 4c and 4d did not allow the determination of the respective binding constants because in each case the fluorescence intensity was only marginally affected by addition of DNA (0.6 < I/I0 < 2.0) and only resulted in fluctuating emission intensities (Fig. S1†). However, with increasing DNA concentration the emission bands were red-shifted by 9–15 nm.
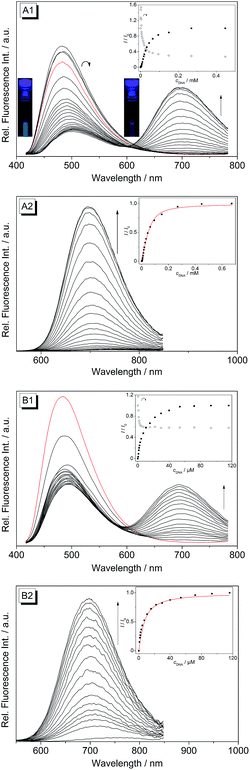 |
| | Fig. 4 Spectrofluorimetric titration of ct DNA (A1 and A2) and 22AG (B1 and B2) to the coralyne derivative 4b in phosphate buffer (cNa+ = 16 mM, pH 7.0; with 10% v/v DMSO) [cL = 20 μM, cct-DNA,bp = 1.34 mM, c22AG = 360 μM, λex = 400 nm (A1 and B1) and 500 nm (A2 and B2)]. Insets: plot of the relative fluorescence intensity I/I0 (corrected with regard to the change of the absorption at the excitation wavelength) versus DNA concentration at λfl = 480 nm (○) and 695 nm (■). The emission spectra of the pure ligand solution are depicted in red. The arrows indicate the changes in emission intensity upon addition of DNA. The inset pictures in (A1) show the fluorescence colours of 4b in the absence and in the presence of ct DNA; λex = 366 nm. The contrast and brightness were enhanced by 30% without changing the true colours. | |
Thermal denaturation experiments
The binding properties of ligands 4b–d and of coralyne (2), for direct comparison, with G4 DNA were further investigated by thermal denaturation experiments. For that purpose, the changes of the melting temperature of the quadruplex-forming oligonucleotide F21T [fluo-GGG(TTAGGG)3-tamra], that is end-labeled with two fluorophores, were determined in the presence of the ligands at different LDR according to an established protocol.33 The melting temperature of F21T, that denotes 50% disassembly of the quadruplex to the unfolded single-strand, was Tm = 44.3 ± 0.5 °C and was not affected by the presence of 1% DMSO. The latter was added in the denaturation experiments in order to ensure the solubility of 4b–d in aqueous buffer solution. The oligonucleotide F21T is highly stabilized towards unfolding by all of the tested ligands (Table 3). The highest stabilization of F21T is achieved in the presence of 4d (ΔTm = 32.9 °C at LDR = 5), while the parent compound, 2, has a smaller effect on the melting temperature at the same LDR (ΔTm = 27.0 °C). In the presence of a 15-fold excess of the self-complementary duplex forming oligonucleotide ds26 the induced shifts of the melting temperature are only marginally affected (ΔΔTm = 0.5–2.4 °C). Remarkably, all the melting curves show two transitions in the presence of 2 and 4b–d at LDR = 1.3 (Fig. S3†), which resulted in a bimodal shape of their first derivative (Fig. S4†). Therefore, the melting temperatures at this LDR could not be determined unambiguously.
Table 3 Shift of melting temperature, ΔTm, of quadruplex DNA F21T in the presence of the ligands 2 and 4b–d at different LDR without and with the duplex DNA ds26 as determined by fluorimetric thermal denaturation studies
| Ligand |
ΔTm/°C at different LDRa |
| Without ds26 |
With ds26b |
| 2.5 |
5.0 |
2.5 |
5.0 |
| ΔTm of F21T; cF21T = 0.2 μM (in oligonucleotide); KCl–LiCl–Na–cacodylate buffer (10 mM K+, 10 mM Na+, 90 mM Li+, pH 7.2); λex = 470 nm; λem = 515 nm; estimated error: ±0.5 °C of the given data. cds26 = 3.0 μM. |
| 2BF4 |
21.7 |
27.0 |
20.0 |
26.5 |
| 4b |
28.2 |
31.6 |
21.3 |
30.7 |
| 4c |
25.9 |
31.8 |
23.3 |
29.4 |
| 4d |
28.1 |
32.9 |
25.5 |
31.4 |
Fluorimetric analysis of cells
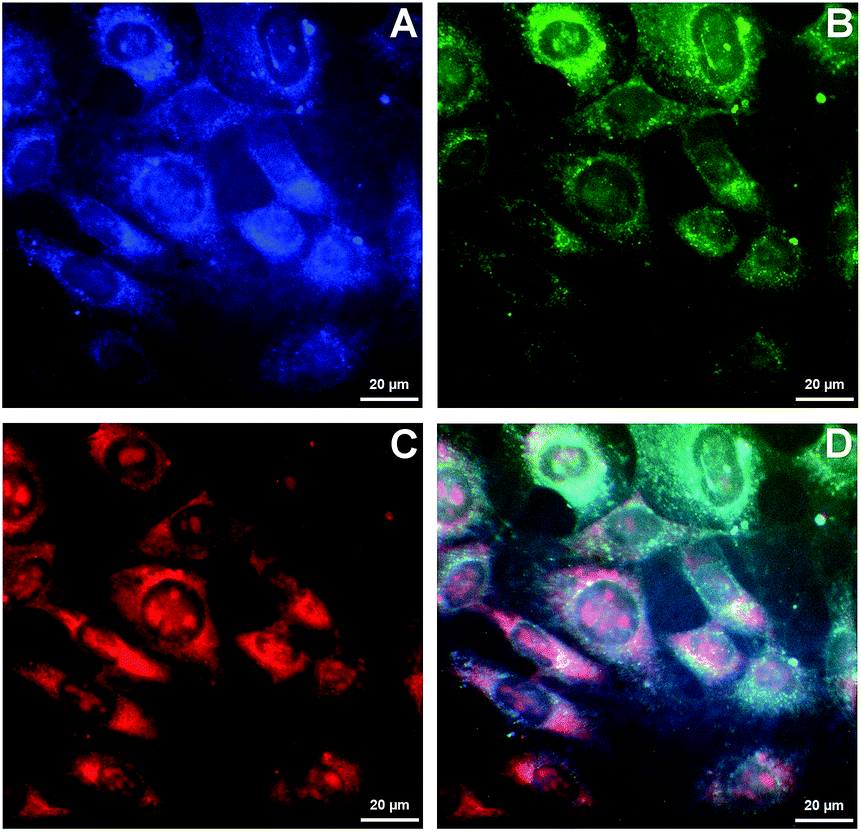
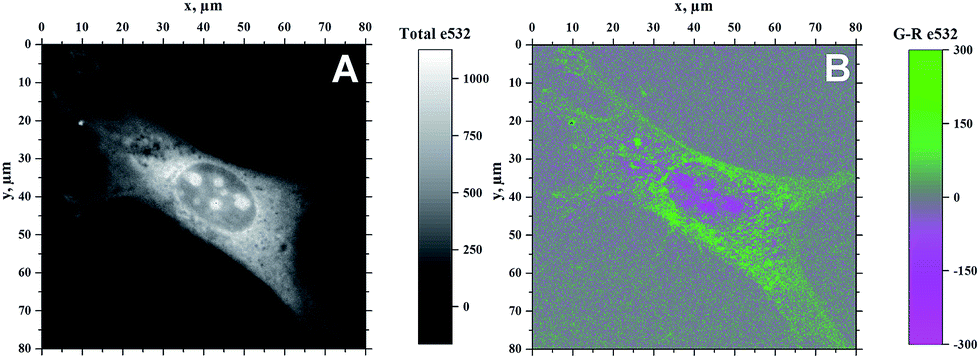
Because of the ability of 4b to indicate the presence of DNA by the change of emission colour (Fig. 4), it was also investigated whether 4b is capable to enter living cells and to visualize distinct cell components. Therefore, NIH 3T3 mouse fibroblasts were treated with 4b (2.5 μM) and analysed by epifluorescence microscopy after 1 h of incubation (Fig. 5). By means of different cut-off filters a multi-colour picture was obtained that did not change with longer incubation times. Remarkably, the nucleoli showed only a red emission, whereas additional blue and green emission areas were detected in the cytoplasm. In order to visualize the distinct cell components in more detail, additional confocal fluorescence microscopy images of single cells were obtained (Fig. 6). It can be clearly recognized that the red emission is much more pronounced in the nucleoli (Fig. 6B).
 |
| | Fig. 5 Epifluorescence microscopy images of NIH 3T3 mouse fibroblasts after incubation with 4b (2.5 μM) for 1 h. Pictures were taken with an Axiovert 135 microscope (AxioCam MRm). The different emission colours were separated by blocking filters. Panel (A): λex = 320–390 nm, λem = 415–470 nm; panel (B): λex = 450–490 nm, λem > 515 nm; panel (C): λex = 535–560 nm, λem > 585 nm; panel (D): overlay of all pictures. | |
 |
| | Fig. 6 Confocal fluorescence microscopy images of NIH 3T3 mouse fibroblasts after incubation with 4b (2.5 μM) for 1 h (λex = 532 nm). Pictures were taken with a Microtime 200 confocal fluorescence microscope system (PicoQuant). Panel (A): without filter; panel (B): different emission colours separated by blocking filters (green channel: λem > 515 nm, red channel: λem = 652–732 nm). | |
Discussion
The derivatives 4b–d were investigated with regard to their DNA binding properties. Firstly, the course of all spectrophotometric titrations, i.e. the absence of an isosbestic point, clearly reveals that 4b–d bind to DNA with different binding modes at varying LDR. Because of the complex binding situation, the respective binding isotherms could not be fitted to a theoretical model. The derivatives 4c and 4d show similar DNA binding properties with almost identical bathochromic shifts of the absorption and emission bands (Table 2). This behaviour is in agreement with the observation that a chloro substituent affects the DNA binding properties of a ligand in a similar manner as a methyl substituent.34 The results of the spectrometric titrations of DNA to 4b indicate, on the one side, a preferred binding to duplex DNA over G4 DNA because a significant bathochromic shift of the absorbance maximum was only detected in the presence of ct DNA (Fig. 3A1 and A2). Moreover, the respective binding constant obtained from fluorimetric titrations is approximately one order of magnitude higher for ct DNA (Table 2).
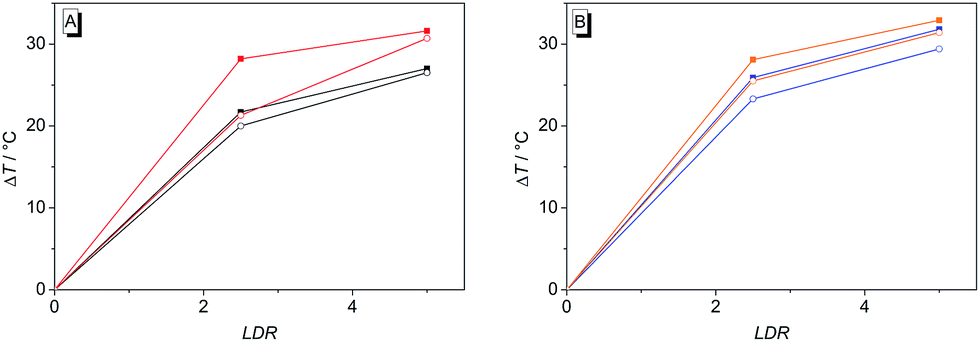
On the other side, the induced shifts of melting temperature of the G4 DNA forming oligonucleotide F21T in presence of 2 and 4b–d revealed a significant and highly selective stabilization of G4 DNA. While the melting temperature of F21T in the presence of the parent compound 2 is in good agreement with literature data (ΔTm = 27.0 °C at LDR = 5),19 the extension of the conjugated aromatic π system of 2 indeed further enhances the stabilizing effect on G4 DNA by 4.6–5.9 °C, thus indicating that the styryl substituent causes an increased affinity of the ligand. Remarkably, the presence of an excess of duplex DNA has only a small effect on the induced shifts of melting temperature (Fig. 7, Table S2†), which indicates that all of the tested ligands selectively stabilize G4 DNA over duplex DNA. It should be noted that the latter result seems to be inconsistent with the determined binding constants (Table 2) that revealed a higher affinity of the ligand 4b to duplex DNA than to quadruplex DNA. The reason for this inconsistency most likely lies in the different ionic strength and composition of the buffer solutions that were employed in the different experiments. Due to the limited solubility of the ligands in aqueous solution at high ionic strength, the titrations used for the determination of the Kb values were performed in 16 mM sodium phosphate buffer, in which the antiparallel quadruplex form of 22AG is the predominant species.35 In contrast, the DNA denaturation experiments were performed in K+-containing cacodylate buffer at significantly higher ionic strength. In the latter medium, the telomeric oligonucleotide sequence folds into different quadruplex structures, namely in two intramolecular (3 + 1) G-quadruplexes, and a basket-type G-quadruplex with only two neighbouring G-tetrads.36 Moreover, we expect that the binding constants of the ligands with ct DNA are most likely much smaller in potassium buffer at higher ionic strength.37
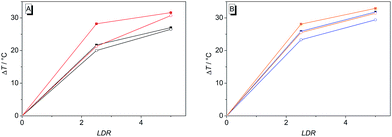 |
| | Fig. 7 Induced shift of the melting temperature, ΔTm, of G4 DNA F21T (0.2 μM) upon addition of ligands 2 (A, black lines), 4b (A, red), 4c (B, blue) and 4d (B, orange) in the absence (■) and in the presence (○) of duplex DNA ds26 (3 μM) in aq. KCl–LiCl–Na–cacodylate buffer (10 mM K+, 10 mM Na+, 90 mM Li+, pH 7.2) at different LDR (0, 2.5, 5). | |
The occurrence of two distinct transitions in all of the melting curves at LDR = 1.3 (Fig. S3†) cannot be explained unequivocally. This effect was briefly discussed in the literature already, but in that case an accurate explanation was not given.33 It appears, however, that the first transition corresponds to the melting of the unstabilized F21T in absence of a ligand (Tm ≈ 46 °C) and the second one to the highly stabilized ligand-DNA complex (Tm ≈ 72 °C) (Fig. S4†).
The change in emission colour and the corresponding light-up effect of 4b at λfl = 695 nm in the presence of DNA can already be recognized by the naked eye under UV light (Fig. 4A). The emission shift is likely the result of suppressed deactivation pathways in the excited state, namely torsional relaxation, because of the reduced conformational flexibility within the binding site.38 In particular, this effect was observed for quinolizinium derivatives,39 namely the 9-(4-dimethylaminophenyl)benzo[b]quinolizinium in the presence of ct DNA or 22AG,11 and berberine and sanguarine in the presence of abasic site-containing DNA.40 This explanation is consistent with the observation that the red-shifted emission band of 4b is also present in a highly viscous solvent such as glycerol, in which the conformational flexibility is reduced leading to two distinct emitting species (Fig. 2).
As the green emission of 4b at λfl = 471 nm in MeCN or 480 nm in aq. buffer solution is essentially the same as the one observed for coralyne (2), it obviously originates from the azoniatetraphene fluorophore that is not affected by the aminostyryl substituent. At the same time, the absorption spectrum of 4b is significantly red shifted as compared to the parent compound 2, which clearly indicates a donor–acceptor interplay between the aminophenyl group and the quinolizinium unit in the ground state, whose direct excitation should result in a locally excited (LE) state with a pronounced charge shift (CS) character and a corresponding red-shifted emission (Scheme 2). The latter, however, is only observed in glycerol (λF = 676 nm) or when the compound is bound to DNA (λF = 695 nm). These observations point to a fast relaxation of the initially formed CS state in solution to give a twisted conformation, presumably to release steric strain, that decouples the aminostyryl unit from the fluorophore resulting in a blue-shifted coralyne-type emission. In media with restricted free volume, i.e. glycerol or DNA, the torsional relaxation is slower than the emission from the locally excited CS state, so that under these conditions the red shifted emission is observed. In turn, the relative emission intensity I676/I479 between the two emission bands decreases with increasing temperature and therefore decreasing viscosity, thus, indicating that the CS band is sensitive to the medium and not observable in a non-viscous solution. In this regard, it was tempting to test, whether 4b also allows the fluorimetric differentiation of distinct cell components. Indeed, the fluorimetric analysis of living cells that were stained with 4b not only revealed its ability to permeate into the cells, but also to stain distinct cell components, i.e. the nucleoli, which were mainly visible in the red emission channel (Fig. 5 and 6). Since the emission colour of 4b depends on its environment as well as on the used excitation wavelength (see above), the red emission in the nuclei could therefore be indicative of DNA-bound ligands.
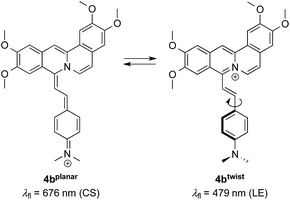 |
| | Scheme 2 Different emitting conformers of 4b in glycerol. | |
Conclusions
The base-catalysed Knoevenagel type reaction of methyl-substituted quinolizinum derivatives was successfully employed to transform coralyne (2) into six new 8-styryl-substituted coralyne derivatives. As revealed by spectrometric titrations and thermal denaturation experiments, the derivatives 4b–d exhibit significant binding interactions to DNA. Especially, they cause an even more pronounced stabilization of G4 DNA in comparison to coralyne (2). Most notably, the 8-(4′-dimethylamino)styryl-substituted derivative 4b is a fluorescent probe that not only features a fluorescence light-up effect at 695 nm, but also changes its fluorescence colour from green to red in the presence of DNA. Unfortunately, a differentiation between duplex and quadruplex DNA was not achieved; however, the derivative 4b enables the fluorimetric analysis of living cells.
Acknowledgements
This paper is dedicated to Prof. Dr Adalbert Maercker on the occasion of his 85th birthday. Financial support by the Deutsche Forschungsgemeinschaft (INST 221/87-1 FUGG), the European Research Council (ERC grant to HS, ERC grant agreement No. 279202), and the University of Siegen is gratefully acknowledged. NIH 3T3 mouse fibroblasts were kindly provided by Dr Jürgen Schnekenburger (Biomedical Technology Center of the Medical Faculty Münster, Germany). PMP thanks the Fond der Chemischen Industrie for a PhD fellowship.
Notes and references
-
(a) D.-L. Ma, H.-Z. He, K.-H. Leung, H.-J. Zhong, D. S.-H. Chan and C.-H. Leung, Chem. Soc. Rev., 2013, 42, 3427–3440 RSC;
(b) H. Kobayashi, M. Ogawa, R. Alford, P. L. Choyke and Y. Urano, Chem. Rev., 2010, 110, 2620–2640 CrossRef CAS PubMed;
(c) D. M. Kolpashchikov, Chem. Rev., 2010, 110, 4709–4723 CrossRef CAS PubMed;
(d) R. W. Sinkeldam, N. J. Greco and Y. Tor, Chem. Rev., 2010, 110, 2579–2619 CrossRef CAS PubMed;
(e) A. Granzhan, H. Ihmels and M. Tian, ARKIVOC, 2015, vi, 494–523 Search PubMed.
-
(a) B. R. Vummidi, J. Alzeer and N. W. Luedtke, ChemBioChem, 2013, 14, 540–558 CrossRef CAS PubMed;
(b) E. Largy, A. Granzhan, F. Hamon, D. Verga and M.-P. Teulade-Fichou, Top. Curr. Chem., 2013, 330, 111–177 CrossRef CAS PubMed.
-
(a) B. Jin, X. Zhang, W. Zheng, X. Liu, C. Qi, F. Wang and D. Shangguan, Anal. Chem., 2014, 86, 943–952 CrossRef CAS PubMed;
(b) Y. Wei, X. Zhang, L. Wang, Y. Liu, T. Bing, X. Liu and D. Shangguan, RSC Adv., 2015, 5, 75911–75917 RSC;
(c) S. Wu, L. Wang, N. Zhang, Y. Liu, W. Zheng, A. Chang, F. Wang, S. Li and D. Shangguan, Chem.–Eur. J., 2016, 22, 6037–6047 CrossRef CAS PubMed;
(d) S.-B. Chen, W.-B. Wu, M.-H. Hu, T.-M. Ou, L.-Q. Gu, J.-H. Tan and Z.-S. Huang, Chem. Commun., 2014, 50, 12173–12176 RSC;
(e) M.-H. Hu, S.-B. Chen, R.-J. Guo, T.-M. Ou, Z.-S. Huang and J.-H. Tan, Analyst, 2015, 140, 4616–4625 RSC.
- D. Lin, X. Fei, Y. Gu, C. Wang, Y. Tang, R. Li and J. Zhou, Analyst, 2015, 140, 5772–5780 RSC.
- Y.-J. Lu, S.-C. Yan, F.-Y. Chan, L. Zou, W.-H. Chung, W.-L. Wong, B. Qiu, N. Sun, P.-H. Chan, Z.-S. Huang, L.-Q. Gu and K.-Y. Wong, Chem. Commun., 2011, 47, 4971–4973 RSC.
-
(a) L. Xu, S. Hong, N. Sun, K. Wang, L. Zhou, L. Ji and R. Pei, Chem. Commun., 2016, 52, 179–182 RSC;
(b) C.-Q. Zhou, J.-W. Yang, C. Dong, Y.-M. Wang, B. Sun, J.-X. Chen, Y.-S. Xu and W.-H. Chen, Org. Biomol. Chem., 2016, 14, 191–197 RSC.
-
(a) J.-w. Yan, Y.-g. Tian, J.-H. Tan and Z.-S. Huang, Analyst, 2015, 140, 7146–7149 RSC;
(b) M. Zuffo, F. Doria, V. Spalluto, S. Ladame and M. Freccero, Chem.–Eur. J., 2015, 21, 17596–17600 CrossRef CAS PubMed.
-
(a) X. Chen, J. Wang, G. Jiang, G. Zu, M. Liu, L. Zhou and R. Pei, RSC Adv., 2016, 6, 70117–70123 RSC;
(b) H. Ihmels and L. Thomas, Org. Biomol. Chem., 2013, 11, 480–487 RSC;
(c) B. Karg, A. Funke, A. Ficht, A. Sievers-Engler, M. Lämmerhofer and K. Weisz, Chem.–Eur. J., 2015, 21, 13802–13811 CrossRef CAS PubMed.
- X. Xie, B. Choi, E. Largy, R. Guillot, A. Granzhan and M.-P. Teulade-Fichou, Chem.–Eur. J., 2013, 19, 1214–1226 CrossRef CAS PubMed.
- P. Yang, A. De Cian, M.-P. Teulade-Fichou, J.-L. Mergny and D. Monchaud, Angew. Chem., Int. Ed., 2009, 48, 2188–2191 CrossRef CAS PubMed.
- R. Bortolozzi, H. Ihmels, L. Thomas, M. Tian and G. Viola, Chem.–Eur. J., 2013, 19, 8736–8741 CrossRef CAS PubMed.
-
(a) V. Gabelica, R. Maeda, T. Fujimoto, H. Yaku, T. Murashima, N. Sugimoto and D. Miyoshi, Biochemistry, 2013, 52, 5620–5628 CrossRef CAS PubMed;
(b) A. La Renaud de Faverie, A. Guedin, A. Bedrat, L. A. Yatsunyk and J.-L. Mergny, Nucleic Acids Res., 2014, 42, e65 CrossRef PubMed.
- S. Neidle, J. Med. Chem., 2016, 59, 5987–6011 CrossRef CAS PubMed.
-
(a) Y. Xu, Chem. Soc. Rev., 2011, 40, 2719–2740 RSC;
(b) A. Ali and S. Bhattacharya, Bioorg. Med. Chem., 2014, 22, 4506–4521 CrossRef CAS PubMed.
- P. Murat, Y. Singh and E. Defrancq, Chem. Soc. Rev., 2011, 40, 5293–5307 RSC.
-
(a) J. L.-Y. Chen, J. Sperry, N. Y. Ip and M. A. Brimble, MedChemComm, 2011, 2, 229 RSC;
(b) A. Granzhan and H. Ihmels, Synlett, 2016, 27, 1775–1793 CrossRef CAS;
(c) S. A. Ohnmacht and S. Neidle, Bioorg. Med. Chem. Lett., 2014, 24, 2602–2612 CrossRef CAS PubMed;
(d) B. Maji and S. Bhattacharya, Chem. Commun., 2014, 50, 6422–6438 RSC.
- Y.-X. Xiong, Z.-S. Huang and J.-H. Tan, Eur. J. Med. Chem., 2015, 97, 538–551 CrossRef CAS PubMed.
- K. Bhadra and G. S. Kumar, Med. Res. Rev., 2011, 31, 821–862 CrossRef CAS PubMed.
- M. Franceschin, L. Rossetti, A. D'Ambrosio, S. Schirripa, A. Bianco, G. Ortaggi, M. Savino, C. Schultes and S. Neidle, Bioorg. Med. Chem. Lett., 2006, 16, 1707–1711 CrossRef CAS PubMed.
- D. Dzubiel, H. Ihmels, M. M. A. Mahmoud and L. Thomas, Beilstein J. Org. Chem., 2014, 10, 2963–2974 CrossRef PubMed.
-
(a) K. Y. Zee-Cheng and C. C. Cheng, J. Pharm. Sci., 1973, 62, 1572–1573 CrossRef CAS PubMed;
(b) M. Sanders, A. Liu, T.-K. Li, H.-Y. Wu, S. Desai, Y. Mao, E. Rubin, E. LaVoie, D. Makhey and L. Liu, Biochem. Pharmacol., 1998, 56, 1157–1166 CrossRef CAS PubMed.
-
(a) D. Makhey, B. Gatto, C. Yu, A. Liu, L. F. Liu and E. J. LaVoie, Bioorg. Med. Chem., 1996, 4, 781–791 CrossRef CAS PubMed;
(b) B. S. Patro, B. Maity and S. Chattopadhyay, Antioxid. Redox Signaling, 2010, 12, 945–960 CrossRef CAS PubMed.
- H. Ihmels and A. Salbach, Photochem. Photobiol., 2006, 82, 1572–1576 CrossRef CAS PubMed.
- S. Hazra, M. Hossain and G. S. Kumar, J. Inclusion Phenom. Macrocyclic Chem., 2014, 78, 311–323 CrossRef CAS.
-
(a) L. J. P. Latimer, N. Payton, G. Forsyth and J. S. Lee, Biochem. Cell Biol., 1995, 73, 11–18 CrossRef CAS PubMed;
(b) J. S. Lee, L. J. P. Latimer and K. J. Hampel, Biochemistry, 1993, 32, 5591–5597 CrossRef CAS PubMed;
(c) J. Ren and J. B. Chaires, Biochemistry, 1999, 38, 16067–16075 CrossRef CAS PubMed;
(d) F. Xing, G. Song, J. Ren, J. B. Chaires and X. Qu, FEBS Lett., 2005, 579, 5035–5039 CrossRef CAS PubMed.
- K. Bhadra and G. S. Kumar, Biochim. Biophys. Acta, 2011, 1810, 485–496 CrossRef CAS PubMed.
- T. Deligeorgiev, A. Vasilev, S. Kaloyanova and J. J. Vaquero, Color. Technol., 2010, 126, 55–80 CAS.
- K. Y. Zee-Cheng and C. C. Cheng, J. Pharm. Sci., 1972, 61, 969–971 CrossRef CAS PubMed.
-
(a) K. Sato, K. Nakajima, S. Arai and T. Yamagishi, Liebigs Ann., 1996, 439–446 CAS;
(b) S. Arai, K. Sato, K. Kano, T. Yafune, M. Hida and T. Yamagishi, Heterocycles, 1994, 37, 955–965 CrossRef.
- The derivatives 4a (CAS 1037305-51-3) and 4d (CAS 1037305-64-8) are registered compounds in the SciFinder® with no given references.
-
(a) G. Jones, W. R. Jackson, C. Y. Choi and W. R. Bergmark, J. Phys. Chem., 1985, 89, 294–300 CrossRef CAS;
(b) G. A. Crosby and J. N. Demas, J. Phys. Chem., 1971, 75, 991–1024 CrossRef CAS;
(c) B. Valeur and M. N. Berberan-Santos, Molecular fluorescence. Principles and applications, WileyVCH, Weinheim, 2nd edn, 2012 Search PubMed.
- F. H. Stootman, D. M. Fisher, A. Rodger and J. R. Aldrich-Wright, Analyst, 2006, 131, 1145–1151 RSC.
- A. de Cian, L. Guittat, M. Kaiser, B. Saccà, S. Amrane, A. Bourdoncle, P. Alberti, M.-P. Teulade-Fichou, L. Lacroix and J.-L. Mergny, Methods, 2007, 42, 183–195 CrossRef CAS PubMed.
- K. Benner, H. Ihmels, S. Kölsch and P. M. Pithan, Org. Biomol. Chem., 2014, 12, 1725–1734 CAS.
- Y. He, R. D. Neumann and I. G. Panyutin, Nucleic Acids Res., 2004, 32, 5359–5367 CrossRef CAS PubMed.
- K. W. Lim, S. Amrane, S. Bouaziz, W. Xu, Y. Mu, D. J. Patel, K. N. Luu and A. T. Phan, J. Am. Chem. Soc., 2009, 131, 4301–4309 CrossRef CAS PubMed.
- Nucleic Acids in Chemistry and Biology, ed. G. M. Blackburn, M. J. Gait, D. Loakes and D. M. Williams, Royal Society of Chemistry, Cambridge, 2006, pp. 341–382 Search PubMed.
- R. N. Dsouza, U. Pischel and W. M. Nau, Chem. Rev., 2011, 111, 7941–7980 CrossRef CAS PubMed.
- K. Faulhaber, A. Granzhan, H. Ihmels, D. Otto, L. Thomas and S. Wells, Photochem. Photobiol. Sci., 2011, 10, 1535–1545 CAS.
-
(a) F. Wu, Y. Shao, K. Ma, Q. Cui, G. Liu and S. Xu, Org. Biomol. Chem., 2012, 10, 3300–3307 RSC;
(b) F. Wu, Y. Sun, Y. Shao, S. Xu, G. Liu, J. Peng, L. Liu and N. Lebedev, PLoS One, 2012, 7, e48251 CAS.
Footnote |
| † Electronic supplementary information (ESI) available: Experimental procedures, additional spectroscopic data, 1H and 13C NMR spectra of 2 and 4a–f. See DOI: 10.1039/c6ra27684a |
|
| This journal is © The Royal Society of Chemistry 2017 |
Click here to see how this site uses Cookies. View our privacy policy here. 
 Open Access Article
 This Open Access Article is licensed under a Creative Commons Attribution-Non Commercial 3.0 Unported Licence
 *,
H. Schönherr
*,
H. Schönherr