
 Open Access Article
 This Open Access Article is licensed under a Creative Commons Attribution-Non Commercial 3.0 Unported Licence
Mesoporous cerium–zirconium oxides modified with gold and copper – synthesis, characterization and performance in selective oxidation of glycerol†
Piotr Kaminski *ab,
Maria Zioleka and
Jeroen A. van Bokhovenbc
*ab,
Maria Zioleka and
Jeroen A. van Bokhovenbc
aAdam Mickiewicz University in Poznań, Faculty of Chemistry, ul. Umultowska 89b, 61-614 Poznań, Poland. E-mail: piotr.kaminski@amu.edu.pl
bETH Zürich, Institute for Chemical and Bioengineering, Vladimir-Prelog-Weg 1, CH-8093 Zürich, Switzerland
cPaul Scherrer Institute, Laboratory for Catalysis and Sustainable Chemistry, CH-5232 Villigen, Switzerland
First published on 23rd January 2017
Abstract
The main goal of this work was the synthesis of mesoporous ceria, zirconia and cerium–zirconium oxides, the application of these supports for the preparation of monometallic (copper or gold) and bimetallic (copper and gold) catalysts and characterisation of their performance in the oxidation of glycerol in basic aqueous solution in the presence of oxygen. The methods applied for the study included: adsorption/desorption of nitrogen, XRD, ICP-OES, XPS, UV-vis, STEM-EDXS, H2-TPR. The presence of the following species Au0, Auδ+, negatively charged gold Au− or Au0 in bimetallic particles, Cu+, Cu2+, Ce3+ and Ce4+, Zr4+ was confirmed and their content was found to depend on the catalyst composition. The interaction between gold and copper species in bimetallic samples caused the formation of the negative charge on gold and the increase of the amount of Cu+ cations on the catalyst surface. This feature and the higher gold dispersion gave rise to a significant increase in the catalytic activity in glycerol oxidation of bimetallic catalysts with respect to that of monometallic samples. The high selectivity to glyceric acid (GLA) is an important advantage of the bimetallic catalysts (copper–gold), especially those loaded on mixed cerium–zirconium oxides. The bimetallic catalysts were stable and in the second run of the reaction they almost did not change glycerol conversion and increased the selectivity to GLA. The texture parameters of the catalysts had also impact on the selectivity of the reaction: the lower the microporosity the higher the selectivity to GLA. The role of the support is the interaction with copper and gold active species and enhancement of the reagents' chemisorption and electron transfers.
1. Introduction
Bimetallic catalysts supported on metal oxides receive much interest. Bimetallic catalysts containing gold are attractive in different catalytic oxidation processes, e.g. oxidation of carbon monoxide,1–7 methanol,8–11 and other alcohols.12–18 In the case of gold catalysts, metallic gold on the surface of catalysts promotes oxidative properties by leading to higher mobility of oxygen and to a much easier reduction of the copper species.19 The transfer of electrons is difficult on a metallic gold surface; however, copper has a greater electron-donating ability and it can modify the electronic and structural properties of gold.20 Catalysts containing gold that is modified with copper can be useful for the simultaneous total oxidation of carbon monoxide and methanol from gases emitted by automotive devices and during industrial processes.11,21,22 The bimetallic copper–gold catalysts promoted with ceria and/or zirconia loaded on mesoporous SBA-15 materials exhibited higher activity in methanol oxidation than analogues monometallic gold or copper catalysts.11 The chemical composition and structure of the support used for gold–copper play an important role in the activation of bimetallic particles. Recently, it was shown that gold–copper loaded on ceria, zirconia and mixed ceria–zirconia supports have changed electronic state of gold and that the mobility of oxygen from the support plays an important role in methanol oxidation.23 The activation of the catalysts at higher temperature, which is necessary for oxidation of methanol, strongly affected the surface properties and activity and selectivity in this reaction.The idea of this work is to apply mesoporous ceria–zirconia mixed oxides with different chemical composition as support for the copper–gold active phase and to investigate the role of chemical composition and structure on the catalytic performance in the liquid phase glycerol oxidation. Ceria–zirconia supports are widely applied in exhaust-gas purification,24,25 but they are not often used for fine chemical catalytic syntheses. The addition of zirconia to pure ceria improves not only the resistance against sintering at a high temperature compared to pure ceria,25,26 but it also affects the oxygen storage capacity.25 This may be very attractive for the interaction with copper–gold phases and for their application in oxidation processes. In contrast to the earlier study,23 in this work the catalysts are not activated at higher temperature before the catalytic oxidation of glycerol. Glycerol oxidation over gold catalysts on different supports has been studied by many authors over the last 15 years.27–35 We analyzed the synergistic effect between copper and gold as well as the influence of the supports.
2. Experimental
2.1. Preparation of catalysts
![[thin space (1/6-em)]](https://www.rsc.org/images/entities/b_char_2009.gif) :Zr = 1:2 and 1:1). The mixed oxides to be studied were synthesized according to the literature methods.36–39 CeZrOx were prepared using an aqueous acidic solution (pH = 2 controlled by 35–38% HCl, Chempur) of 15 wt% cetyltrimethylammonium bromide (CTMABr, Sigma-Aldrich) by dissolving CTMABr at 313 K under stirring for 3 h. The appropriate amounts (depending on the assumed Ce
:Zr = 1:2 and 1:1). The mixed oxides to be studied were synthesized according to the literature methods.36–39 CeZrOx were prepared using an aqueous acidic solution (pH = 2 controlled by 35–38% HCl, Chempur) of 15 wt% cetyltrimethylammonium bromide (CTMABr, Sigma-Aldrich) by dissolving CTMABr at 313 K under stirring for 3 h. The appropriate amounts (depending on the assumed Ce![[thin space (1/6-em)]](https://www.rsc.org/images/entities/char_2009.gif) :Zr ratio) of zirconium n-tetrapropanol (Zr(OC3H7)4, 70% in n-propanol, Fluka) and powder of cerium(III) nitrate (Ce(NO3)3·6H2O, Sigma-Aldrich) were added into the above-mentioned solution with a surfactant/precursors molar ratio of 0.33. After further stirring for 1 h at 313 K, the mixture was heated at 353 K for 24 h. The template was removed by extraction in a Soxhlet apparatus at 351 K using ethanol for 30 h. Then, the oxide was dried in a vacuum rotator at 343 K (200–300 mbar) and calcined at 673 K for 4 h at the heating rate of 3 K min−1. The final materials were obtained after calcination at 673 K for 4 h at the heating rate of 3 K min−1. The organic template and other carbonates were removed by the calcination.:Zr = 2:1). The syntheses of mixed cerium–zirconium oxide, CeZrOx (Ce:Zr = 2:1) was carried out using a solution of organic copolymer – Pluronic P-123 (polyethyl glycol–polypropyl glycol–polyethyl glycol, Sigma-Aldrich) in ethanol (POCh). A portion of 1.2 g of Pluronic P-123 was dissolved in 12 cm3 of ethanol. P123 was mixed with ethanol at room temperature for 1 h, then powders of metals sources – cerium(III) nitrate (Ce(NO3)3·6H2O, Sigma-Aldrich) and zirconium oxonitrate(V) (ZrO(NO3)2, Sigma-Aldrich), were added to ethanol solution of the template and the mixture was stirred for 1 h. In the sample of CeZrOx(2:1), the ratio of ceria:zirconia was 2:1. The final material was obtained by heating the mixture at 673 K for 10 h in air atmosphere (a heating rate of 1 K min−1). The supports prepared were labelled as XYOx(A:B) where X = Ce; Y = Zr; A:B = ceria:zirconia nominal molar ratio. Calcination removed the organic template and other carbonates.
:Zr ratio) of zirconium n-tetrapropanol (Zr(OC3H7)4, 70% in n-propanol, Fluka) and powder of cerium(III) nitrate (Ce(NO3)3·6H2O, Sigma-Aldrich) were added into the above-mentioned solution with a surfactant/precursors molar ratio of 0.33. After further stirring for 1 h at 313 K, the mixture was heated at 353 K for 24 h. The template was removed by extraction in a Soxhlet apparatus at 351 K using ethanol for 30 h. Then, the oxide was dried in a vacuum rotator at 343 K (200–300 mbar) and calcined at 673 K for 4 h at the heating rate of 3 K min−1. The final materials were obtained after calcination at 673 K for 4 h at the heating rate of 3 K min−1. The organic template and other carbonates were removed by the calcination.:Zr = 2:1). The syntheses of mixed cerium–zirconium oxide, CeZrOx (Ce:Zr = 2:1) was carried out using a solution of organic copolymer – Pluronic P-123 (polyethyl glycol–polypropyl glycol–polyethyl glycol, Sigma-Aldrich) in ethanol (POCh). A portion of 1.2 g of Pluronic P-123 was dissolved in 12 cm3 of ethanol. P123 was mixed with ethanol at room temperature for 1 h, then powders of metals sources – cerium(III) nitrate (Ce(NO3)3·6H2O, Sigma-Aldrich) and zirconium oxonitrate(V) (ZrO(NO3)2, Sigma-Aldrich), were added to ethanol solution of the template and the mixture was stirred for 1 h. In the sample of CeZrOx(2:1), the ratio of ceria:zirconia was 2:1. The final material was obtained by heating the mixture at 673 K for 10 h in air atmosphere (a heating rate of 1 K min−1). The supports prepared were labelled as XYOx(A:B) where X = Ce; Y = Zr; A:B = ceria:zirconia nominal molar ratio. Calcination removed the organic template and other carbonates.The main reason of change in the procedure of oxides preparation was the achievement of a high yield of the synthesis. The usage of CTMABr was effective only in the case of small amount of cerium in the synthesis mixture (i.e. the nominal molar ratio CeO2:ZrO2 = 1:1 and 1:2). For a higher cerium content the change of the template was necessary. Therefore, for the sample with the nominal molar ratio of CeO2:ZrO2 = 2:1 and CeO2 we used Pluronic P-123 as a template.
:1), Au/CeZrOx(1:1), Au/CeZrOx(1:2) and Au/ZrO2 were obtained.:1), Cu/CeZrOx(1:1), Cu/CeZrOx(1:2) and Cu/ZrO2.:1), CuAu/CeZrOx(1:1), CuAu/CeZrOx(1:2), CuAu/ZrO2 materials were dried under vacuum at 343 K for 1 h, then at 333 K for 16 h at atmospheric pressure and then calcined at 623 K for 3 h.2.2. Catalyst characterization
The nitrogen adsorption isotherms for CeZrOx(1:1), Au/CeZrOx(1:1), Cu/CeZrOx(1:1) and CuAu/CeZrOx(1:1) were obtained using a ASAP 2020 Instruments at 77 K after pre-treated in situ under high vacuum at 573 K for 8 h. The surface area was calculated by the BET method. Mesopores volume and mean pore size were determined from BJH (adsorption branches).
2.3. Catalytic activity – glycerol oxidation in the liquid phase
:glycerol molar ratio = 2:1). 15.00 g of distillate water was put into the reactor, then 0.0015 mol (0.138 g) of glycerol (Sigma-Aldrich, >99.0%), a base – NaOH (0.12 g) and 0.030 g of catalyst were added and the autoclave was closed. Oxygen was introduced to the autoclave at the selected pressure and the mixture was heated to 333 or 363 K (a heating rate 2 K min−1) and stirring at 400, 800, 1000 or 1200 rpm. The time of reaction was initiated by stirring at the moment when the mixture achieved the selected temperature. The reaction was conducted for 5 h at a selected temperature and stirring speed before analysis of products. The oxygen content was estimated by the electronic sensor of pressure which measured the pressure of oxygen in the real time of the reaction.3. Results and discussion
3.1. Structure of the supports
Undoped zirconia has the monoclinic structure,24 which is a distorted fluorite-type or tetragonal structure. Pure ceria is cubic. The structure of mixed ceria–zirconia oxides strongly depends on the composition and the preparation conditions. With increasing cerium content, the monoclinic structure of mixed oxide solid solution changes to a mixture of monoclinic, tetragonal, pure tetragonal and cubic structures.24 The type of structure and chemical composition are reflected by the stability of the system and the isotropic atomic displacement parameter of oxygen atoms, U(O). This parameter is a good indicator of oxygen diffusivity, which is important in catalytic oxidation reactions. High U(O) values indicate a high static positional disorder and a high dynamic thermal vibration, which enhance the movement of oxide ions across the material. Yashima and Wakita43 found that Ce0.5Zr0.5O2 shows the highest value of U(O) among the materials with different ceria to zirconia ratios. We used three different ceria to zirconia ratios: 2:1, 1:1 and 1:2. The XRD pattern (Fig. 1) of ceria was characteristic of its cubic phase (JCPDS ICDD PDF card – 00-043-1002). The pattern of zirconia identified its structure as a mixture of tetragonal (JCPDS ICDD PDF card – 00-042-1164) and monoclinic (JCPDS ICDD PDF card – 00-007-0343) phases. The XRD patterns of the mixed oxides varied with the chemical composition (Fig. 1). In the samples with a ceria to zirconia ratio of 2:1, the ceria and zirconia phases showed independent XRD patterns. The intensity of the zirconia phase was very low, which is in agreement with the low content of zirconia. Increasing the amount of zirconia to a ceria:zirconia ratio of 1:2 induced asymmetry in the peaks in the XRD patterns; peaks characteristic of both zirconia and ceria, with a slight domination of those from zirconia, were present. Contrary to pure zirconia, which contains both monoclinic and tetragonal structures, the mixture of ceria–zirconia with molar ratio of 1:2 exhibits the presence of only tetragonal zirconia. At equimolar ceria and zirconia ratio, weak reflections of ceria were visible. The structure of zirconia with a uniform distribution of cerium ions within this phase can be assumed.
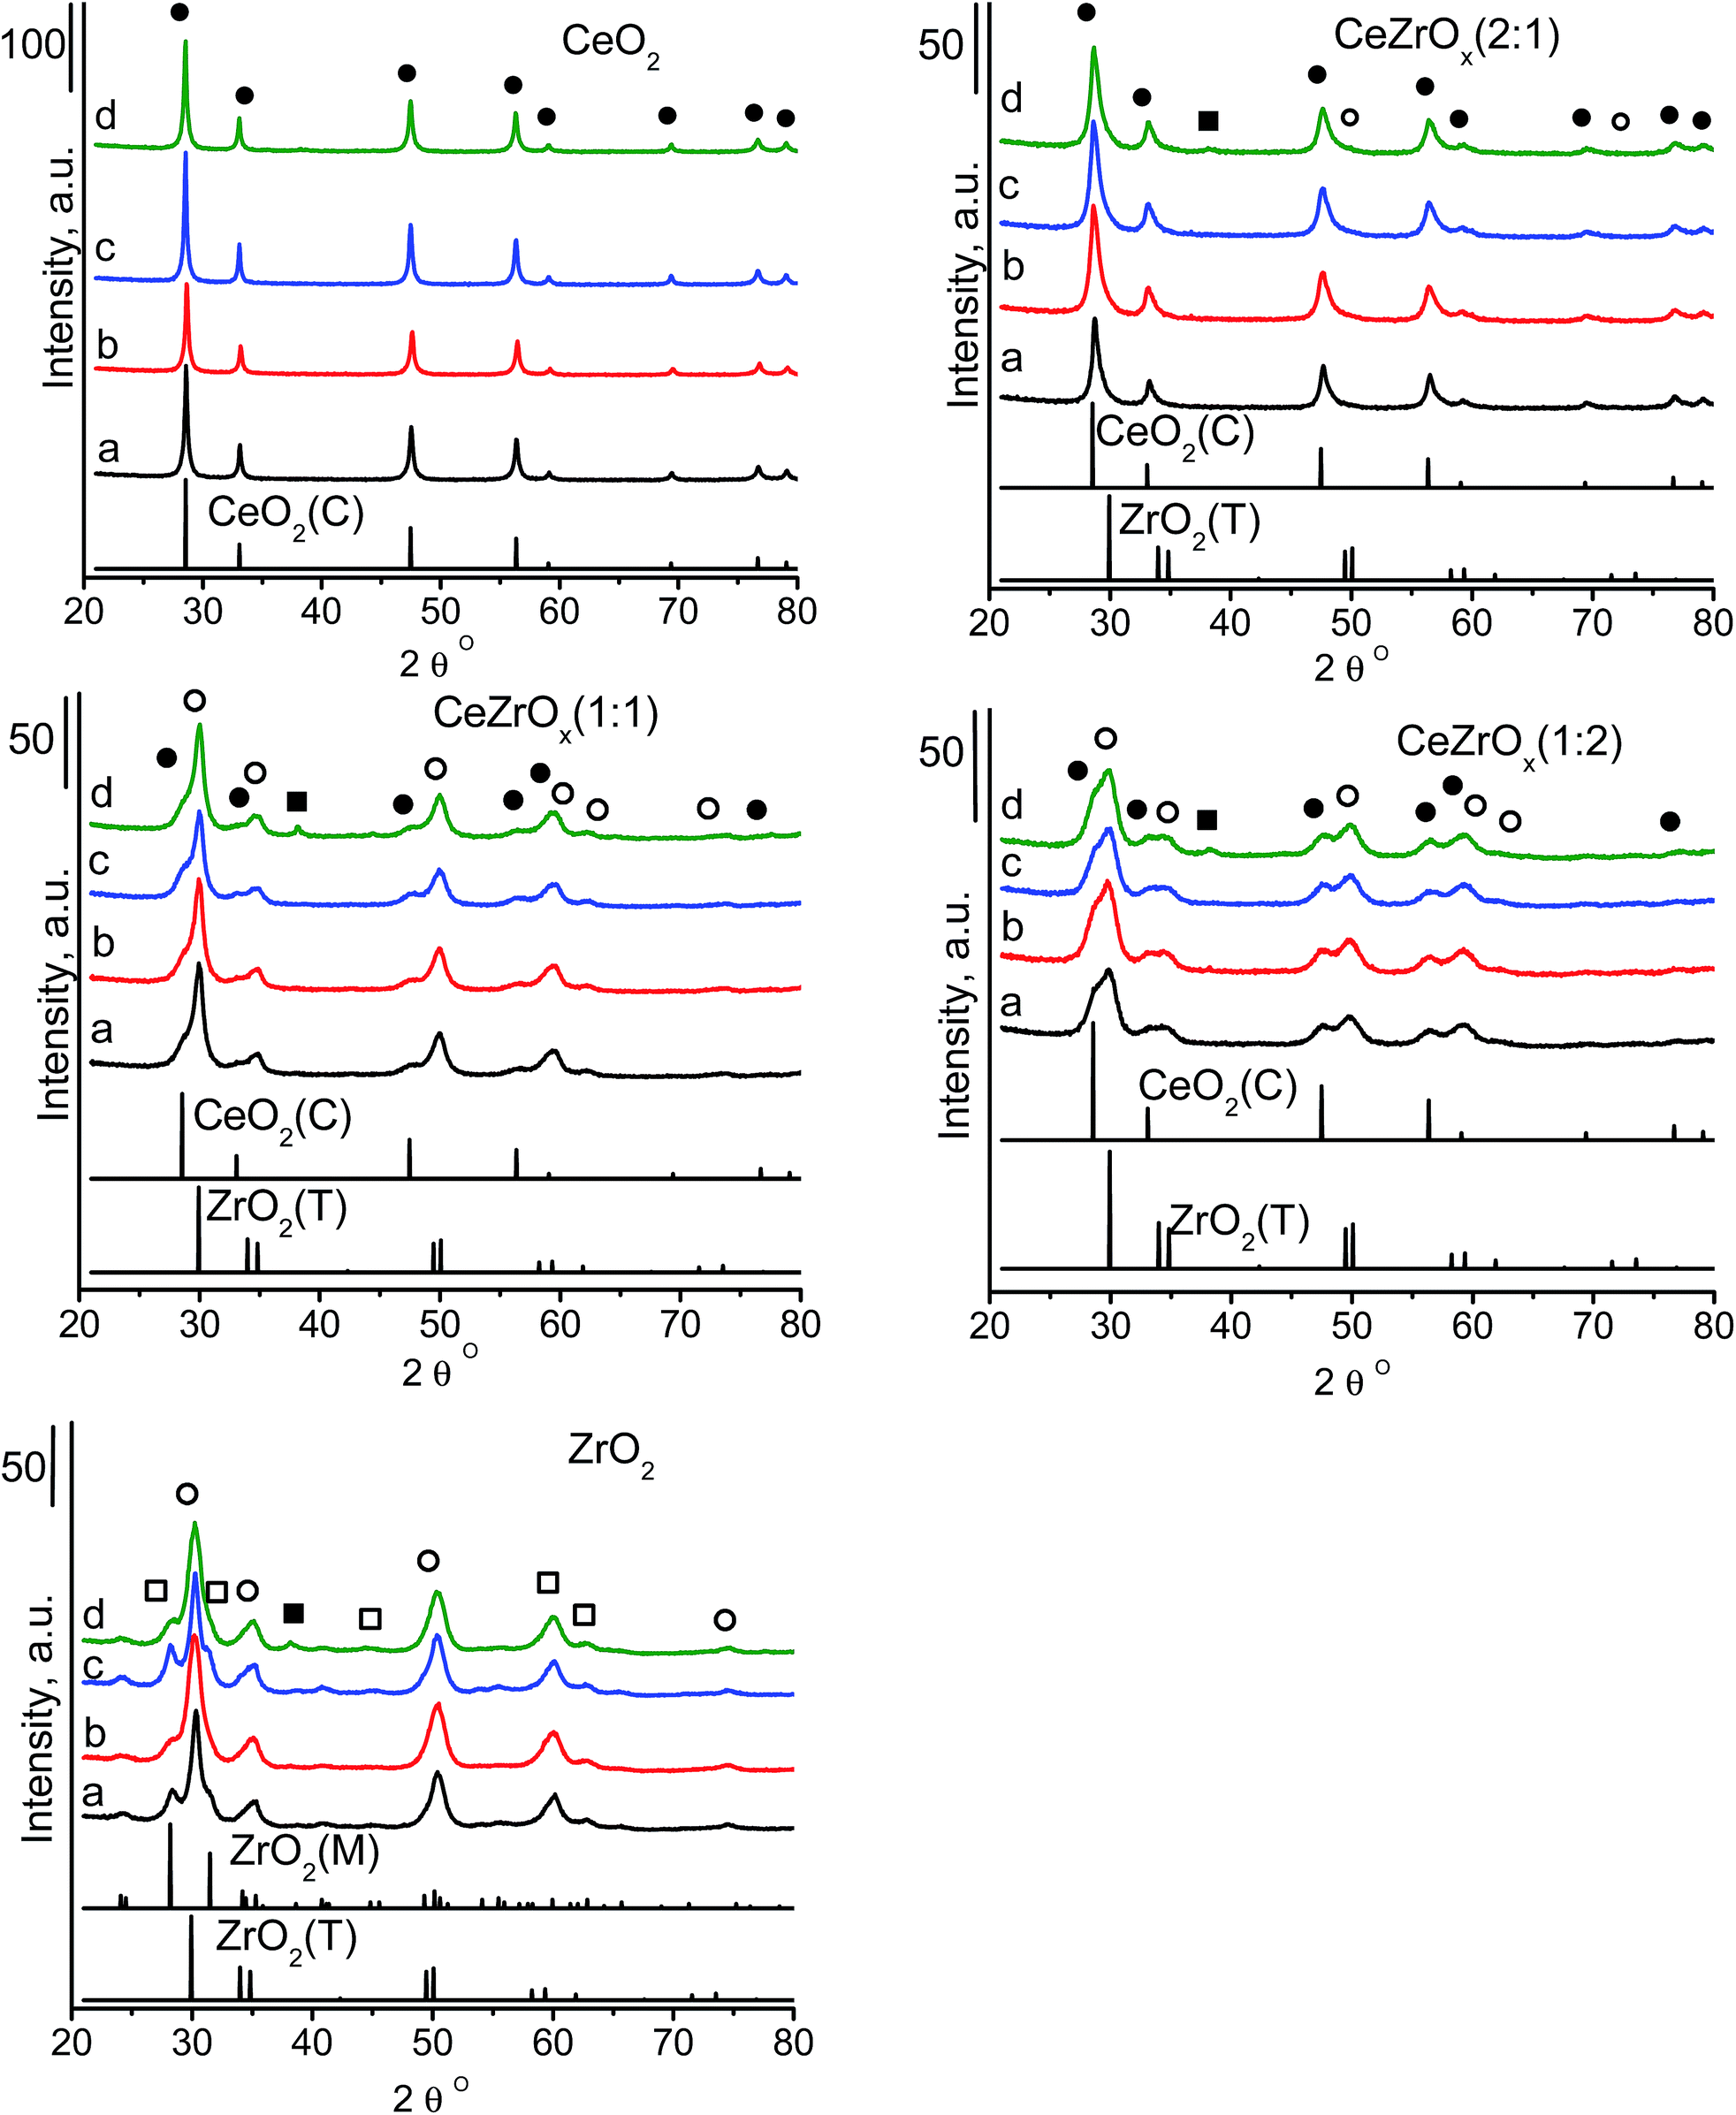 | ||
| Fig. 1 XRD patterns of catalysts: (a) supports, (b) Au catalysts, (c) Cu catalysts, (d) Cu–Au catalysts, where ● – cubic crystal structure of ceria CeO2(C), ○ – tetragonal crystal structure of zirconia ZrO2(T), □ – monoclinic crystal structure of zirconia ZrO2(M), ■ – metallic gold Au0. | ||
The differences in the phase compositions also affect the textural parameters determined from nitrogen adsorption/desorption isotherms (Fig. S1,† Table 1). The isotherms were of type IV indicating mesoporous materials. Ceria, zirconia, and CeZrOx(1:2) contained small amounts of micropores. Because of larger microporosity, the surface area of zirconia is much higher (121 m2 g−1) than that of ceria (25 m2 g−1). The inclusion of a small amount of zirconia into ceria (ceria:zirconia = 2:1) decreased the surface area to 16 m2 g−1. Further increasing the zirconium content led to a slight increase of the surface area to 103 and 108 m2 g−1 for CeZrOx(1:1) and CeZrOx(1:2), respectively.
| Catalyst | Surface area, m2 g−1 (BET) | Av. pore diameters, nm (ads. BJH) | Total pore volume, cm3 g−1 | Micropore volume, cm3 g−1 | Mesopore volume, cm3 g−1 |
|---|---|---|---|---|---|
| CeO2 | 24 | 4.7 | 0.06 | 0.004 | 0.05 |
| Au/CeO2 | 25 | 3.7 | 0.06 | 0.007 | 0.05 |
| Cu/CeO2 | 22 | 3.1 | 0.06 | 0.002 | 0.06 |
| CuAu/CeO2 | 24 | 3.1 | 0.06 | 0.005 | 0.05 |
| CeZrOx(2:1) |
16 | 4.0 | 0.07 | 0.002 | 0.07 |
| Au/CeZrOx(2:1) |
13 | 3.7 | 0.05 | 0.001 | 0.05 |
| Cu/CeZrOx(2:1) |
20 | 3.0 | 0.06 | — | 0.06 |
| CuAu/CeZrOx(2:1) |
20 | 3.0 | 0.06 | — | 0.06 |
| CeZrOx(1:1) |
103 | 7.2 | 0.14 | — | 0.13 |
| Au/CeZrOx(1:1) |
65 | 9.7 | 0.10 | 0.003 | 0.10 |
| Cu/CeZrOx(1:1) |
67 | 7.1 | 0.13 | 0.005 | 0.12 |
| CuAu/CeZrOx(1:1) |
62 | 9.7 | 0.10 | 0.003 | 0.10 |
| CeZrOx(1:2) |
108 | 3.0 | 0.19 | 0.036 | 0.15 |
| Au/CeZrOx(1:2) |
109 | 3.1 | 0.17 | 0.042 | 0.13 |
| Cu/CeZrOx(1:2) |
109 | 3.1 | 0.19 | 0.040 | 0.15 |
| CuAu/CeZrOx(1:2) |
111 | 3.0 | 0.20 | 0.039 | 0.16 |
| ZrO2 | 121 | 3.0 | 0.22 | 0.047 | 0.17 |
| Au/ZrO2 | 114 | 3.1 | 0.26 | 0.041 | 0.22 |
| Cu/ZrO2 | 123 | 3.0 | 0.21 | 0.046 | 0.16 |
| CuAu/ZrO2 | 110 | 3.0 | 0.34 | 0.034 | 0.30 |
3.2. Chemical composition
Table 2 shows the composition of the catalysts. The values estimated from ICP-MS analyses were similar to those assumed in the preparation, i.e., the molar ceria:zirconia ratio of ca. 2:1, 1:1 and 1:2. The modification of all mixed oxide supports, especially by gold, decreased the molar ratio of ceria:zirconia. Thus, metal addition led to a partial removal of cerium by the interaction of ceria with tetrachloroauric. Notably, a higher percentage of cerium removal was observed for CeZrOx(1:1); about 25% compared to 0–14% for the others. The efficiency of copper introduction was higher than that of gold. On all the supports, the copper loading was in the range of 1.4–1.8 wt%, introducing 2.0 wt% during the synthesis. Gold introduction ranged between 0.6 and 1.1 wt%, intending 1.5 wt%. More gold was incorporated on pure ceria than on pure zirconia and for copper, this was the similar. If copper was loaded on the supports already modified with gold species, the total amount of copper introduced onto ceria was greater, suggesting interaction between gold and copper during modification. The difference in gold concentration calculated from ICP and XPS, in which XPS is more surface sensitive, showed that gold was preferably located on the external surface of the oxides (Table 2). The surface concentration of the gold depended on the composition of the supports and was influenced by the admission of copper. The highest gold surface content was on CeZrOx(1:1) in the bimetallic (copper–gold) catalyst (11.4 wt%). The monometallic (gold) catalyst, based on the same support, exhibited a lower content of surface gold species (9.1 wt%).
| Catalyst | Content of metal species, wt% | Gold:copper molar ratio |
Ceria:zirconia molar ratio |
||
|---|---|---|---|---|---|
| Au, ICP/XPS | Cu, ICP/XPS | ICP/XPS | ICP/XPS | As assumed | |
| CeO2 | — | — | —/— | —/— | — |
| CeZrOx(2:1) |
— | — | —/— | 2.8/4.7 | 2.0 |
| CeZrOx(1:1) |
— | — | —/— | 0.8/0.9 | 1.0 |
| CeZrOx(1:2) |
— | — | —/— | 0.5/0.5 | 0.5 |
| ZrO2 | — | — | —/— | —/— | — |
| Au/CeO2 | 1.0/10.0 | — | —/— | —/— | — |
| Au/CeZrOx(2:1) |
1.1/1.7 | — | —/— | 2.4/2.4 | 2.0 |
| Au/CeZrOx(1:1) |
1.0/9.1 | — | —/— | 0.6/0.5 | 1.0 |
| Au/CeZrOx(1:2) |
1.0/6.7 | — | —/— | 0.4/0.6 | 0.5 |
| Au/ZrO2 | 0.6/2.6 | — | —/— | —/— | — |
| Cu/CeO2 | — | 1.4/5.0 | —/— | —/— | — |
| Cu/CeZrOx(2:1) |
— | 1.7/3.1 | —/— | 2.8/2.3 | 2.0 |
| Cu/CeZrOx(1:1) |
— | 1.6/1.1 | —/— | 0.5/0.5 | 1.0 |
| Cu/CeZrOx(1:2) |
— | 1.5/2.0 | —/— | 0.4/1.2 | 0.5 |
| Cu/ZrO2 | — | 1.8/1.0 | —/— | —/— | — |
| CuAu/CeO2 | 1.0/8.2 | 1.7/2.7 | 0.18/0.99 | —/— | — |
| CuAu/CeZrOx(2:1) |
1.0/1.2 | 1.6/1.3 | 0.21/0.30 | 2.4/3.1 | 2.0 |
| CuAu/CeZrOx(1:1) |
1.0/11.4 | 1.7/2.1 | 0.20/1.78 | 0.5/1.0 | 1.0 |
| CuAu/CeZrOx(1:2) |
1.0/3.9 | 1.7/0.7 | 0.19/1.70 | 0.3/0.9 | 0.5 |
| CuAu/ZrO2 | 0.6/0.9 | 1.7/1.8 | 0.12/0.16 | —/— | — |
On all other supports, the concentration of surface gold was lower after copper loading. Loading copper involved the transfer of gold species into the bulk of these supports. In monometallic samples, the surface concentration of gold was higher on ceria than on zirconia. For cerium–zirconium mixed oxides, there was no obvious relationship between the ceria:zirconia ratio and the content of surface gold species. Similarly, copper content on the surface of the supports did not change linearly with the increase of zirconia. Notably, for monometallic copper on pure zirconia and CeZrOx(1:1), the concentration of copper on the surface was lower than the total content of copper, indicating partial incorporation of copper into the support. The same phenomenon was observed for some bimetallic samples.
This behavior indicates the mobility of the catalyst components and the dependence of the modifiers' location on the chemical composition of the support. Such mobility is enhanced by thermal treatments.23 The gold:copper molar ratio in most bimetallic catalysts is much higher on the surface of the material than in the bulk (Table 2). This difference is negligible only for Cu–Au loaded on zirconia suggesting that in this material bimetallic species are distributed more uniformly. The surface and bulk concentrations of cerium and zirconium were estimated on the basis of the ceria:zirconia ratios (Table 2). The values of this ratio differed from the assumed ones. The higher ratio from the XPS analysis compared to ICP indicated enrichment of the surface in cerium. It was most clearly seen for CeZrOx(2:1) and all bimetallic catalysts.
3.3. Texture/structure of catalysts
Modification with copper species did not lead to the appearance of new reflections in the XRD patterns (Fig. 1). The XRD patterns of ceria-containing with only gold did not exhibit reflections from crystalline gold, suggesting the absence of large gold particles. Gold supported together with copper on cerium–zirconium oxides and pure zirconia [CuAu/ZrO2] gave a reflection at 2 theta at ca. 38°, which originates from metallic gold.5,44–46 Using the Scherrer equation, the average size of the particles in CuAu/CeZrOx(1:1) and CuAu/ZrO2 was 7.0 nm and 5.2 nm, respectively.
Table 1 presents the textural/structural parameters of the materials modified with gold and/or copper and those of pristine supports. The surface areas of these samples ranged from 13 [Au/CeZrOx(2:1)] to 123 m2 g−1 [Cu/ZrO2]. The samples based on zirconia were characterized by the highest surface area and with increasing cerium content, the surface area decreased. The addition of gold and/or copper slightly modified the surface area of the supports. The largest decrease in the surface area as a result of metal loading was observed on CeZrOx(1:1). The removal of cerium from this support during modification with metals may correlate to the decrease in the surface area. STEM-EDXS analysis was used to estimate the relative composition and particle size distribution of supported particles. The bimetallic catalysts CuAu/CeZrOx(1:1) and CuAu/ZrO2 had average sizes of 2.2 nm (and a median particle size of 0.83 nm) and 1.6 nm (with a median particle size of 0.73 nm), respectively (Fig. 2). These values were smaller than those obtained from the XRD patterns using the Scherrer formula, which is dominated by the larger particles (7.0 and 5.2 nm, respectively). The particle-size distribution was wider on zirconia than on the mixed oxides, but on both support types, it also covered the larger particles observed in XRD patterns. The differences in the size of gold particles measured by STEM-EDXS and XRD methods resulted from the differences in the resolution of both methods (XRD analysis does not indentify small metal particles). Notably, the average size of gold particles in the bimetallic sample CuAu/CeO2 presented in the PSD diagram (Fig. 2) was greater than that noted on CuAu/ZrO2 and CuAu/CeZrOx(1:1). The comparison of the gold particle size distribution on pure zirconia support for monometallic (Au/ZrO2) and bimetallic (CuAu/ZrO2) systems indicated a decrease in the size of gold particles after the incorporation of copper. Thus, the incorporation of copper enhanced the dispersion of the particles. An important factor that affects the performance of multifunctional catalysts is the location of their components, which was studied for CuAu/CeZrOx(1:1) material by STEM-EDXS analysis. Fig. S2† shows STEM images and EDX results.
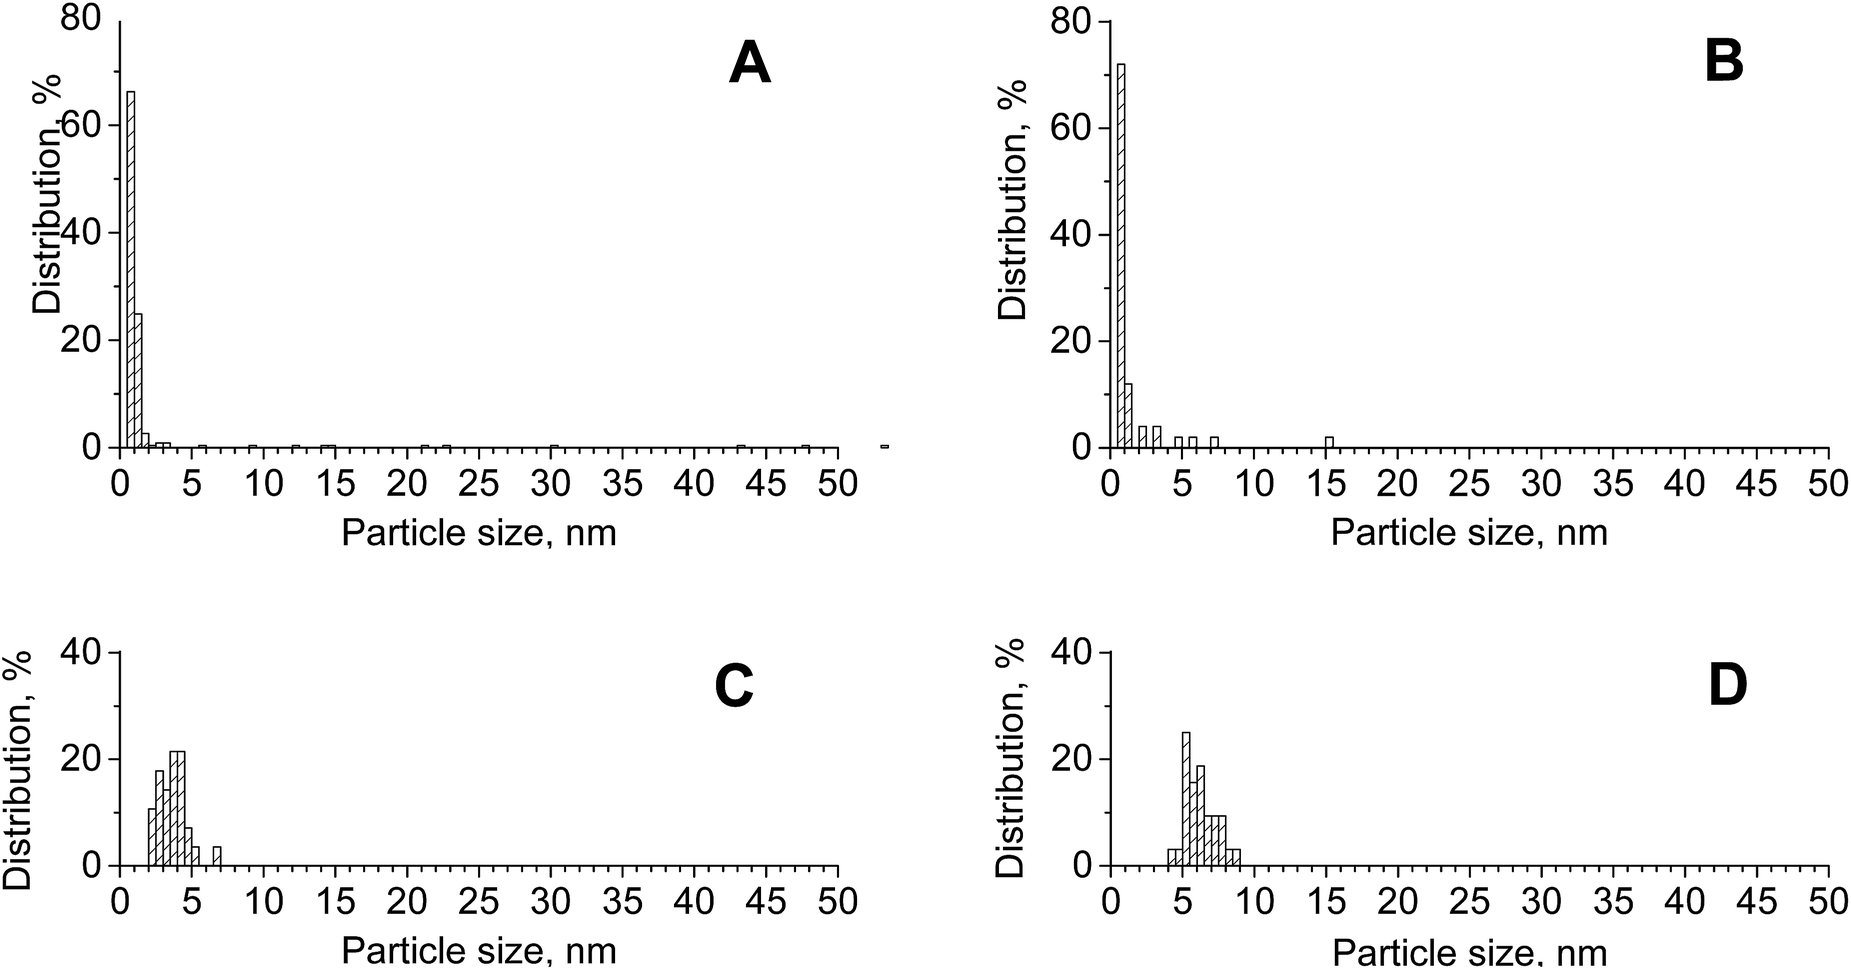 | ||
| Fig. 2 Distribution of gold particle sizes on [A] CuAu/CeZrOx(1:1) (dav = 2.2 nm, from 227 particles on STEM image), [B] CuAu/ZrO2 (dav = 1.6 nm, from 50 particles on STEM image), [C] CuAu/CeO2 (dav = 3.6 nm, from 28 particles on STEM image) and [D] Au/ZrO2 (dav = 6.2 nm, from 28 particles on STEM image). | ||
The distribution of cerium and zirconium was almost the same, confirming the formation of the mixed oxides. Gold and copper species are located in the same areas, which indicates that they are in close vicinity to each other.
Individual species of gold and copper respectively ceria and zirconia were difficult to identify in the STEM images, because their contrast is too similar (Fig. S2†). To determine the composition of the white particles with diameters in the range of 10–70 nm, EDXS spot analyses were performed. The EDX spectrum of area 1, (Fig. S2†), indicated that the main component in the catalysts at this spot is gold. Moreover, a high intensity of gold signals, small intensities of zirconium and copper signals and the lowest intensity of cerium signals revealed that gold, zirconium, and copper were present in the same area. The EDX spectrum of area 2 in Fig. S2† showed that not all signals were as intense; in particular, the signals assigned to gold were less pronounced. This suggested that the larger white particles in STEM images were clusters of mixed oxides of cerium and zirconium and/or copper oxide clusters, with smaller contributions of gold.
3.4. Oxidation state of components
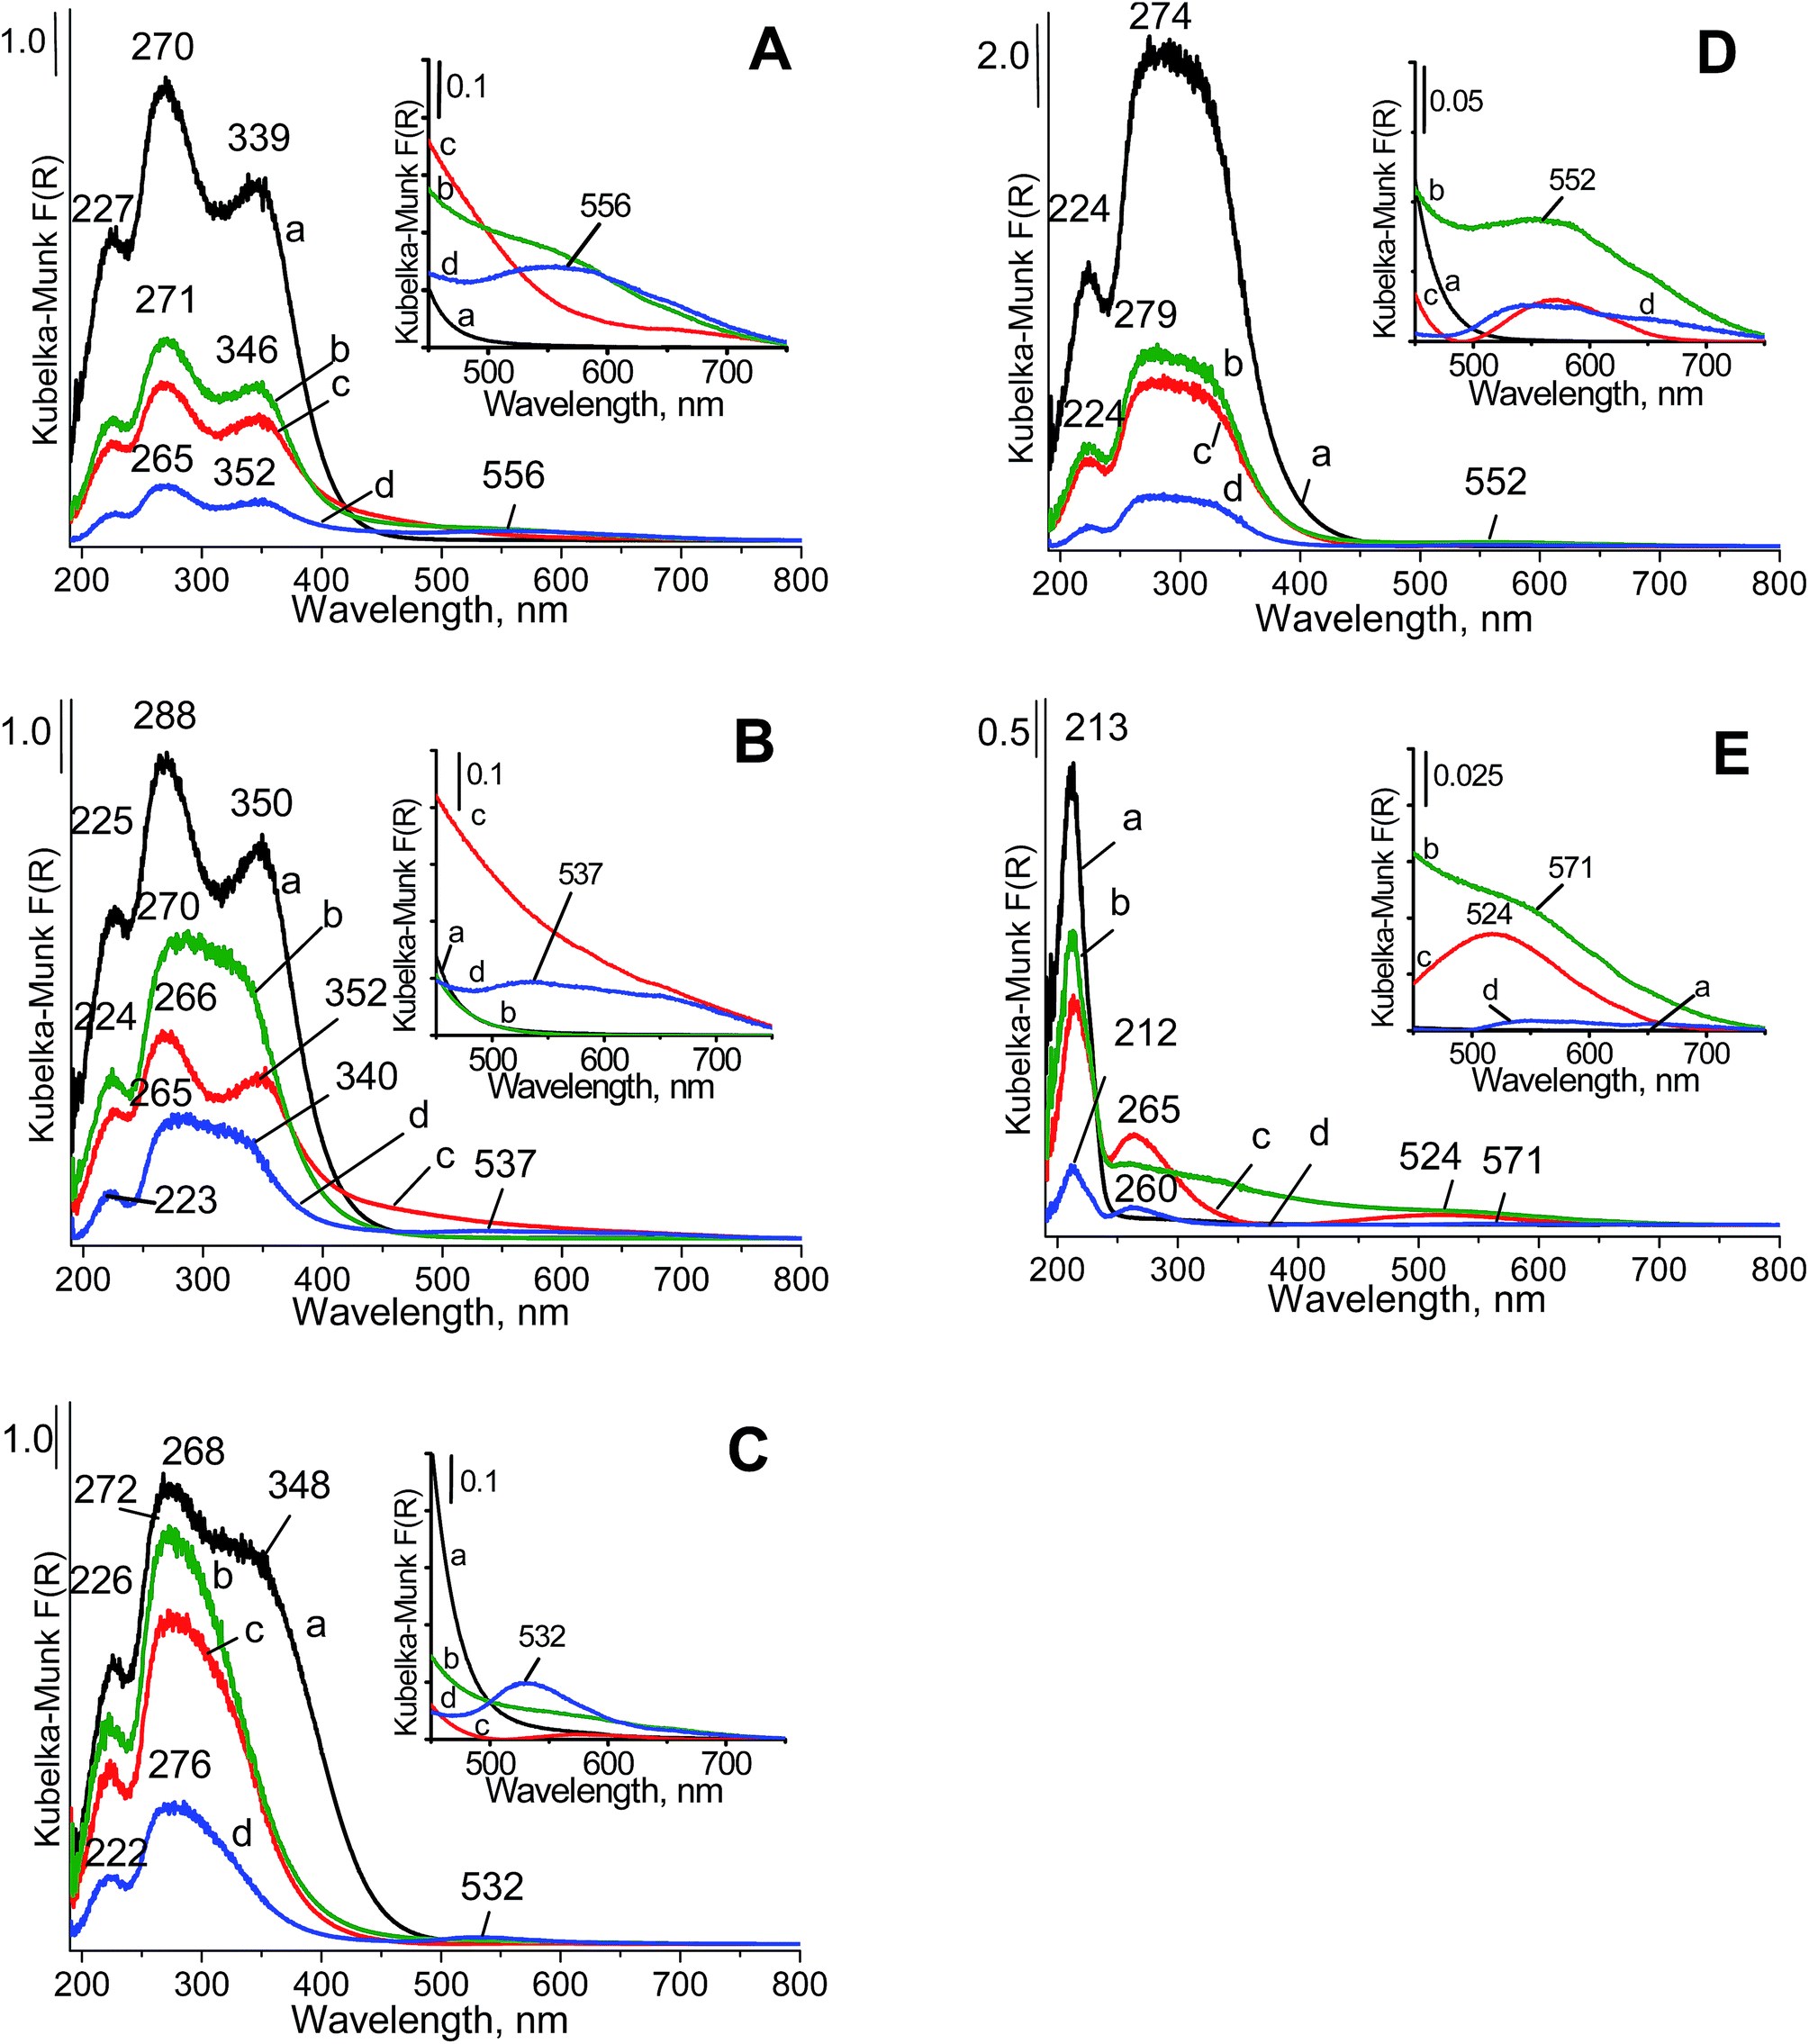 | ||
| Fig. 3 UV-vis spectra of catalysts: [A] (a) CeO2; (b) Au/CeO2; (c) Cu/CeO2; (d) CuAu/CeO2; [B] (a) CeZrOx(2:1); (b) Au/CeZrOx(2:1); (c) Cu/CeZrOx(2:1); (d) CuAu/CeZrOx(2:1); [C] (a) CeZrOx(1:1); (b) Au/CeZrOx(1:1); (c) Cu/CeZrOx(1:1); (d) CuAu/CeZrOx(1:1); [D] (a) CeZrOx(1:2); (b) Au/CeZrOx(1:2); (c) Cu/CeZrOx(1:2); (d) CuAu/CeZrOx(1:2); [E] (a) ZrO2; (b) Au/ZrO2; (c) Cu/ZrO2 and (d) CuAu/ZrO2. | ||
With increasing zirconium content in the mixed oxides (Fig. 3Da), the band at ca. 350 nm became less resolved than the band at ca. 270 nm. This finding suggested that in the mixed oxides, the content of cerium cations at an oxidation state lower than +4 and/or coordination number higher than four decreased. The band at approximately 213 nm (Fig. 3Ea) is typical of a charge transfer from the O2− to Zr4+ ion with tetrahedral configuration in zirconia crystallites.48–50 In the spectra of the mixed oxides, the bands attributed to charge transfers in ceria overlapped with those from the charge transfer in zirconia. After copper and gold loading on ceria, CeZrOx(2:1) and CeZrOx(1:2), the UV-vis bands coming from the charge transfer from oxygen to cerium cations were still present in the spectra, but with lower intensities. This finding indicated that both gold and copper interacted with the cerium cations, which could lead to changes in their oxidation states. The details on the oxidation states of all components are further considered below in the analyses of the XPS data.
The UV-vis spectra of gold-containing samples showed the characteristic ultraviolet-visible band at ca. 525–555 nm, typical of metallic gold.51 This plasmon resonance band corresponds to metallic gold nanoparticles of about 2–6 nm and are in accordance with the literature data.40 The well-resolved metallic gold band was observed for the samples loaded with both copper and gold (spectra d in Fig. 3). The band at ca. 260 nm, which can arise from either the charge-transfer transitions of Au3+ or Au+ ions with ligands or from the absorption caused by the transition of electrons between molecular orbitals of the few-atomic clusters Aun (n < 10),52 could not be distinguished from the band coming from the charge transfer from oxygen to cerium cations.
The modification of supports with copper species changed the UV-vis spectra (Fig. 3Ac–Ec), which was visible for zirconia because in its spectrum, the region above 230 nm did not contain UV-vis bands characteristic of pristine zirconia. A new band at ca. 265 nm appeared. According to literature data,53–55 bands at 220–260 nm were assigned to the charge-transfer transitions from oxygen in the crystal lattice O2− to an isolated copper ion, Cu2+ (O2− → Cu2+; ligand to metal charge transfer). The changes in the UV-vis spectra of the samples containing cerium resulted from copper loading were less pronounced, because the charge transfer in cerium gave bands in the same region.
Fig. 3E showed that after gold loading, the broadened absorption line covered the whole range between 240 and 640 nm, whereas the copper loaded on zirconia gave rise to two well-distinguished bands at 256 and weak in the region 400–600 nm. For copper species, the first band was assigned to the charge-transfer transitions from oxygen ions in the crystal lattice of the support to isolated copper ions (O2− to Cu2+).54,55 The second band came from the d–d transition of Cu2+ ions located in an octahedral environment.56 This band was also observed (although less intense) in the spectra of Cu/CeZrOx(1:2) and Cu/CeZrOx(1:1), whereas in the UV-vis spectra of Cu/CeZrOx(2:1) and Cu/CeO2, the tail of the spectral line could overlap with the band discussed. This band was also assigned in literature57 to oligonuclear copper oxygen species: Cuδ+⋯Oδ−⋯Cuδ+. In the spectra of bimetallic systems (gold–copper), this band coexisted with the band assigned to d–d transitions in metallic gold clusters.
| Catalyst | Binding energy, eV | |||||
|---|---|---|---|---|---|---|
| Au 4f7/2 | Cu 2p3/2 | Zr 3d5/2 | ||||
| Au− or Au0 in bimetallic particles | Au0 | Auδ+ | Cu+ | Cu2+ | Zr4+ | |
| CeZrOx(2:1) |
— | — | — | — | — | 182.1 |
| CeZrOx(1:1) |
— | — | — | — | — | 182.4 |
| CeZrOx(1:2) |
— | — | — | — | — | 183.0 |
| ZrO2 | — | — | — | — | — | 182.3 |
| Au/CeO2 | — | 83.2 | 85.5 | — | — | — |
| Au/CeZrOx(2:1) |
— | 84.5 | 86.3 | — | — | 182.9 |
| Au/CeZrOx(1:1) |
— | 84.2 | 86.0 | — | — | 182.1 |
| Au/CeZrOx(1:2) |
— | 85.0 | 86.4 | — | — | 183.0 |
| Au/ZrO2 | — | 83.7 | 85.5 | — | — | 181.8 |
| Cu/CeO2 | — | — | — | 933.0 | 934.4 | — |
| Cu/CeZrOx(2:1) |
— | — | — | 933.0 | 934.1 | 183.6 |
| Cu/CeZrOx(1:1) |
— | — | — | 932.0 | 934.8 | 181.6 |
| Cu/CeZrOx(1:2) |
— | — | — | 932.1 | 935.3 | 182.2 |
| Cu/ZrO2 | — | — | — | 932.4 | 934.2 | 181.6 |
| CuAu/CeO2 | — | 83.6 | 85.4 | 932.0 | 934.9 | — |
| CuAu/CeZrOx(2:1) |
82.3 | 83.6 | — | 932.8 | 935.5 | 183.3 |
| CuAu/CeZrOx(1:1) |
82.8 | 84.0 | — | 933.3 | 935.0 | 182.7 |
| CuAu/CeZrOx(1:2) |
83.1 | 84.7 | — | 932.3 | 934.9 | 181.4 |
| CuAu/ZrO2 | — | 83.4 | — | 932.2 | 934.3 | 181.6 |
| Catalyst | Distribution of Ce species, % | Distribution of Cu species, % | Distribution of Au species, % | ||||
|---|---|---|---|---|---|---|---|
| Ce3+ | Ce4+ | Cu+ | Cu2+ | Au− or Au0 in bimetallic particles | Au0 | Auδ+ | |
| CeZrOx(2:1) |
22 | 78 | — | — | — | — | — |
| CeZrOx(1:1) |
21 | 79 | — | — | — | — | — |
| CeZrOx(1:2) |
15 | 85 | — | — | — | — | — |
| Au/CeO2 | 29 | 71 | — | — | 76 | 24 | |
| Au/CeZrOx(2:1) |
20 | 80 | — | — | — | 63 | 37 |
| Au/CeZrOx(1:1) |
24 | 76 | — | — | — | 61 | 39 |
| Au/CeZrOx(1:2) |
34 | 66 | — | — | — | 61 | 39 |
| Au/ZrO2 | — | — | — | — | — | 89 | 11 |
| Cu/CeO2 | 40 | 60 | 58 | 42 | — | — | — |
| Cu/CeZrOx(2:1) |
20 | 80 | 55 | 46 | — | — | — |
| Cu/CeZrOx(1:1) |
44 | 56 | 89 | 11 | — | — | — |
| Cu/CeZrOx(1:2) |
25 | 75 | 42 | 58 | — | — | — |
| Cu/ZrO2 | — | — | 85 | 15 | — | — | — |
| CuAu/CeO2 | 23 | 77 | 83 | 17 | — | 96 | 4 |
| CuAu/CeZrOx(2:1) |
29 | 71 | 77 | 23 | 39 | 61 | — |
| CuAu/CeZrOx(1:1) |
18 | 82 | 91 | 9 | 19 | 81 | — |
| CuAu/CeZrOx(1:2) |
11 | 89 | 34 | 66 | 67 | 33 | — |
| CuAu/ZrO2 | — | — | 86 | 14 | — | 100 | — |
There is a domination of Ce4+ on the surface of all mixed cerium–zirconium oxides (Table 4). The increase in zirconium content in the mixed oxides slightly increased the amount of Ce4+ from 78 to 85%. Modification of the supports with gold affected the distribution of cerium species. A significant increase in the content of cerium in the lower oxidation state (+3) was noted in Au/CeZrOx(1:2) (from 15 to 34%), suggesting the reduction of cerium cations during the modification with auric acid and urea. This reduction of Ce4+ was paralleled by formation of more oxidized gold species (61% of Auδ+).
The distribution of cerium cations on the surface of the supports was also influenced by modification with copper and both copper and gold species. It is difficult to note a simple relationship between the oxidation state of cerium and the chemical composition of the catalysts. However, there is no doubt that copper and gold loading influence the oxidation state of cerium. The reducing environment of the vacuum may contributed in degree of cerium(IV) reduction.
Gold loaded on ceria, zirconia and cerium–zirconium mixed oxides was characterized in the XP spectra by the two spin–orbit components Au 4f7/2 and Au 4f5/2, separated and composed of two doublets attributed to different gold species (examples in Fig. S3†), corresponding to Au0 and Auδ+ species (Table 3).58–63 It is difficult to distinguish different oxidation states in cationic gold on the basis of BE. The value between 85 eV and 86 eV can be attributed to +1 oxidation state whereas the values above 86 eV can characterized the charge transfer in cationic gold with higher oxidation state. Therefore +δ oxidation state is noted in this work, where δ ≥ 1. The BE value was influenced by the chemical composition of the supports. For metallic gold species, the BE changed from 83.2 eV to 85.0 eV. The lowest values of BE were observed if gold was loaded on pure ceria (83.3 eV) and zirconia (83.7 eV). These energies are lower than typical of bulk metallic gold (84.0 eV).64 The lowering of BE can be caused by a decrease in the size of gold particles, as noted in ref. 62.
All monometallic (gold) catalysts presented the domination of metallic gold. The distribution of metallic and cationic gold species was determined by the chemical composition of the supports. The higher amount of metallic gold was noted on pure zirconia and ceria (Table 4). More cationic gold species (Auδ+) were formed on mixed ceria–zirconia supports. Generally, the Auδ+ species were present mainly on the surface of monometallic (Au/support) samples. In bimetallic (Cu–Au/support) materials, cationic gold was observed only on pure ceria but in a very small quantities. The introduction of copper not only decreased or removed cationic gold species, it also increased the amount of metallic gold on pure ceria and zirconia and on mixed ceria–zirconia supports, the latter with enhanced shielding of the core hole. This finding indicates that the existence of reducible copper species in copper–gold catalysts is responsible for enhanced core–hole shielding.12 The species characterized by BE below 83 eV were interpreted by some authors as negatively charged gold on different supports, e.g. ref. 46, 52 and 58. The XP spectra of bimetallic samples in the Au 4f range were characterized by two doublets (with the exception of CuAu/ZrO2), which origin depends on the nature of the supports. In the case of copper–gold loaded on ceria, the species characterized by BE 4f7/2 of 83.6 and 85.4 eV were attributed to Au0 and Auδ+, respectively.
The XP spectra of bimetallic samples in the Au 4f range were characterized by two doublets (with the exception of CuAu/ZrO2), which origin depends on the nature of the supports. In the case of copper–gold loaded on ceria, the species characterized by BE 4f7/2 of 83.6 and 85.4 eV were attributed to Au0 and Auδ+, respectively.
On the mixed cerium–zirconium oxides, besides pure metallic gold (BE in the range of 83.6–84.7 eV) a Au 4f7/2 peak at lower BE (the range of ∼82–83 eV) was observed. CuAu/ZrO2 contained only metallic gold species (the peak at 83.4 eV).
The XPS bands covering the range of 83–85 eV is consistent with a Au0 oxidation state.62,63 The lower binding energy observed for Au0 4f7/2 in the copper–gold catalysts than in monometallic gold catalysts can be attributed to the smaller particle size.63 The lower coordination of gold atoms causes this band to shift,65,66 in agreement with the STEM-EDXS results (Fig. S2†). As concerns the appearance of XP bands in the range of ∼82–83 eV they should be attributed to the changes in electronic structure of the system and core–hole shielding.
The BE of Cu 2p peaks were assigned based on the literature,67,68 to Cu+ (in the range of 932.0–933.0 eV) and Cu2+ (934.1–935.5 eV). All samples containing copper (monometallic and bimetallic), except for Cu/CeZrOx(1:2) and CuAu/CeZrOx(1:2), exhibited the domination of surface Cu+ cations. Notably, the Cu+ content increased in the presence of gold species (except for CuAu/CeZrOx(1:2)). The lower amount of surface Cu+ in CuAu/CeZrOx(1:2) compared to monometallic copper catalyst was accompanied by the growth of gold peaks with BE between 82 and 83 eV indicative of direct interaction between gold and copper.
3.5. Temperature-programmed reduction by hydrogen (H2-TPR)
All components of the catalysts can be reduced by hydrogen. An analysis of gold and copper reduction was made in the temperature range between 373 and 723 K (Fig. 4). In this temperature range the peaks coming from the reduction of cationic gold respectively cationic copper in the 400 to 480 K range are well distinguished. The reduction of cationic gold and copper in bimetallic samples could not be strictly distinguished because the range of the reduction temperatures for both metals is similar and the two metals may affect each other's reduction behavior.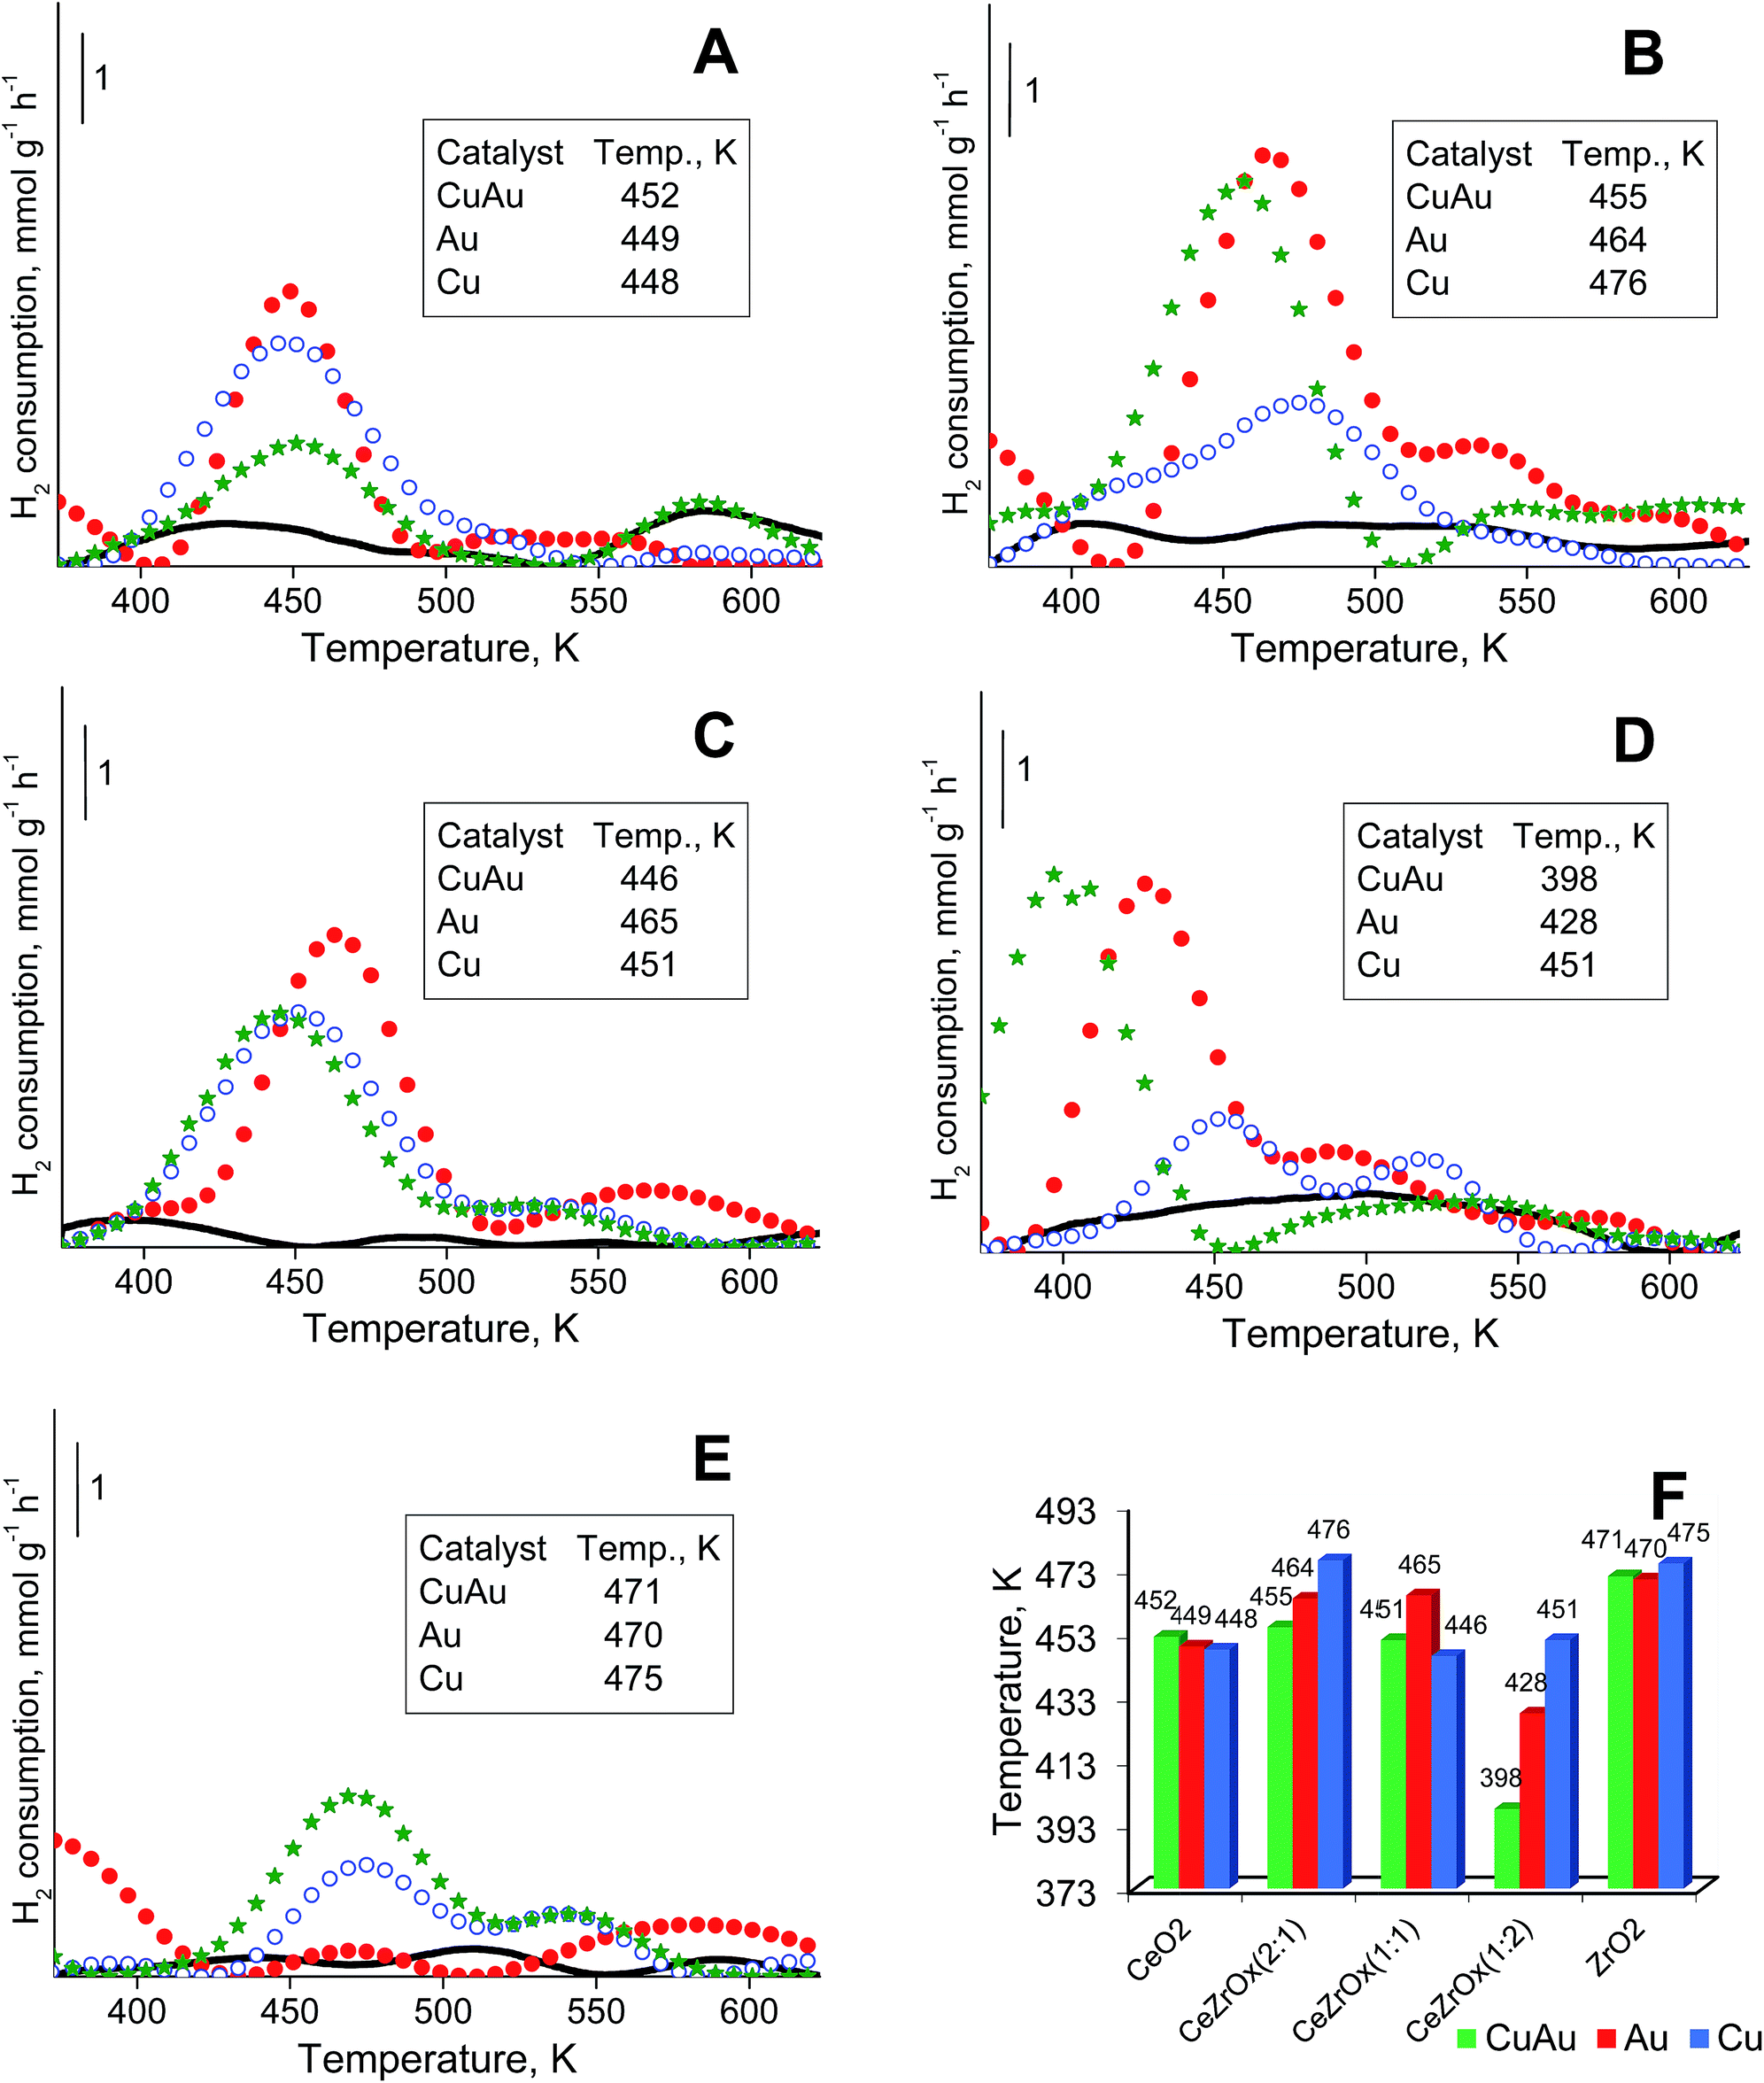 | ||
| Fig. 4 TPR profiles performed for catalysts supported on: [A] CeO2, Au/CeO2, Cu/CeO2 and CuAu/CeO2, [B] CeZrOx(2:1), Au/CeZrOx(2:1), Cu/CeZrOx(2:1) and CuAu/CeZrOx(2:1), [C] CeZrOx(1:1), Au/CeZrOx(1:1), Cu/CeZrOx(1:1) and CuAu/CeZrOx(1:1), [D] CeZrOx(1:2), Au/CeZrOx(1:2), Cu/CeZrOx(1:2) and CuAu/CeZrOx(1:2), [E] ZrO2, Au/ZrO2, Cu/ZrO2 and CuAu/ZrO2, where supports were marked as black solid line (—), Au catalysts – red dotted line (●●●), Cu catalysts – blue dotted line (○○○), Cu–Au catalysts – green stars line (★★★), [F] comparison of the maximum hydrogen consumption during TPR achieved by catalysts modified with Au and/or Cu. | ||
Fig. 4A–E shows the TPR profiles of monometallic gold, copper and bimetallic copper–gold systems loaded on different supports. For simplicity, only the most intense peak, from the reduction of cationic gold and/or copper in the range at ca. 400–480 K, is considered. The position of this peak was almost independent of the composition of modifiers (only copper, only gold or both copper and gold) on ceria (Fig. 4A) or zirconia (Fig. 4E). For mixed cerium–zirconium oxide supports, the reduction temperatures of cationic gold and copper species were determined by the composition of the supports. With increasing zirconium content in the support, the reduction temperatures of copper and gold species were more separated, and generally, they decreased with the increasing content of zirconia in the mixed oxides used. The lowest reduction temperatures were characteristic of metals loaded on CeZrOx(1:2) (Fig. 4F).
This phenomenon indicated a stronger interaction of cationic gold and copper with mixed cerium–zirconium oxides, particularly if the zirconium content was higher. The promoting effect of zirconium was shown in the literature.69,70 Notably, the loading of both copper and gold on the mixed oxides caused a significant decrease in the reduction temperature, particularly evident for CeZrOx(1:2) (a decrease to 398 K). Such a high decrease in the reduction temperature must be influenced not only by the interaction of modifiers with mixed ceria–zirconium oxides but also by the interaction between gold and copper. In the catalysts modified with copper, Cu2+ loaded on oxides of transition metals (ceria, zirconia or mixed cerium–zirconium oxides) was reduced to metallic copper Cu0 below 473 K (in the case of smaller particles of copper(II) oxide) and at approximately 523 K (in the case of larger particles of copper(II) oxide).71 The peaks around 450–475 K can be ascribed mainly to the reduction of copper(II) oxide particles having little or no interaction with the support. This assignment is in agreement with literature data.72,73
The temperatures of bulk copper(II) oxide reduction were reported between 473 and 573 K.70,74 According to the literature75–82 the reducibility of copper(II) oxide loaded on ceria is promoted in the presence of hydrogen. Two reduction peaks in the region described above has been reported by several authors.75,77,78,82 These peaks were attributed to the reduction of copper(II) oxide clusters. The first peak, at a lower temperature, was assigned to nanoclusters strongly interacting with ceria. The second peak, at a higher temperature, was attributed to copper(II) oxide species which were more like bulk oxide, less experiencing with ceria. The different interaction can be explained by the different particle size, the smaller the particle diameter, the higher the extent of interaction and therefore the easier reducibility.81
It is noteworthy that TPR profiles of CuAu/CeO2 and ceria samples (Fig. 4A) show a reduction peak at around 573 K. This indicates that in the case of mesoporous ceria, pure ceria particles can be reduced at around 573 K. In the case of Ce–Zr oxides and pure zirconia, this peak is observed in the samples modified with copper and gold (except CuAu/CeZrOx(1:2), Fig. 4D). It is not observed on the TPR profiles of supports (oxides) (Fig. 4B, C and E). The synergistic interaction between cerium (in the mixed oxides), zirconium (in the case of pure zirconia as support), gold (as Auδ+) and copper (as Cu2+) species leads to lower a reduction temperature of copper.83
Hydrogen consumption above 573 K results from reduction of bulk copper(II) oxide. The temperatures of maximum hydrogen consumption observed in Fig. 4 were significantly lower than that of bulk copper(II) oxide. If small copper(II) oxide particles were loaded on ceria,76,79–81 this support could promote their reduction below 573 K. The reduction of copper oxide clusters, strongly interacting with ceria, occurred in the range 398–448 K, and larger copper(II) oxide particles, non-associated with ceria, were reduced at approximately 473 K.78
Copper(II) oxide–ceria catalysts revealed two maxima of hydrogen consumption: in the range of 423–441 K, assigned to small copper(II) oxide crystallites in contact with ceria, and in the range of 453–498 K, attributed to larger copper(II) oxide particles not in close contact with ceria.76,77 A comparison of temperatures of maximum hydrogen consumption over copper–gold and copper catalysts led to a conclusion that in bimetallic copper–gold samples based on the mixed cerium–zirconium oxides, copper or gold were reduced at lower temperatures than over the analogous monometallic catalysts. This finding confirmed the interaction between copper and gold.
3.6. Catalytic activity – glycerol oxidation in the liquid phase
The challenge in the development of efficient oxidation catalysts is to obtain high activity, selectivity, and stability. Activity and selectivity of gold catalysts in glycerol oxidation are influenced by the nature of the support, which determines the species formed on the surface30,84,85 and the presence of other catalytically active components (e.g. palladium–gold, platinum–gold).13,86 Catalytic glycerol oxidation was performed by stirring at different rates to find the conditions in which diffusion had the least influence on the catalytic reaction (Tables S1 and S2†). The conversion of glycerol increased up to 1000 rpm. Therefore, further experiments were carried out using this stirring speed.Table 5 shows the results of the catalytic oxidation of glycerol at 333 K in a basic aqueous solution under pure oxygen for monometallic and bimetallic catalysts. Copper–gold catalysts were definitely more active than monometallic catalysts under the same reaction conditions. The monometallic catalysts yielded primarily gaseous products. Changes in the copper and gold dispersion and electronic states, relative to those in monometallic ones, play a crucial role in increasing the catalyst activity and selectivity to glyceric acid.87,88 Increase of glycerol conversion with increase of gold dispersion and decrease in selectivity to glyceric acid for small mean gold particle size (e.g. 2.7 nm in ref. 88) were observed. Here, the dispersion of gold and glycerol conversion were higher for bimetallic (gold–copper) catalysts than for monometallic ones. However, contrary to the findings described in literature87,88 for gold catalysts, bimetallic catalysts in this work presented the higher selectivity to glyceric acid despite the small mean gold particle size (<2.7 nm). All copper–gold catalysts were selective primarily towards glyceric acid. Low selectivities to other oxidation products, such as lactic, oxalic, tartronic, glycolic, and formic acids were observed. The oxidation of glycerol to glyceric acid under basic conditions on copper–gold catalysts proceeds via the initial formation of glyceraldehyde, which is rapidly oxidized to glyceric acid.14 Tartronic, C2, and C1 acids indicate over-oxidation or transformation of glyceric acid.
| Catalyst | Conv., % | Selectivity, % | TOFh, h−1 | |||||
|---|---|---|---|---|---|---|---|---|
| TAb | GLAc | LAd | GCAe | FAf | Gaseous productsg | |||
| a Reaction conditions: 5 h, 1000 rpm, 6 atm of oxygen, NaOH/glycerol = 2, 15.00 g of water, 0.120 g of NaOH, 0.138 g of glycerol, 0.0300 g of catalyst.b TA – tartronic acid.c GLA – glyceric acid.d LA – lactic acid.e GCA – glycolic acid.f FA – formic acid.g Gaseous products – CO2 and other gases.h TOF was calculated as the number of glycerol moles reacted on one mole of gold per one hour (calculated from the conversion obtained after 30 min of the reaction in the case of Cu–Au catalysts and after 300 min in the case of Au catalyst). | ||||||||
| Cu/CeO2 | 19 | Traces | 7 | — | 2 | 1 | 90 | — |
| Cu/CeZrOx(2:1) |
31 | — | 9 | — | 2 | 1 | 88 | — |
| Cu/CeZrOx(1:1) |
35 | Traces | 5 | — | 1 | Traces | 94 | — |
| Cu/CeZrOx(1:2) |
28 | Traces | 7 | — | 1 | 1 | 91 | — |
| Cu/ZrO2 | 28 | Traces | 7 | — | 2 | 1 | 90 | — |
| Au/CeO2 | 40 | Traces | 19 | 1 | — | 1 | 79 | 77 |
| Au/CeZrOx(2:1) |
35 | Traces | 10 | Traces | — | Traces | 90 | 63 |
| Au/CeZrOx(1:1) |
35 | Traces | 6 | — | — | — | 94 | 71 |
| Au/CeZrOx(1:2) |
15 | Traces | 7 | — | — | — | 93 | 30 |
| Au/ZrO2 | 30 | Traces | 5 | — | — | — | 95 | 98 |
| CuAu/CeO2 | 72 | — | 68 | — | 17 | 16 | — | 667 |
| CuAu/CeZrOx(2:1) |
83 | — | 65 | — | 14 | 21 | — | 838 |
| CuAu/CeZrOx(1:1) |
80 | — | 79 | — | 7 | 14 | — | 618 |
| CuAu/CeZrOx(1:2) |
87 | — | 68 | — | 6 | 11 | 15 | 901 |
| CuAu/ZrO2 | 80 | — | 70 | — | 11 | 16 | 3 | 1236 |
In the bimetallic system, gold and copper were in close proximity, therefore, the interaction between them made the interaction with reagents more effective. The activity and selectivity of copper–gold catalysts were also influenced by the chemical composition of the supports. The highest selectivity to glyceric acid was observed for CuAu/CeZrOx(1:1). In this catalyst, the microporosity was negligible, and therefore, the diffusion of the primary product, glyceric acid, was easy, preventing capturing the intermediates and preventing over-oxidation.
Among bimetallic catalysts TOF was the highest on CuAu/ZrO2 than on the rest of bimetallic catalysts (Table 5). This catalyst had the smallest gold particles (average size 1.6 nm), exclusively metallic gold species and a domination of Cu+ cations. Thus, such metallic species will be considered in the drawing of the reaction pathway at the end of this section. The best gold catalysts based on carbon or different metal oxides described in the literature as catalysts attractive for glycerol oxidation exhibited similar or lower TOF than CuAu/ZrO2. Table S3† collects the best TOF data from the literature28,62,89,90 in which the conditions of glycerol oxidation were similar to those applied in this work. The bimetallic catalysts achieved higher TOFs than monometallic gold catalysts (Table 5), explained by the crucial role of the interaction between gold and copper in the activation of glycerol adsorption and then its oxidation.
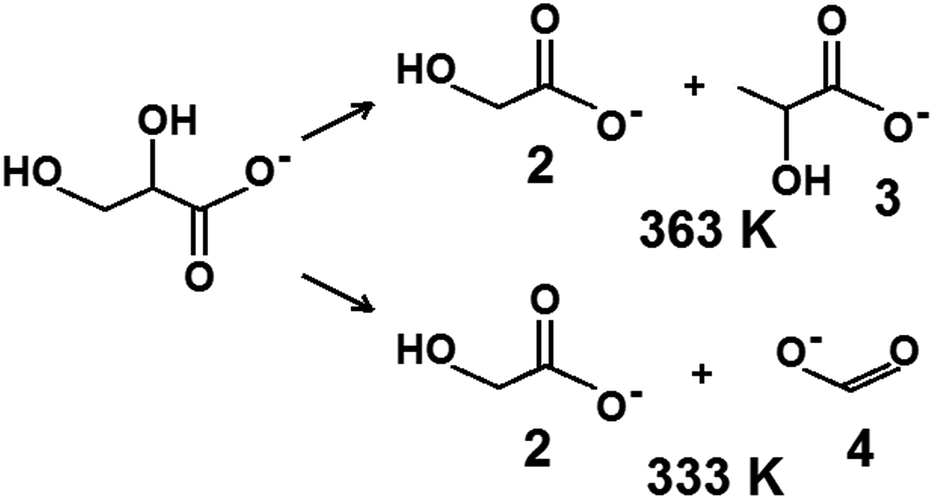 | ||
| Scheme 1 Main products of glycerol oxidation over Cu–Au catalysts at basic condition (pH = 14) at 333 K and 363 K where (1) glycerolate, (2) glycolate, (3) lactate, (4) formate. | ||
At 363 K, the monometallic gold catalysts showed high glycerol conversion on Au/CeO2, but much lower on Au/ZrO2, yielding selectivity to glyceric acid and lactic acid and to a relatively small amount of formic acid (Table S1†). On copper catalysts (Table S2†), in addition to glyceric acid, glycolic and formic acids were formed in high yields at 363 K. This behavior indicated that copper species were responsible for the dehydration of the primary product, glyceric acid, whereas in the presence of gold-active centers, glyceric acid was formed and transformed to lactic acid at a higher temperature.
:2) exhibited the highest conversion in glycerol oxidation at 333 K after 5 h, at 1000 rpm. Over this catalyst, the oxygen consumption in the reaction was the smallest. After 150 min of the reaction over cerium–zirconium oxides modified with copper and gold, the oxygen consumption was smaller than over CuAu/CeO2 and CuAu/ZrO2.
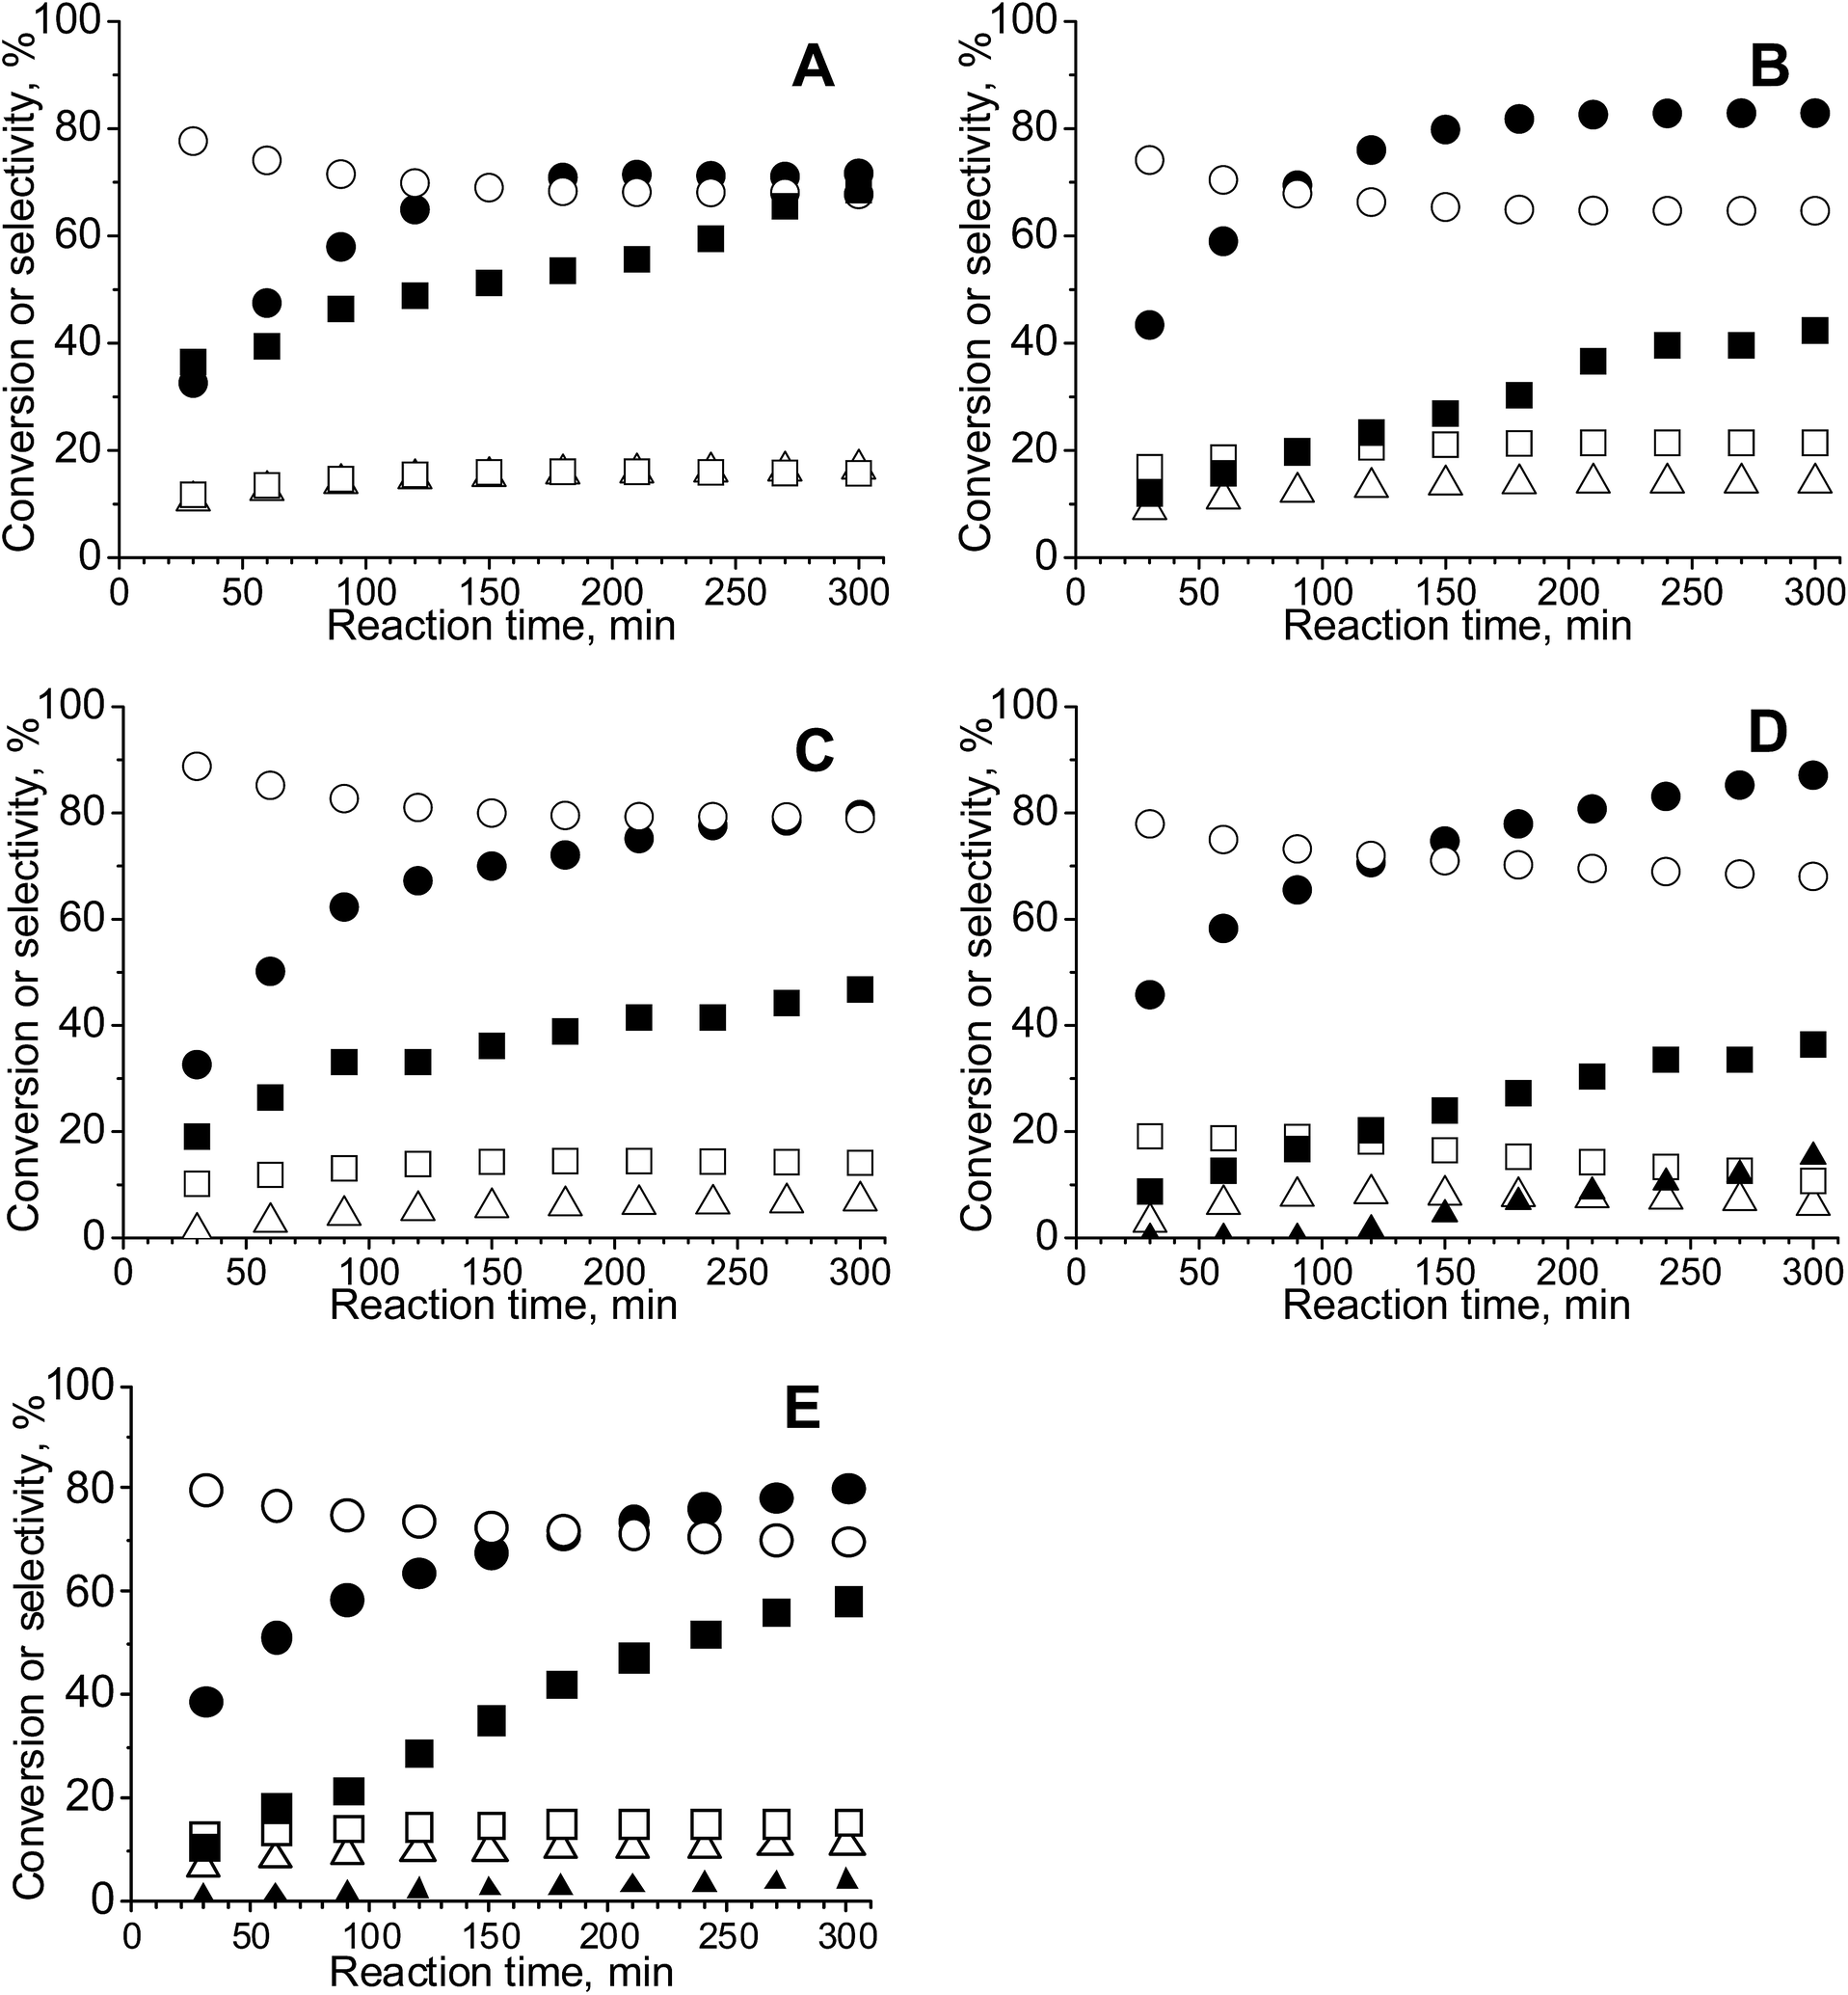 | ||
| Fig. 5 Conversion and selectivity during the reaction of glycerol oxidation at 333 K for 5 h at 1000 rpm over bimetallic catalysts: (A) – CuAu/CeO2; (B) – CuAu/CeZrOx(2:1); (C) – CuAu/CeZrOx(1:1); (D) – CuAu/CeZrOx(1:2) and (E) – CuAu/ZrO2, where: ● – conversion; selectivity to: ○ – glyceric acid; Δ – glycolic acid; □ – formic acid; ▲ – gaseous products; ■ – oxygen consumption. | ||
Between 30 and 300 min reaction, the molar ratio oxygen:glycerol was always higher than 3.5 for all copper–gold catalysts, but this parameter changed linearly from 7 after 30 min to 21 after 300 min (Fig. S4†). At the beginning, the molar ratio oxygen:glycerol increased over all bimetallic catalysts, but after 180 min, for CuAu/CeO2 and CuAu/CeZrOx(2:1), this value decreased from 6 to 4 and from 16 to 14, respectively.
The reaction profiles (Fig. 5) indicated that after 2 h of the reaction, ca. 60–80% of glycerol was converted; then, the conversion leveled off. The high selectivity to glyceric acid in the initial stages of the reaction indicated that it was formed in the first step of the reaction. Formic and glycolic acid were also detected, but the selectivity to these compounds increased slowly during the reaction and decreased when the concentration of carbon dioxide increased.
The most active bimetallic catalysts were stable and glycerol conversion in the second cycle of the reaction was not considerably changed. It is characteristic that at constant activity, the selectivity to glyceric acid increased in the second reaction cycle performed over bimetallic catalysts based on zirconia and cerium–zirconium mixed oxides rich in zirconium. This phenomenon suggested changes in the catalyst surface during reaction.
The possibility of reusing catalysts without the loss of activity is very important. Fig. 6 shows the results of the experiments in which the catalysts were reused in the reaction at 333 K and a stirring speed of 1000 rpm. The catalyst used in the first reaction cycle was recovered by decantation of the solvent after the reaction and was reused without any washing or drying.
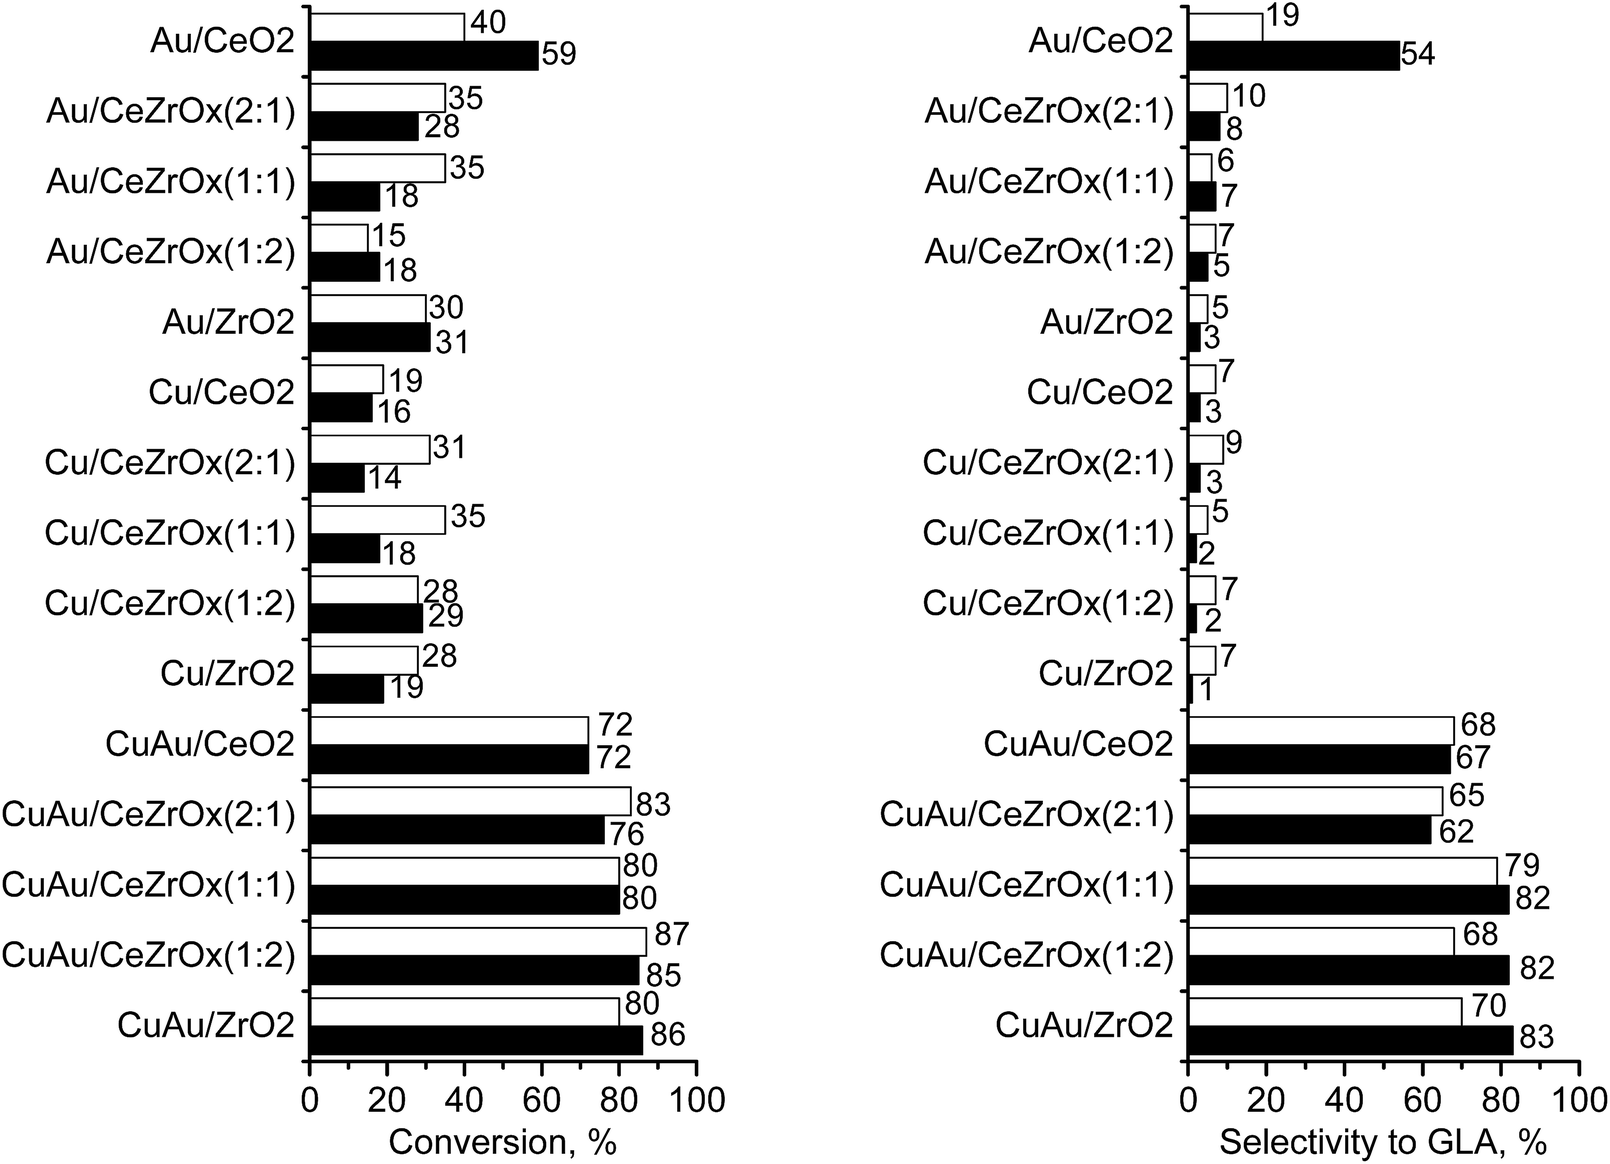 | ||
| Fig. 6 Glycerol conversion (left side) and selectivity to glyceric acid (GLA) (right side) in the oxidation under stirring speed of 1000 rpm in the 1st (white bars) and the 2nd (black bars) cycle of the reaction performed at 333 K for 5 h. | ||
The increase in glyceric acid selectivity in the second cycle was highly desirable. The highest glycerol conversion was achieved by CuAu/CeZrOx(1:2) in the first cycle (87%), whereas the highest selectivity to glyceric acid was reached on CuAu/ZrO2 in the second cycle (83%). Notably, CuAu/CeZrOx(1:2) material contained the lowest content of Cu+ species and the highest amount of bimetallic particles. The increase of GLA selectivity was considered in the context of metal leaching during the first reaction. Table S5† shows the amount of copper and gold in the catalysts after the second reaction. It is clear that zirconium strongly hold copper species and therefore leaching of copper did not occur for CuAu/CeZrOx(1:2). In contrast, for this sample gold was partially leached. This behaviour led to the increase of Cu:Au molar ratio which caused the increase of selectivity to GLA. On the basis of the results obtained within this work the reaction pathway of the glycerol oxidation to glyceric acid performed on bimetallic (Cu–Au) catalysts based on metal oxides used in this work was proposed (Scheme 2). Only the initial stages of the reaction are documented in the results obtained within this work. The following steps are hypothetic. On the basis of the highest TOF obtained on CuAu/ZrO2 which contained only metallic gold and almost exclusively Cu+ cations, Au0 particles and Cu+ are proposed as active centres at the beginning of the reaction.
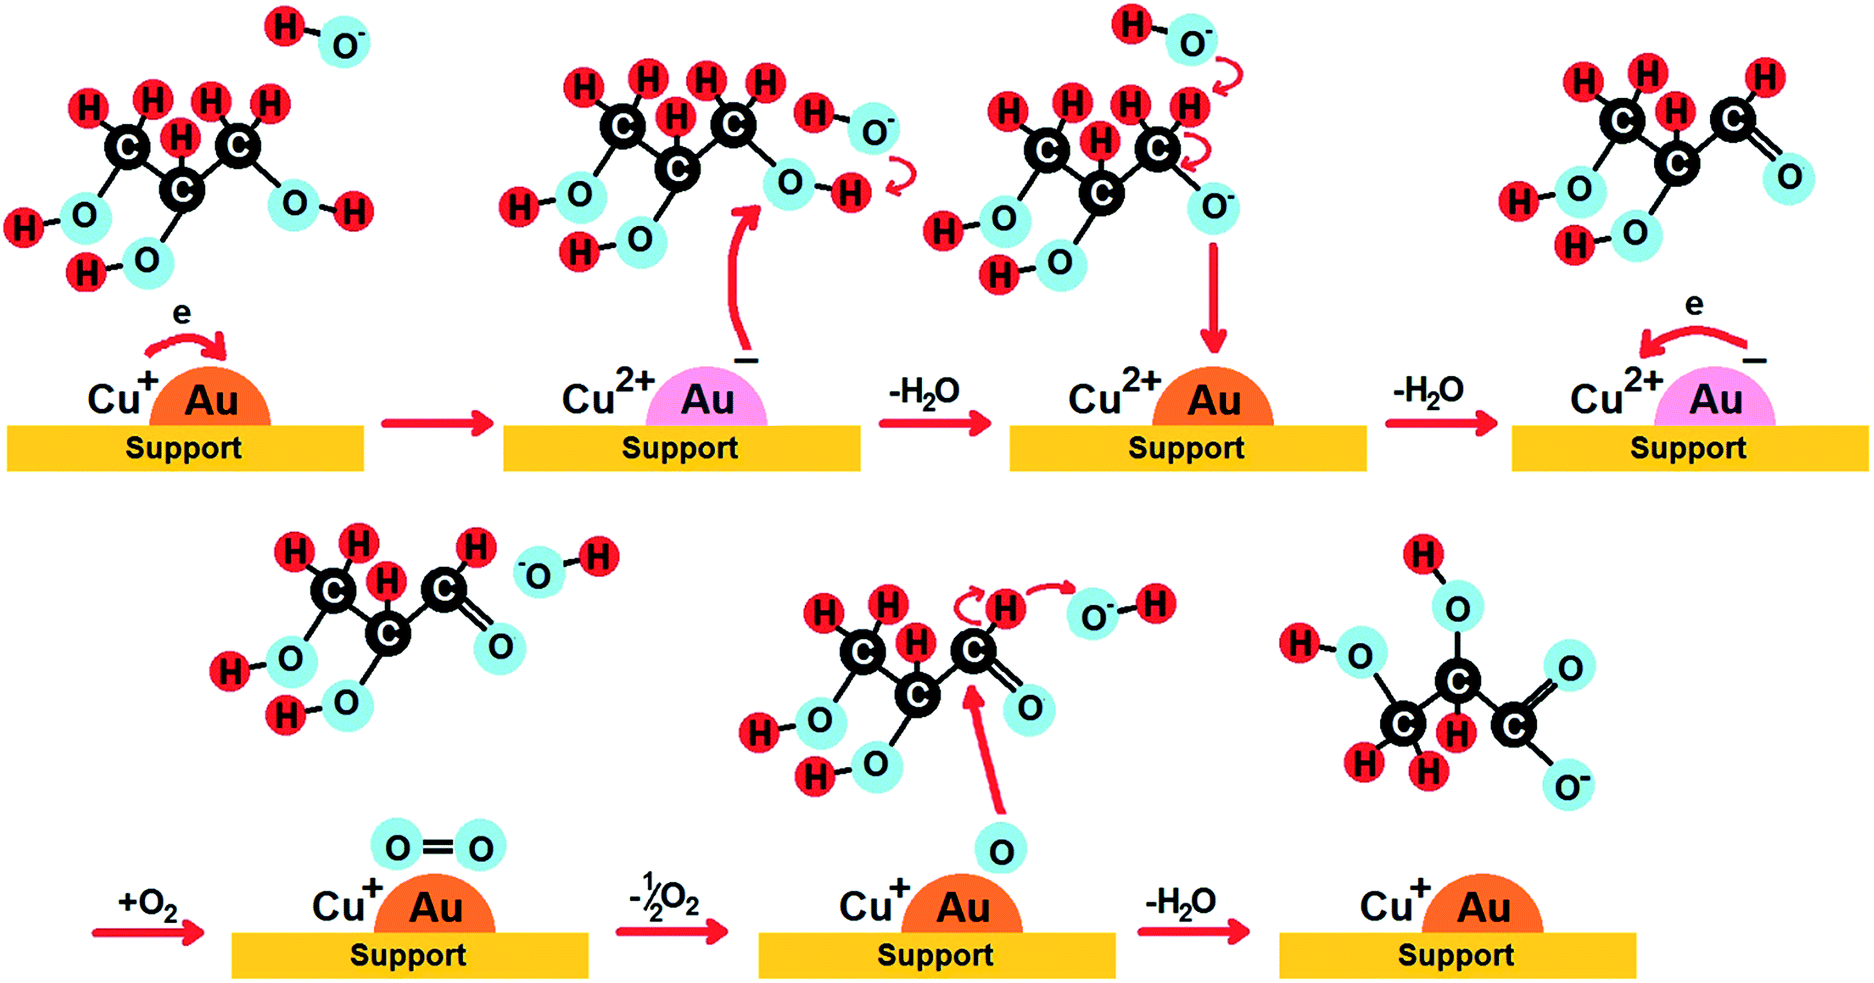 | ||
| Scheme 2 Proposed scheme for the formation of glyceric acid on bimetallic catalysts supported on cerium and zirconium oxides. | ||
In the proposed reaction cycle the different surface gold and copper species are involved. Moreover, the role of the hydroxyl groups from the reaction medium are pointed out. Hydroxide anions from sodium hydroxide initiate the dehydrogenation via H-abstraction of one of the primary OH groups of glycerol according to the literature data.33 This is enhanced by the interaction of negative charge on gold formed by an electron transfer from Cu+ species. The following electron transfers from the aldehyde ion to Au0 and from gold containing negative charge to Cu2+ result in the rebuilding the primary metal species on the surface. In the next step oxygen is dissociatively chemisorbed on metallic gold particle, hydrogen from aldehyde group is abstracted by hydroxyls from the reaction medium and glyceric acid ion is formed. Scheme 2 indicates the crucial role of the electron transfer between the following pairs of copper and gold species: (i) Cu+ and Au0 or (ii) Cu2+ and Au−. The catalysts exhibiting the highest TOF values, i.e. CuAu/ZrO2 (TOF = 1236 h−1) and CuAu/CeZrOx(1:2) (TOF = 901 h−1), contain the highest amount of Cu+ (86%) – Au0 (100%) and Cu2+ (66%) – Au− (67%), respectively. In the other bimetallic catalysts the dominant species of copper and gold are Cu+ and Au0 (Table 4) between which the electron transfer does not occur. Such catalysts reveal lower TOF values.
4. Conclusions
All catalysts obtained within this work were mesoporous oxides containing also micropores and the microporosity increases with increasing zirconium content in the supports. It was evidenced the presence of gold species in the metallic form Au0, cationic Auδ+ and negatively charged gold, the latter only in bimetallic copper–gold, catalysts. Moreover, the presence of cationic copper species, Cu+ and Cu2+ were evidenced. The interaction between all the components of the catalysts was evidenced and its role in the initial step of the catalytic oxidation of glycerol was discussed.Bimetallic gold–copper catalysts were significantly more active in glycerol oxidation than the respective monometallic samples and they were highly selective to glyceric acid. High gold dispersion in bimetallic catalysts was supposed to be responsible for high glycerol conversion but negative charge on gold seemed to enhance the activity. Cu+ species played an important role in the achievement of high selectivity to glyceric acid. The bimetallic catalysts were chemically stable. They were proved to be active in reuse and to show higher selectivity to glyceric acid than in the first run.
On the basis of the characterization of the catalysts and the results of glycerol oxidation, one can postulate that metallic gold was the active phase in the oxidation of glycerol, whereas copper species drive the selectivity of the reaction. The presence of copper also increased the rate of the first reaction step, i.e. the H-abstraction from glycerol molecules. Moreover, gold interacted with copper located in vicinity by electron transfer from Cu+ to metallic gold or from Au− to Cu2+. The electron transfer between the aforementioned metal species is crucial in the reaction steps of glycerol oxidation (Scheme 2). Therefore, for high reaction rate the high content of above indicated pairs of metal species (Cu+–Au0 and Cu2+–Au−) is required. The interaction of gold and copper species with the supports also influenced the types of metallic species formed and therefore the chemical composition of the supports played an important role in the catalytic activity and selectivity.
Acknowledgements
We acknowledge the National Science Centre in Poland for the financial support (project No. 2014/13/N/ST5/01282) and P. K. is thankful for the financial support of the Scientific Exchange Programme Sciex-NMS Ch (project No. 12.258). We are much grateful to Dr Frank Krumeich and the Electron Microscopy Centre of ETH Zürich (EMEZ) for the STEM-EDXS measurements.References
- A. Aguirre, C. E. Barrios, A. Aguilar-Tapia, R. Zanella, M. A. Baltanás and S. E. Collins, Top. Catal., 2016, 59, 347–356 CrossRef CAS.
- N. Sasirekha, P. Sangeetha and Y.-W. Chen, J. Phys. Chem. C, 2014, 118, 15226–15233 CAS.
- Y. Iizuka, T. Miyamae, T. Miura, M. Okumura, M. Date and M. Haruta, J. Catal., 2009, 262, 280–286 CrossRef CAS.
- X. Liu, A. Wang, T. Zhang, D. S. Su and C. Y. Mou, Catal. Today, 2011, 160, 103–108 CrossRef CAS.
- X. Liu, A. Wang, L. Li, T. Zhang, C.-Y. Mou and J.-F. Lee, J. Catal., 2011, 278, 288–296 CrossRef CAS.
- A. Penkova, K. Chakarova, O. H. Laguna, K. Hadjiivanov, F. Romero Saria, M. A. Centeno and J. A. Odriozola, Catal. Commun., 2009, 10, 1196–1202 CrossRef CAS.
- T. Déronzier, F. Morfin, M. Lomello and J.-L. Rousset, J. Catal., 2014, 311, 221–229 CrossRef.
- S. Rousseau, O. Marie, P. Bazin, M. Daturi, S. Verdier and V. Harle, J. Am. Chem. Soc., 2010, 132(31), 10832–10841 CrossRef CAS PubMed.
- J. C. Colmenares, P. Lisowski, D. Łomot, O. Chernyayeva and D. Lisovytskiy, ChemSusChem, 2015, 8, 1676–1685 CrossRef CAS PubMed.
- I. Sobczak and E. Dembowiak, J. Mol. Catal. A: Chem., 2015, 409, 137–148 CrossRef CAS.
- P. Kaminski and M. Ziolek, J. Catal., 2014, 312, 249–262 CrossRef CAS.
- I. Sobczak and Ł. Wolski, Catal. Today, 2015, 254, 72–82 CrossRef CAS.
- W. C. Ketchie, M. Murayama and R. J. Davis, J. Catal., 2007, 250, 264–273 CrossRef CAS.
- A. A. Rodriguez, C. T. Williams and J. R. Monnier, Appl. Catal., A, 2014, 475, 161–168 CrossRef CAS.
- L. E. Chinchilla, C. M. Olmos, A. Villa, A. Carlsson, L. Prati, X. Chen, G. Blanco, J. J. Calvino and A. B. Hungria, Catal. Today, 2015, 253, 178–189 CrossRef CAS.
- A. Villa, N. Dimitratos, C. E. Chan-Thaw, C. Hammond, L. Prati and G. J. Hutchings, Acc. Chem. Res., 2015, 48, 1403–1412 CrossRef CAS PubMed.
- H. Wang, C. Wang, H. Yan, H. Yi and J. Lu, J. Catal., 2015, 324, 59–68 CrossRef CAS.
- G. J. Hutchings, Catal. Today, 2014, 238, 69–73 CrossRef CAS.
- Z. Zhao, J. Arentz, L. A. Pretzer, P. Limpornpipat, J. M. Clomburg, R. Gonzalez, N. M. Schweitzer, T. Wu, J. T. Miller and M. S. Wong, Chem. Sci., 2014, 5, 3715–3728 RSC.
- R. Fiorenza, C. Crisafulli, G. G. Condorelli, F. Lupo and S. Scirè, Catal. Lett., 2015, 145, 1691–1702 CrossRef CAS.
- P. Kaminski, I. Sobczak, P. Decyk, M. Ziolek, W. J. Roth, B. Campo and M. Daturi, J. Phys. Chem. C, 2013, 117, 2147–2159 CAS.
- P. Kaminski, M. Ziolek, B. Campo and M. Daturi, Catal. Today, 2015, 243, 218–227 CrossRef CAS.
- P. Kaminski and M. Ziolek, Appl. Catal., B, 2016, 187, 328–341 CrossRef CAS.
- M. Ozawa, M. Kimura and A. Isogai, J. Alloys Compd., 1993, 193, 73–75 CrossRef CAS.
- A. Trovarelli and P. Fornasiero, Catalysis by ceria and related materials, ed. G. J. Hutchings, Imperial College Press, London, 2013, vol. 12, pp. 15–32 Search PubMed.
- M. Pijolat, M. Prin, M. Soustelle, O. Touret and P. Nortier, J. Chem. Soc., Faraday Trans., 1995, 91, 3941–3948 RSC.
- E. G. Rodrigues, M. F. R. Pereira, J. J. Delgado, X. Chen and J. J. M. Órfão, Catal. Commun., 2011, 16, 64–69 CrossRef CAS.
- A. Villa, A. Gaiassi, I. Rossetti, C. L. Bianchi, K. van Benthem, G. M. Veith and L. Prati, J. Catal., 2010, 275, 108–116 CrossRef CAS.
- S.-S. Liu, K.-Q. Sun and B.-Q. Xu, ACS Catal., 2014, 4, 2226–2230 CrossRef CAS.
- W. C. Ketchie, M. Murayama and R. J. Davis, Top. Catal., 2007, 44, 307–317 CrossRef CAS.
- Y. Zheng, X. Chen and Y. Shen, Chem. Rev., 2008, 108, 5253–5277 CrossRef CAS PubMed.
- S. A. Kondrat, P. J. Miedziak, M. Douthwaite, G. L. Brett, T. E. Davies, D. J. Morgan, J. K. Edwards, D. W. Knight, C. J. Kiely, S. H. Taylor and G. J. Hutching, ChemSusChem, 2014, 7, 1326–1334 CrossRef CAS PubMed.
- S. Carrettin, P. McMorn, P. Johnston, K. Griffin, C. J. Kiely and G. J. Hutchings, Phys. Chem. Chem. Phys., 2003, 5, 1329–1336 RSC.
- E. Skrzyńska, J. Ftouni, A.-S. Mamede, A. Addad, M. Trentesaux, J.-S. Girardon, M. Capron and F. Dumeignil, et al., J. Mol. Catal. A: Chem., 2014, 382, 71–78 CrossRef.
- L. Prati, P. Spontoni and A. Gaiassi, Top. Catal., 2009, 52, 288–296 CrossRef CAS.
- M. Hosseini, S. Siffert, R. Cousin, A. Aboukaïs, Z. Hadj-Sadok and B.-L. Su, C. R. Chim., 2009, 12, 654–659 CrossRef CAS.
- H. L. Tidahy, S. Siffert, J.-F. Lamonier, E. A. Zhilinskaya, A. Aboukaïs, Z.-Y. Yuan, A. Vantomme, B.-L. Su, X. Canet, G. De Weireld, M. Frère, T. B. N'Guyen, J.-M. Giraudon and G. Leclercq, Appl. Catal., A, 2006, 310, 61–69 CrossRef CAS.
- V. Idakiev, T. Tabakova, A. Naydenov, Z.-Y. Yuan and B.-L. Su, Appl. Catal., B, 2006, 63, 178–186 CrossRef CAS.
- D. Andreeva, L. Ilieva, V. Idakiev, J. L. Blin, L. Gigot and B.-L. Su, Appl. Catal., A, 2003, 243, 25–39 CrossRef.
- E. Smolentseva, A. Simakov, S. Beloshapkin, M. Estrada, E. Vargas, V. Sobolev, R. Kenzhin and S. Fuentes, Appl. Catal., B, 2012, 115–116, 117–128 CrossRef CAS.
- R. Zanella, S. Giorgio, C. R. Henry and C. Louis, J. Phys. Chem. B, 2002, 106, 7634–7642 CrossRef CAS.
- R. Zanella, L. Delannoy and C. Louis, Appl. Catal., A, 2005, 291, 62–72 CrossRef CAS.
- M. Yashima and T. Wakita, Appl. Phys. Lett., 2009, 94, 171902 CrossRef.
- L. F. Liotta, G. Pantaleo, F. Puleo and A. M. Venezia, Catal. Today, 2012, 187, 10–19 CrossRef CAS.
- A.-Q. Wang, Y.-P. Hsieh, Y.-F. Chen and C.-Y. Mou, J. Catal., 2006, 237, 197–206 CrossRef CAS.
- A.-Q. Wang, J.-H. Liu, S.-D. Lin, T.-S. Lin and C.-Y. Mou, J. Catal., 2005, 233, 186–197 CrossRef CAS.
- L. Escamilla-Perea, R. Nava, B. Pawelec, M. G. Rosmaninho, C.-L. Peza-Ledesma and J. L. G. Fierro, Appl. Catal., A, 2010, 381, 42–53 CrossRef CAS.
- L. F. Chen, X. L. Zhou, L. E. Norena, J. A. Wang, J. Navarrete, P. Salas, A. Montoya and P. Del Angel, J. Solid State Chem., 2007, 180, 2958–2972 CrossRef CAS.
- E. Rodriguez-Castellon, A. Jimenez-Lopez, P. Marireles-Torres, D. J. Jones, J. Roziere, M. Trombetta, G. Busca, M. Lenarda and L. Storaro, J. Solid State Chem., 2003, 175, 159–169 CrossRef CAS.
- J. Goscianska, M. Ziolek, E. Gibson and M. Daturi, Catal. Today, 2010, 152, 33–41 CrossRef CAS.
- Metal Nanoparticles. Synthesis, Characterization and Applications, ed. D. L. Feldheim and C. A. Foss, B. M. Dekker, Inc., New York, 2002 Search PubMed.
- I. Tuzovskaya, N. Bogdanchikova, A. Simakov, V. Gurin, A. Pestryakov, M. Avalos and M. H. Farias, Chem. Phys., 2007, 338, 23–32 CrossRef CAS.
- S. Velu, K. Suzuki, M. Okazaki, M. P. Kapoor, T. Osaki and F. J. Ohashi, J. Catal., 2000, 194, 373–384 CrossRef CAS.
- A. Kong, H. Wang, X. Yang, Y. Hou and Y. Shan, Microporous Mesoporous Mater., 2009, 118, 348–353 CrossRef CAS.
- C. M. Chanquia, K. Sapag, E. Rodriguez-Castellon, E. R. Herrero and G. A. J. Eimer, J. Phys. Chem. C, 2010, 114, 1481–1490 CAS.
- G. Águila, F. Gracia, J. Cortés and P. Araya, Appl. Catal., B, 2008, 77, 325–338 CrossRef.
- H. Praliaud, S. Mikhailenko, Z. Chajar and M. Primet, Appl. Catal., B, 1998, 16, 359–374 CrossRef CAS.
- F.-W. Chang, H.-Y. Yu, L. S. Roselin, H.-C. Yang and T.-C. Ou, Appl. Catal., A, 2006, 302, 157–167 CrossRef CAS.
- N. Bogdanchikova, A. Pestryakov, I. Tuzovskaya, T. A. Zepeda, M. H. Farias, H. Tiznado and O. Martynyuk, Fuel, 2013, 110, 40–47 CrossRef CAS.
- J. Hua, K. Wie, Q. Zheng and Z. Lin, Appl. Catal., A, 2004, 259, 121–130 CrossRef CAS.
- A. Zwijnenburg, A. Goosens, W. G. Sloof, M. W. J. Graje, A. M. Kraan, L. J. Jongth, M. Makee and J. A. Moulijn, J. Phys. Chem. B, 2002, 106, 9853–9862 CrossRef CAS.
- N. Dimitratos, A. Villa, C. L. Bianchi, L. Prati and M. Makkee, Appl. Catal., A, 2006, 311, 185–192 CrossRef CAS.
- S. Albonetti, T. Pasini, A. Lolli, M. Blosi, M. Piccinini, N. Dimitratos, J. A. Lopez-Sanchez, D. J. Morgan, A. F. Carley, G. J. Hutchings and F. Cavani, Catal. Today, 2012, 195, 120–126 CrossRef CAS.
- J. Xu, T. White, P. Li, C. He, J. Yu, W. Yuan and Y.-F. Han, J. Am. Chem. Soc., 2010, 132, 10398–10406 CrossRef CAS PubMed.
- O. A. Simakova, E. Smolentseva, M. Estrada, E. V. Murzina, S. Beloshapkin, S. M. Willför, A. V. Simakov and D. Y. Murzin, J. Catal., 2012, 291, 95–103 CrossRef CAS.
- R. J. Chimentão, F. Medina, J. L. G. Fierro, J. Llorca, J. E. Sueiras, Y. Cesteros and P. Salagre, J. Mol. Catal. A: Chem., 2007, 274, 159–168 CrossRef.
- J. Liorca, M. Domínguez, C. Ledesma, R. J. Chimentão, F. Medina, J. Sueiras, I. Angurell, M. Seco and O. Rossell, J. Catal., 2008, 258, 187–198 CrossRef.
- A. Gupta, U. V. Waghmare and M. S. Hegde, Chem. Mater., 2010, 22, 5184–5198 CrossRef CAS.
- L. H. Reddy, G. K. Reddy, D. Devaiah and B. M. Reddy, Appl. Catal., A, 2012, 445–446, 297–305 CrossRef CAS.
- G. Fierro, M. L. Jacono, M. Inversi, P. Porta, R. Lavecchia and F. Cioci, J. Catal., 1994, 148, 709–721 CrossRef CAS.
- O. V. Komova, A. V. Simakov, V. A Rogov, D. I. Kochubei, G. V. Odegova, V. V. Kriventsov, E. A. Paukshtis, V. A. Ushakov, N. N. Sazonova and T. A. Nikoro, J. Mol. Catal. A: Chem., 2000, 161, 191–204 CrossRef CAS.
- F. Boccuzzi, A. Chiorino, G. Martra, M. Gargano, N. Ravasio and B. Carrozziniz, J. Catal., 1997, 165, 129–139 CrossRef CAS.
- B. Thirupathi and P. G. Smirniotis, Appl. Catal., B, 2011, 110, 195–206 CrossRef CAS.
- S. Scire, P. M. Riccobene and C. Crisafulli, Appl. Catal., B, 2010, 101, 109–117 CrossRef CAS.
- T. Tabakova, F. Boccuzzi, M. Manzoli, J. W. Sobczak, V. Idakiev and A. Andreeva, Appl. Catal., A, 2006, 298, 127–143 CrossRef CAS.
- G. Avgouropoulos and T. Ioannides, Appl. Catal., A, 2003, 244, 155–167 CrossRef CAS.
- L. J. Kundakovic and M. Flytzani-Stephanopoulos, Appl. Catal., A, 1998, 171, 13–29 CrossRef CAS.
- W. Liu and M. Flytzani-Stephanopoulos, Chem. Eng. J., 1996, 64, 283–294 CAS.
- X. Jiang, G. Lu, R. Zhou, J. Mao, Y. Chen and X. Zheng, Appl. Surf. Sci., 2001, 173, 208–220 CrossRef.
- J. B. Wang, S.-C. Lin and T.-J. Huang, Appl. Catal., A, 2002, 232, 107–120 CrossRef CAS.
- S. Zhang, W. Huang, X. Qiu, B. Li, X. Zheng and S. Wu, Catal. Lett., 2002, 80, 41–46 CrossRef CAS.
- M.-F. Luo, Y.-J. Zhong, X.-X. Yuan and X.-M. Zheng, Appl. Catal., A, 1997, 162, 121–131 CrossRef CAS.
- A. Gupta, U. V. Waghmare and M. S. Hegde, Chem. Mater., 2010, 22, 5184–5198 CrossRef CAS.
- S. Demirel, P. Kern, M. Lucas and P. Claus, Catal. Today, 2007, 122, 292–300 CrossRef CAS.
- A. Villa, G. M. Veith and L. Prati, Angew. Chem., Int. Ed., 2010, 49, 4499–4502 CrossRef CAS PubMed.
- A. Behr, J. Eilting, K. Irawadi, J. Leschinski and F. Linder, Green Chem., 2008, 10, 13–30 RSC.
- W. C. Ketchie, Y.-L. Fang, M. S. Wong, M. Murayama and R. J. Davis, J. Catal., 2007, 250, 94–101 CrossRef CAS.
- Y. Zheng, X. Chen and Y. Shen, Chem. Rev., 2008, 108, 5253–5277 CrossRef CAS PubMed.
- A. Villa, G. M. Veith, D. Ferri, A. Weidenkaff, K. A. Perry, S. Campisi and L. Prati, Catal. Sci. Technol., 2013, 3, 394–399 CAS.
- A. Villa, D. Wang, G. M. Veith, F. Vindignid and L. Prati, Catal. Sci. Technol., 2013, 3, 3036–3041 CAS.
Footnote |
| † Electronic supplementary information (ESI) available. See DOI: 10.1039/c6ra27671g |
| This journal is © The Royal Society of Chemistry 2017 |