
 Open Access Article
 This Open Access Article is licensed under a
 Creative Commons Attribution 3.0 Unported Licence
Low-temperature solution synthesis of CuO/Cu2O nanostructures for enhanced photocatalytic activity with added H2O2: synergistic effect and mechanism insight†
Xiaolong Deng ,
Chenggang Wang,
Minghui Shao,
Xijin Xu* and
Jinzhao Huang*
,
Chenggang Wang,
Minghui Shao,
Xijin Xu* and
Jinzhao Huang*
School of Physics and Technology, University of Jinan, 336 Nanxin Zhuang West Road, Jinan, Shandong Province 250022, People's Republic of China. E-mail: sps_xuxj@ujn.edu.cn; ss_huangjinzhao@ujn.edu.cn
First published on 16th January 2017
Abstract
CuxO (CuO, CuO/Cu2O, and Cu2O) nanostructures have been controllably synthesized through a facile low-temperature solution method. The morphologies and compositions of CuxO nanostructures were well controlled by tuning the reductant amount of hydroxylamine hydrochloride, which experienced the transformation of nanosheets to octahedrons as well as the phase change of CuO to Cu2O. The as-grown samples showed photodegradation selectivity to MO (maximum photocatalytic efficiency of 52% for methyl orange (MO) and 16% for rhodamine B (RhB) after 180 min photodegradation) and different photocatalytic activities in the absence or presence of H2O2 (62% without H2O2 and 82% with H2O2). The morphological transformations of as-grown samples were observed after the photocatalytic measurement in the presence of H2O2. The structural and morphological features after photodegradation were studied by XPS, SEM, and TEM investigations, revealing the possible mechanism of the as-prepared samples whereby the photodegradation of organic dyes occurred on the surface with respect to the adsorption ability, structure, and morphology of CuxO. In addition, H2O2 played an important role in the photodegradation of organic dyes.
1. Introduction
Environmental pollution induced by the remarkable developments of industry, especially wastewater generated by organic dye pollutants, has become one of the most detrimental issues for the sustainable development of human beings.1–4 Therefore, it is very meaningful to explore efficient photocatalysts for environmental applications such as wastewater treatment.5,6 In view of visible light covering the main band of solar light, the photocatalysts driven by visible light generate highly efficient photocatalytic activity due to the better utilization of available solar irradiation (λ ≥ 400 nm).6–8 Among them, photocatalysts with a narrow bandgap have attracted considerable attention due to the abilities of these photocatalysts to sufficiently utilize the available solar irradiation (λ ≥ 400 nm).6–8 Herein, discovering new photocatalytic materials with small bandgaps is an important way to adsorb the full-spectrum of visible light, in addition to modifying large bandgap photocatalysts by doping or constructing heterojunctions.9,10 Many efforts have been made to seek and fabricate narrow bandgap materials, such as g-C3N4,11,12 Sn3O4,13 Ag2S,14 α-Fe2O3,15 BiVO4,16 CuO,17 Cu2O,3,18 etc. Among them, CuxO (x = 1, 2), as the typical narrow bandgap material, have attracted tremendous interest for their great potential due to their unique optical and charge transport properties.6,19–23 In addition, copper oxides (CuO and Cu2O), as p-type semiconductors, are available to absorb visible light due to their favorable bandgaps of 1.3–2.1 eV for CuO and 2.1–2.6 eV for Cu2O.6,18,23Cu2O, as one of the low-cost, non-toxicity, and abundant reserve metal oxides, has been firstly demonstrated promising photocatalytic activity for water splitting under visible light irradiation in 1998.24 Since then, many efforts have been made to study the photocatalytic properties of Cu2O by tuning their morphologies, sizes, compositions, and architectures.3,18,25–30 Ganguli et al.3 reported the morphology-dependent photocatalytic activities of nanocrystalline Cu2O and they found that the layered Cu2O showed the highest photocatalytic activity. Knecht et al.18 revealed that the photocatalytic activity of as-prepared Cu2O was controlled by the charge of the inorganic interface, the composition of the materials, and the surface area of the catalytic structures. Zhong et al.27 explored the effects of various structures on the photocatalytic performance of Cu2O, and they found that the hierarchical structure displayed the best result in photodegradation compared with nanoscale and microscale structures. Besides, CuO also showed the excellent properties on the promising applications, such as gas sensors,31,32 CO oxidation catalysts,33 lithium-ion batteries,19,34 supercapacitor,35 photocatalysts in H2 production36 and so on. The factors affecting the photocatalytic properties of CuO on organic pollutants were widely investigated. Zaman et al.37 synthesized petals and flowers like CuO, for which the structures played a significant role in the photodegradation of organic dyes. The size effect of CuO on the photocatalytic activity was also investigated by Wang et al.,38 which confirmed that the as-prepared sheet-like nanostructures exhibited enhanced photocatalytic activity. In a word, the physical and chemical properties of Cu2O and CuO were significantly influenced by their structures, morphologies, sizes and so on.39–41
In addition, the formation of CuO/Cu2O composites and CuO–Cu2O mutual transformation and the related properties have also been investigated. For example, CuO hollow nanostructures were transformed from Cu2O nanocubes by a controlled oxidation reaction using aqueous ammonia solutions and presented excellent electrochemical performance.19 Chen et al.21 fabricated CuO/Cu2O composite hollow polyhedrons by thermal decomposition from metal–organic framework templates, exhibiting excellent cycle performance as anodes for lithium-ion battery. Knecht et al.18 investigated the correlation between surface structure and photocatalytic functionality of Cu2O/CuO composites synthesized via a synthetic solution method by tuning the ratio and concentration of Cu2+ and glucose. Scuderi et al.42 synthesized CuO nanowires by a thermal process and followed by transforming to Cu2O with subsequent thermal annealing, exploring the polycrystalline structure dependent photocatalytic activity. Meanwhile, Banerjee et al.43 reported the fabrication of CuO@Cu2O core–shell nanowires by the carbothermal reduction method with controlled temperature and reaction time, revealing the indirect phase transformation on the surface. Stimulated by the excellent properties and their potential applications, tremendous attention had been paid to synthesize CuxO (Cu2O and CuO) materials with different morphologies.42–47 However, these methods require high temperature, complicated process, or long reaction times. Therefore, it is very interesting and important to develop a sustainable, facile, and low-temperature approach to fabricate CuxO materials with controlled morphologies and compositions and systematically investigate the effect of morphology and composite on the photocatalytic activity.
In this work, a facile solution method was demonstrated to controllably grow CuxO nanomaterials under low temperature. The structures and morphologies of as-prepared CuxO samples were systematically investigated by tuning the amount of hydroxylamine hydrochloride. The photocatalytic activities of CuxO samples for methyl orange (MO) and rhodamine B (RhB) were performed with or without H2O2. The post-photodegradation analysis was carried out to explore the possible mechanism for the evolution of photocatalytic activity under different conditions.
2. Experimental
2.1 Synthesis of CuxO nanostructures
All the chemical reagents, such as copper(II) nitrate trihydrate (Cu(NO3)2·3H2O), hexamethylene tetramine (HMTA), sodium hydroxide (NaOH), and hydroxylamine hydrochloride (NH2OH·HCl), purchased from Sinopharm Chemical Reagent Co., Ltd. (SCRC, China), were of analytical grade and used without further purification. A typical process was used as follows: 5 mmol Cu(NO3)2·3H2O (1.208 g) and 2.5 mmol hexamethylene tetramine (HMTA) (0.3523 g) were dissolved into 50 mL deionized water with vigorous magnetic stirring, respectively. Then, the two solutions were mixed together followed by magnetic stirring for 10 min to form a homogeneous solution. After that, the mixture added with 9 mL NaOH (2.0 M) was immediately transferred into the water bath at 80 °C for 30 min with magnetically stirring. Subsequently, different amount of 0.4 M hydroxylamine hydrochloride was injected into the above solution quickly and kept at 80 °C for another 30 min. Thereafter, the reactor was taken out to cool down to room temperature naturally after finishing the reaction. The precipitants were collected by centrifugation and washed with ethanol and distilled water for several times. Finally, the products were obtained by drying the precipitates at 60 °C for 12 hours in a vacuum oven. The samples were named as V0, V2.5, V5, V7.5, and V10 for the hydroxylamine hydrochloride amounts of 0, 2.5, 5, 7.5, and 10 mL, respectively.2.2 Characterization
X-ray powder diffraction (XRD) patterns of as-prepared samples were conducted on a German X-ray diffractometer (D8-Advance, Bruker AXS, Inc., Madison, WI, USA) equipped with Cu Kα radiation (λ = 0.15406 nm). The morphologies of as-prepared samples were observed by a field emission scanning electron microscope (FESEM, FEI Quanta FEG250, FEI, Hillsboro, USA) and transmission electron microscope (TEM, HEOL-200CX, JEOL, Tokyo, Japan). The X-ray photoelectron spectroscopy (XPS) was collected on the Thermo ESCALAB 250XI electron spectrometer equipped with Al Kα X-ray radiation (hν = 1486.6 eV) as the source for excitation. The Brunauer–Emmett–Teller (BET) specific surface areas of as-prepared samples were measured by N2 adsorption–desorption isotherm with a Quantachrome NOVAtouch LX4 apparatus.2.3 Photocatalytic properties
The photocatalytic properties were characterized by a UV-vis spectrophotometer (TU-1901, Beijing Purkinje General Instrument Co., Ltd, Beijing, China) at room temperature in air under visible-light irradiation, which was similar to previous reports.46 The visible light was generated by a 500 W Xe lamp equipped with a cutoff filter (λ ≥ 420 nm) to remove the UV part. Typically, 30 mg of the as-prepared samples were placed into 50 mL of 5 mg L−1 rhodamine (RhB) or 20 mg L−1 methyl orange (MO) aqueous solution. The mixture was moved into the photocatalytic reactor and kept in the dark for 60 min with magnetic stirring to reach the adsorption–desorption equilibrium of RhB or MO on the surface of as-synthesized Cu2O/CuO samples. A certain amount (0 or 1000 μL) of H2O2 was added into the solution before turning on Xe lamp. ca. 3 mL suspension was taken out after a given irradiation time interval and centrifuged to filtrate the sample powders for the UV-vis spectra test. The concentration of RhB in the solution was evaluated by collecting the absorbance of RhB at 553 nm or MO at 464 nm from the absorption spectrum recorded by UV-vis spectrophotometer.3. Results and discussion
3.1 Structural and morphological characterization of samples
The XRD patterns in Fig. 1 show that all the peaks can be perfectly indexed into cubic Cu2O (JCPDS no. 78-2076) and monoclinic CuO (JCPDS no. 89-5899). No other characteristic peaks are found in theses samples, which demonstrate the purity of as-synthesized samples. With the increase of hydroxylamine hydrochloride content, the compositions change from pure CuO (V0) into mixed CuO/Cu2O (V2.5 and V5), finally obtaining pure Cu2O (V7.5 and V10). After the amount of hydroxylamine hydrochloride reaches to 7.5 mL, there is no influence on the composition of as-prepared samples. In a word, the results confirm that the amount of hydroxylamine hydrochloride has significant influence on the compositions of as-prepared samples.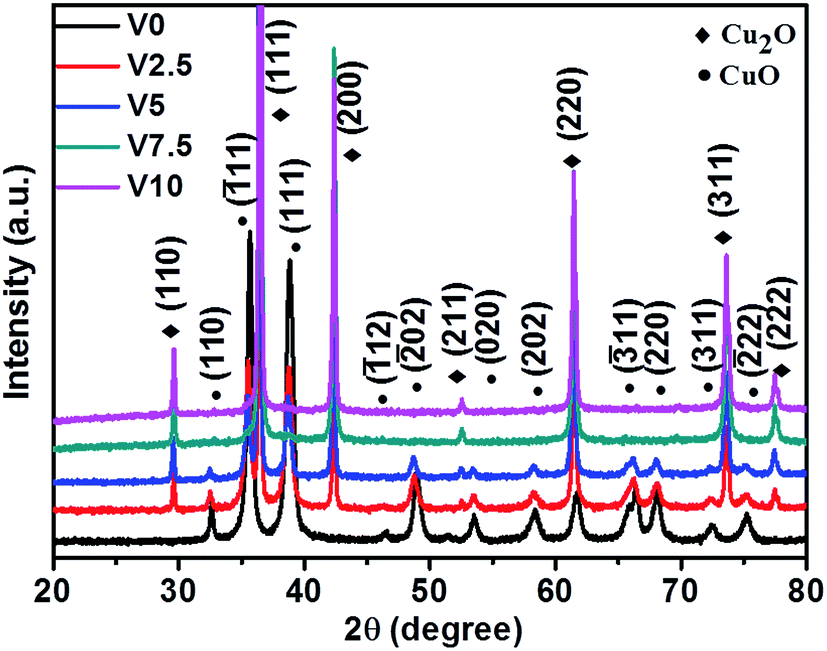 | ||
| Fig. 1 XRD patterns of as-prepared CuxO samples with various amounts of hydroxylamine hydrochloride (V0-0 mL, V2.5-2.5 mL, V5-5 mL, V7.5-7.5 mL, and V10-10 mL). | ||
Fig. 2a shows that the pure CuO (V0) was completely composed of nanosheets. With the increase of the amount of hydroxylamine hydrochloride to be 2.5 mL, the sample (V2.5) mainly consisted of nanosheets accompanying with some octahedral-like crystals as depicted in Fig. 2b. From the magnified SEM image (Fig. 2c), we can observe that the octahedron-like structures were perfectly formed by the assembly of nanosheets. As further increasing the amount of hydroxylamine hydrochloride to 5 mL, the octahedral-like structures became the dominant morphology in the sample (V5), as shown in Fig. 2d, though the nanosheets still existed on the surface of octahedrons from the inset of Fig. 2d. In other word, the nanosheets were almost entirely assembled to form octahedrons. With further increasing the amount of hydroxylamine hydrochloride reductant, the octahedrons as the dominant morphology were observed with non-uniform sizes as shown in Fig. 2e as well as some of truncated octahedrons for samples V7.5. From high magnification image (inset in Fig. 2e), the octahedral surfaces were rough, which was different from the smooth surfaces of octahedrons of V10 as depicted in Fig. 2f. In addition, only the octahedrons were observed with non-uniform sizes in sample V10. Combining with XRD results, the morphology transformed from the nanosheets into octahedrons by the self-assembly with the help of hydroxylamine hydrochloride.
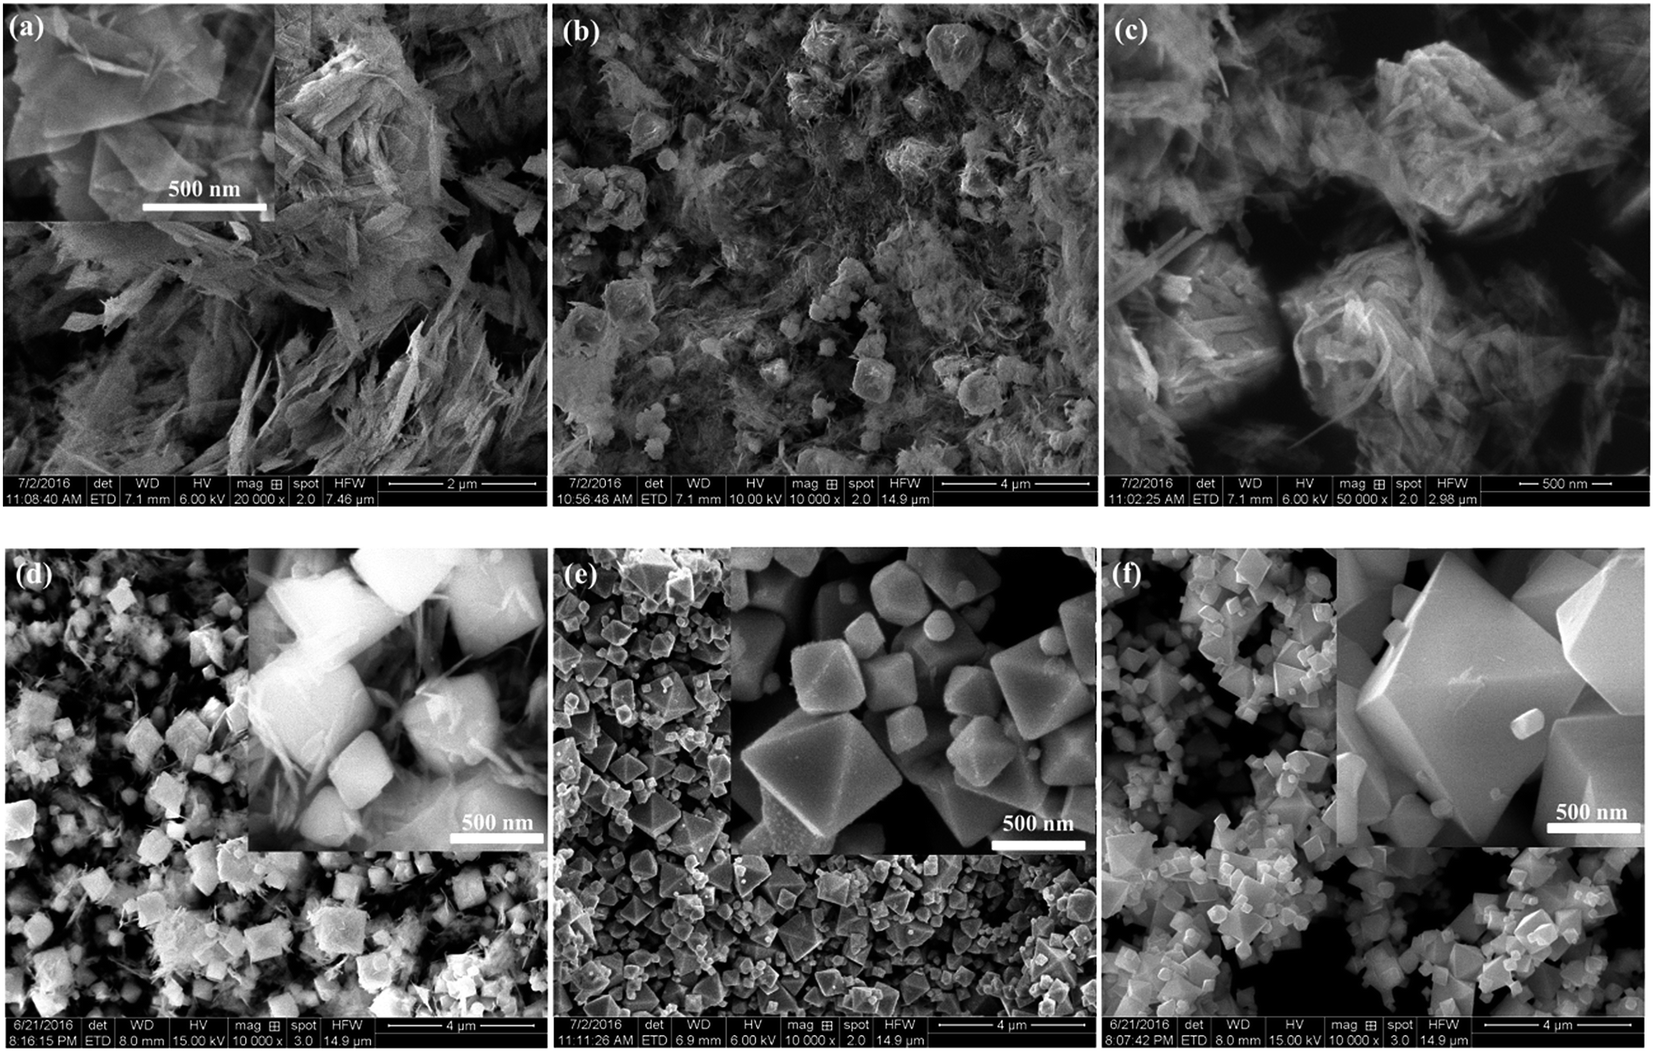 | ||
| Fig. 2 SEM images of the as-synthesized samples with different amount of hydroxylamine hydrochloride during the preparing process: (a) V0, (b and c) V2.5, (d) V5, (e) V7.5, and (f) V10. | ||
Fig. 3 presents the typical TEM images and corresponding SAED patterns of the representative as-synthesized products V2.5 and V10. The main morphology of nanosheets was depicted as shown in Fig. 3a and b, which was consistent with SEM observation. The corresponding SAED pattern (Fig. 3c) confirmed the co-existence of CuO and Cu2O in agreement with XRD results. However, the particles were only observed for sample V10 as exhibited in Fig. 3d–f, and the related SAED illustrated the pure polycrystalline Cu2O, in keeping with the results of SEM and XRD.
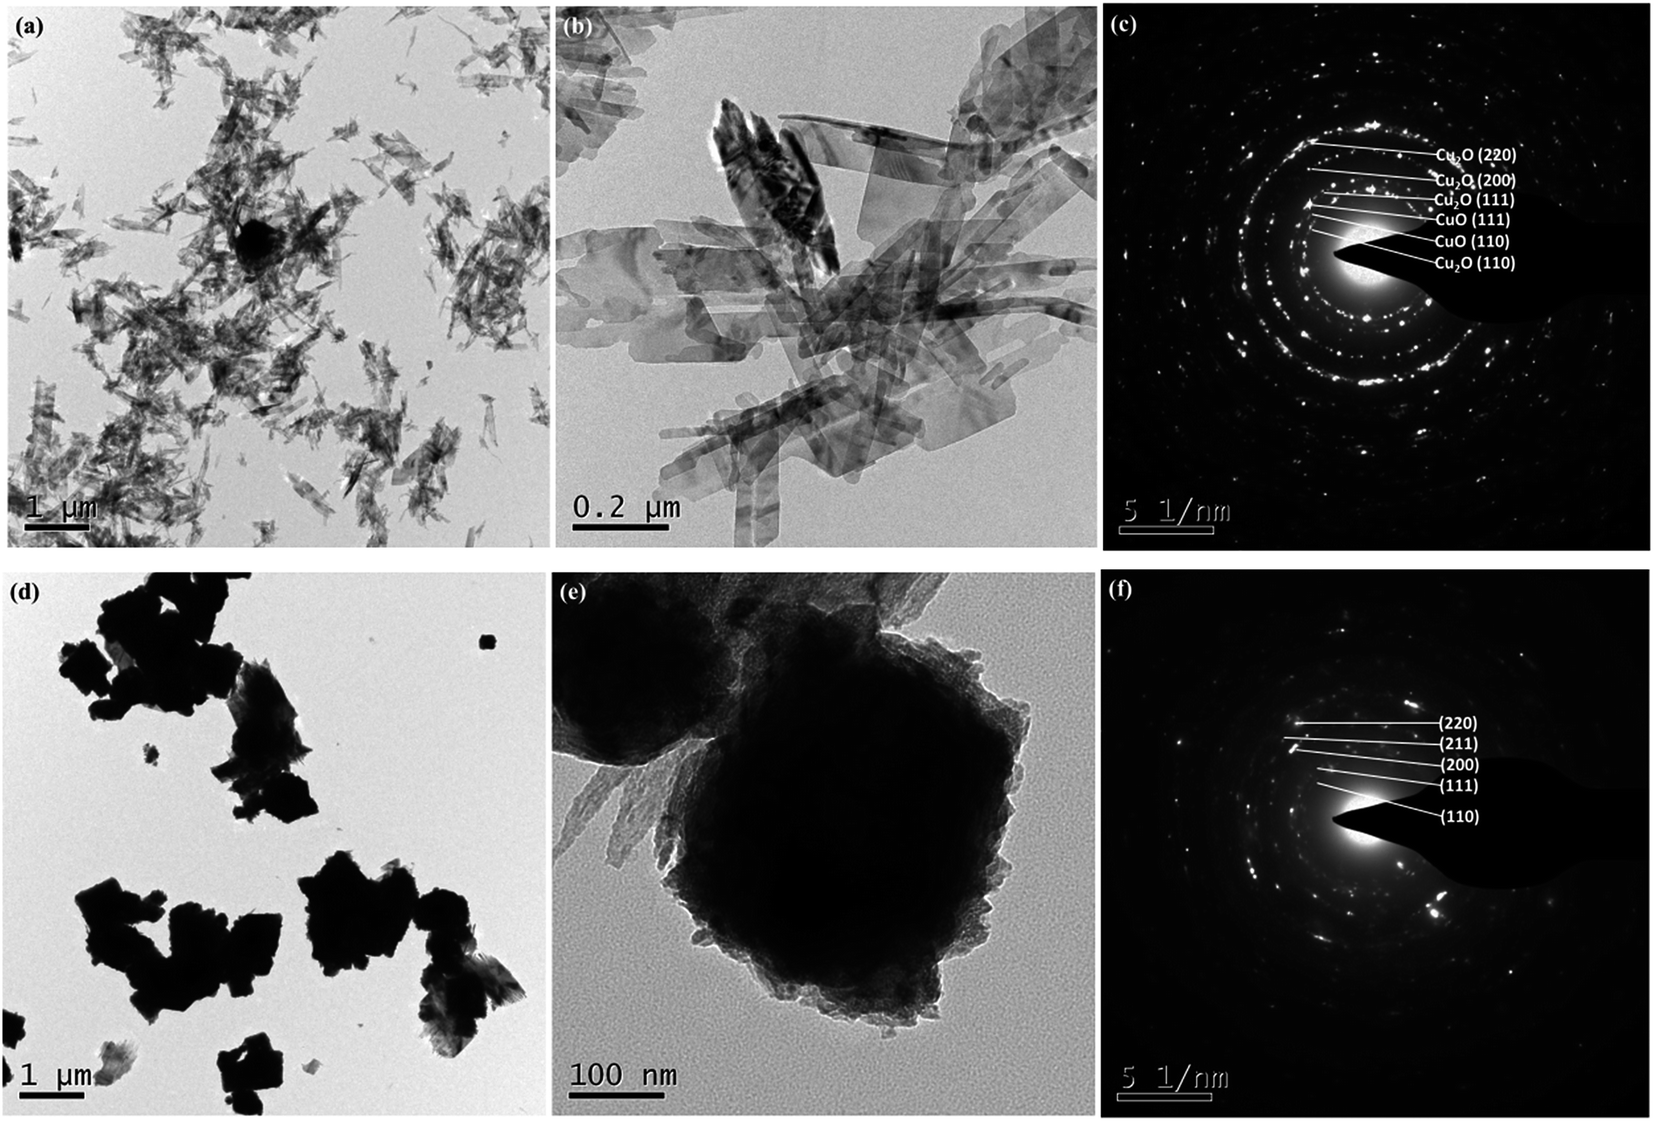 | ||
| Fig. 3 Typical low and high magnification TEM images of the as-prepared products and their corresponding SAED patterns: (a–c) V2.5 and (d–f) V10. | ||
The growth mechanism for the formation of CuO nanosheets was predicted, where HMTA played an important role in the growth process. The related chemical reactions were listed as follows according to the previous reports:45,48,49
| C6H12N4 + 6H2O → 6HCHO + 4NH3 |
| NH3 + H2O → NH4+ + OH− |
| Cu2+ + 2OH− → Cu(OH)2 |
HMTA could be hydrolyzed in the solution and generate OH− ions slowly by decomposing into formaldehyde (HCHO) and ammonia (NH3). Then, Cu(OH)2 could be formed by the chemical reaction of Cu2+ with OH− ions. At the same time, HMTA acted as a surfactant which could control the nanostructure shapes.45,50 After adding NaOH, the formation of Cu(OH)2 became quickly, which could be confirmed by the color evolution of solutions (see ESI Fig. SI-1†). In brief, the transparent solution was changed into a little lightly blue turbidity by mixing the solutions of Cu(NO3)2·3H2O and HMTA together. After the addition of NaOH the color changed into blue immediately due to the instant dissolution of NaOH into OH− ions, which confirmed the fast formation of Cu(OH)2 nuclei. Then the solution was changed into dark by heating in the water bath, demonstrating the formation of CuO by the decomposition of Cu(OH)2. Therefore, the nanosheets structure of CuO was controlled by HMTA in our work, which was consistent with previous report.45,49 This was also verified by replacing HMTA with sodium dodecyl sulfate (SDS) to generate flower-like morphology consisting of nanorods, as shown in Fig. SI-2,† where XRD pattern certifying the formation of pure CuO phase. NaOH made the nanosheets aggregate together rather than individual structures due to its strong electrolyte neutralizing the surface charges of CuO.45 However, once hydroxylamine hydrochloride was added into the above solution, the solution changed into yellow color, which intuitionally demonstrated the successful transformation of CuO to Cu2O, according to the following chemical reaction:45,51–53
| 2CuO + 2NH2OH·HCl → Cu2O + N2 + 2HCl + 3H2O |
Hydroxylamine hydrochloride provides two things in the growth process: first, it would reduce Cu2+ ions to Cu+ ions resulting in the formation of Cu2O.54 Second, it could offer binding sites to adsorb copper ions,55,56 affected the different growth rate along [100] and [111] direction, resulting in the final shape of the products.53 The formation of truncated octahedrons and pure octahedrons was ascribed to the following reasons, in accordance with previous reports:49–53 (1) HMTA preferentially adsorbing on the (111) planes of Cu2O impeded the growth of (111) planes; (2) the amount of hydroxylamine hydrochloride may affect the growth rate along the [100] direction relative to that of the [111] direction resulting in the preferential orientation in [111] direction, which is mainly responsible for the shape control of as-synthesized samples; (3) the generated nitrogen gas influences the surface of the as-synthesized samples, such as rough surfaces; (4) the aggregated flower-like CuO nanosheets also provides the favorable conditions to form the octahedral structures.
3.2 Photocatalytic activity of as-grown samples
The photocatalytic properties of as-obtained samples were investigated (UV-vis spectral variations of RhB and MO in aqueous solution were shown in ESI: Fig. SI-3 and SI-4,† respectively) and the selective photodegradation property was performed, as shown in Fig. 4. The as-prepared samples present different photocatalytic activities to MO and RhB. V0 and V2.5 show more efficient photodegradation to RhB, while V5, V7.5 and V10 exhibit excellent photocatalytic activities to MO. The difference could be ascribed to the preferred adsorption ability of Cu2O to anionic MO57 and CuO to RhB,58 respectively. Therefore, the well adsorbed dyes on the surfaces of samples promoted the photocatalytic activities. As aforementioned XRD results, CuO phase in the samples gradually decreases until disappeared with the increase of hydroxylamine hydrochloride amount, resulting in the degressive photodegradation ability to RhB, as depicted in Fig. 4a. However, the photocatalytic activities enhanced accompanying with the phase transformation from CuO to Cu2O in Fig. 4b. In addition, Cu2O shows the higher photocatalytic activity than CuO for MO degradation, which is consistent with previous reports.18,57–59 Fig. 4c depicts the cycling test of as-prepared samples for MO photodegradation under visible light irradiation and illustrates the moderate recycling ability as photocatalysts for photodegradation of MO in aqueous solution except for the first run especially for sample V10. This could be caused by the photocorrosion of Cu2O to form CuO due to Cu+ scavenging holes at the first run,18,46,60,61 then, the generated CuO could protect the surface of Cu2O to inhibit the photocorrosion.6 Moreover, all the samples exhibit relatively low efficiency to MO and RhB photodegradation.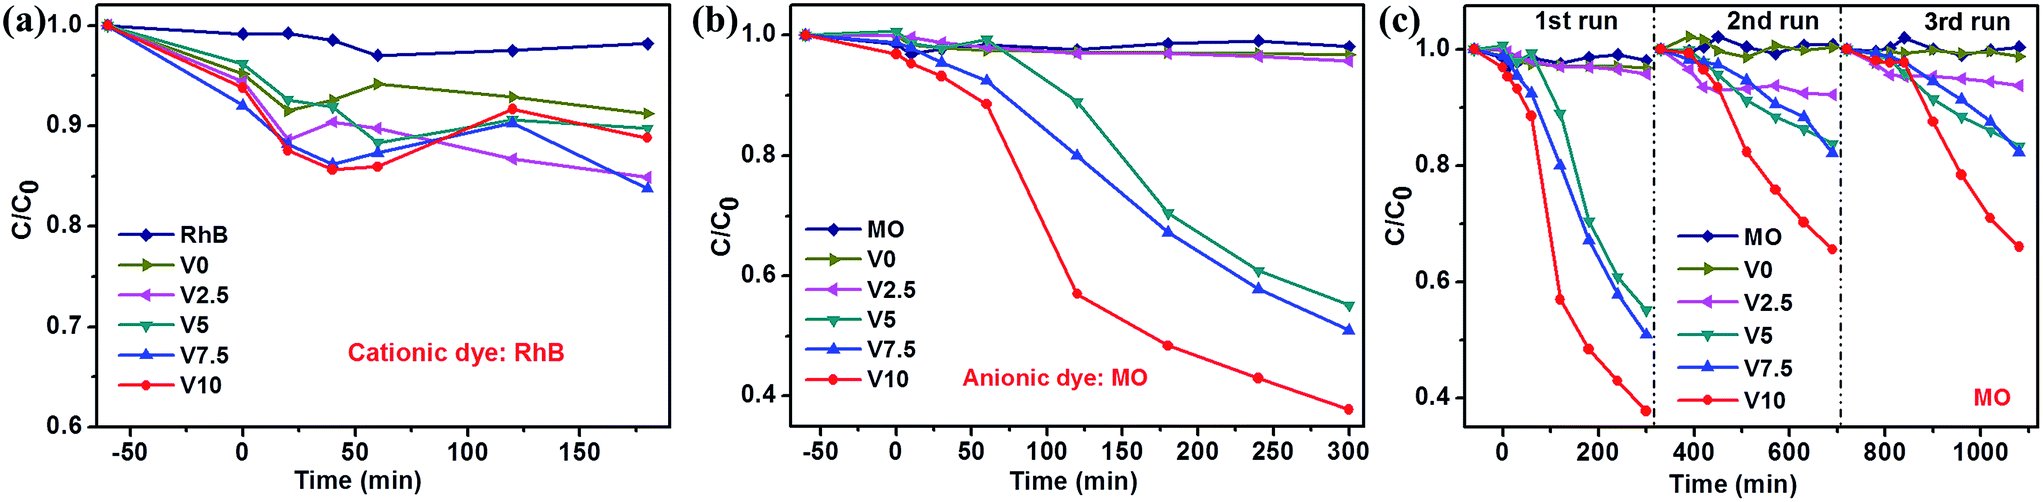 | ||
| Fig. 4 Photodegradation of RhB (a) and MO (b) over as-prepared samples under visible light irradiation; (c) catalysts recycling in the photodegradation of MO. | ||
As we know that H2O2 played an important role in the photocatalytic process of CuxO catalysts.6,29,47,62 Hence, H2O2 was used in this work to improve the photocatalytic activity of as-grown samples for MO (UV-vis spectra of MO aqueous solution in the presence of H2O2 and as-prepared catalysts were shown in ESI: Fig. SI-5†). Fig. 5a presents the photodegradation analysis of MO in the presence of H2O2 under visible light irradiation. The concentration of MO in the solution is almost no change in the presence of H2O2 and visible light illumination illustrating the very weak activity of H2O2 for MO photodegradation in consistent with previous report.62 In the presence of both H2O2 and catalysts under visible light illumination, the concentrations of MO in the solution were decreased promptly. The photocatalytic degradation kinetics of MO aqueous solution was analyzed by the pseudo first-order model to determinate the rate constant of photodegradation with respect to the degradation time by the following equation:3,37,46
| ln(C/C0) = −kt |
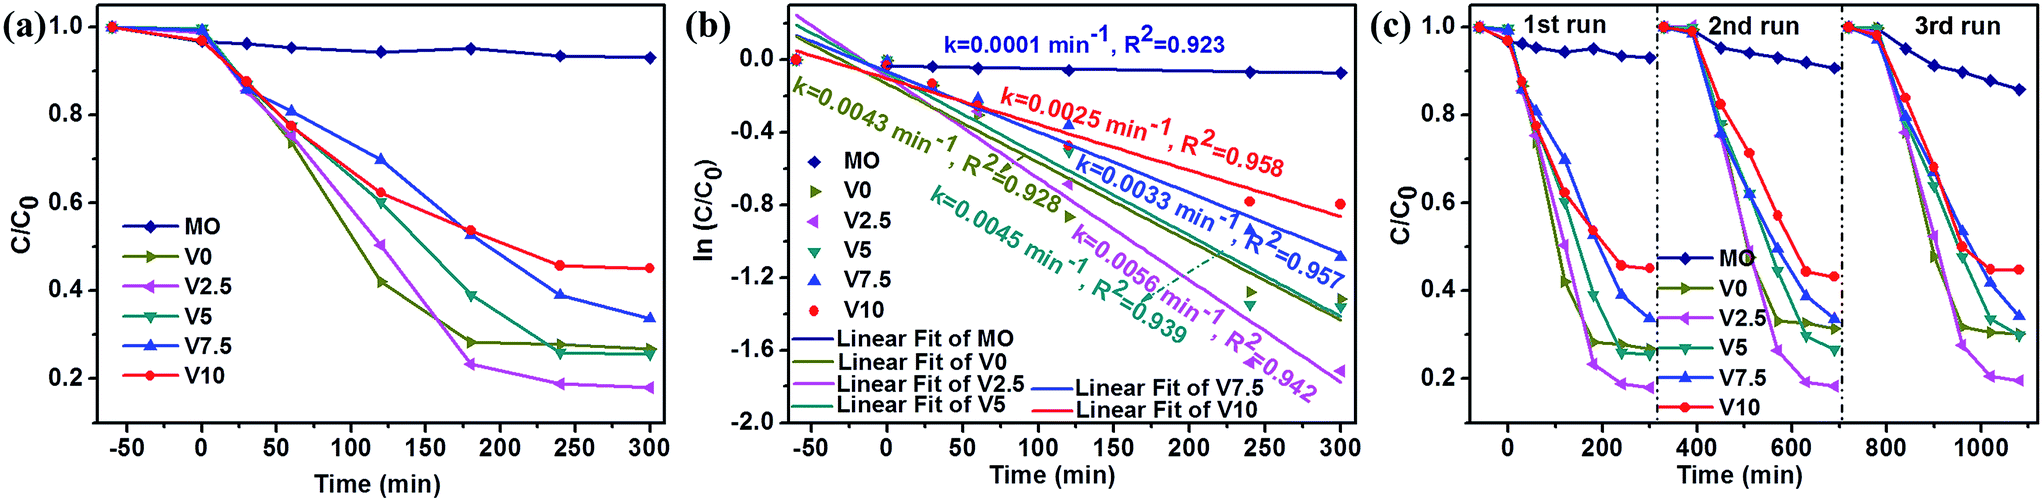 | ||
| Fig. 5 Photocatalytic degradation of MO in the presence of H2O2 under visible light irradiation: (a) the overall analysis for all the products, (b) first-order kinetic plot of ln(C/C0) vs. time, and (c) cycling test of all photocatalysts. | ||
Based on the above results, the photocatalytic mechanism could be proposed as follows combining with the reported literatures:6,18,29,57–64 (1) CuxO showing different adsorption ability to MO would affect the photocatalytic activity; (2) the exposed facets of as-prepared samples has an important effect on the photocatalytic performance;51 (3) the formed heterojunction acting as a rapid separation site for the photogenerated electron–hole pairs promoted the photocatalytic efficiency; (4) H2O2 also had significant influence on the photocatalytic property. For the photodegradation process without H2O2, the photocatalytic reaction would be very simple: both CuO and Cu2O could efficiently generate electrons and holes under visible light irradiation, then, the photogenerated electrons and holes reacted with H2O and O2 to generate oxidant species such as ·OOH, ·OH, and ·O2−.26,46 Finally, the dyes (MO) could be effectively bleached by these oxidant species. The sequence of as-prepared samples for MO photodegradation without H2O2 could be explained that: (a) Cu2O had the higher photocatalytic activity than CuO for MO degradation leading to the smallest photodegradation rate of V0, in well agreement with the literatures;57–59 (b) the more amount of Cu2O resulting in the increased photodegradation rate (V7.5 > V5 > V2.5), which was in consistent with XRD results and the previous report;18 (c) {111} facets had the higher photocatalytic activity than that of other facets for Cu2O, which was in accordance with SEM observation and confirmed by many other researches,6,18,46,52,64 giving rise to the photodegradation rate of V10 > V7.5. Once H2O2 was added in the decoloration process, the mechanism became complicated. H2O2 was considered as an electron acceptor to promote the electron–hole separation and decompose to form a certain amount of ·OH by accepting electrons to enhance the photocatalytic activity.47,62 On the other hand, H2O2 could accelerate the photocorrosion of Cu2O transforming into CuO which would lower the photocatalytic activity to some extent.29,46,47 Therefore, the addition of H2O2 resulted in the relatively lower photodegradation rate of V7.5 and V10 due to the more severe photocorrosion compared with the photodegradation without H2O2. For V0 (pure CuO) the photodegradation rate had a faster increase due to the effect of H2O2, which was also found by other report.62 Combining with H2O2, the photocatalytic activity of V2.5 and V5 was also stimulated to achieve a higher value. This might be caused by the interface between CuO and Cu2O acting as a rapid separation site for the photogenerated electrons and holes and thus enhancing the photocatalytic performance.59,62 Therefore, V2.5 had the highest photodegradation rate due to the less photocorrosion induced by the relatively low content of Cu2O and the protection from CuO.6 In addition, the faster formation of CuO could protect the surface of Cu2O resulting in the good durability of as-prepared samples under the photodegradation. Moreover, the specific surface area was considered to be very important factor for the photodegradation.18,62 The specific surface areas of as-synthesized samples were evaluated to be 25.26, 19.44, 10.45, 6.20, and 6.66 m2 g−1, for V0, V2.5, V5, V7.5, and V10, respectively (N2 adsorption–desorption isotherms of the products were shown in ESI: Fig. SI-7†). Therefore, in our work, the specific surface area was not as important as other factors mentioned above.
In order to further understand the underlying photodegradation mechanism of as-synthesized samples, the structural and morphological studies were carried out for the typical samples V2.5 and V10. Fig. 6 presents the XRD patterns of V2.5 and V10 treated by different conditions. The patterns could be perfectly indexed with Cu2O and CuO for V2.5 after photodegradation as shown in Fig. 6a, which confirmed that the composite was not changed by photodegradation. Only Cu2O was observed for V10 before and after photodegradation as depicted in Fig. 6b. CuO could not be observed from XRD patterns in Fig. 6b, which was different from above assumption.
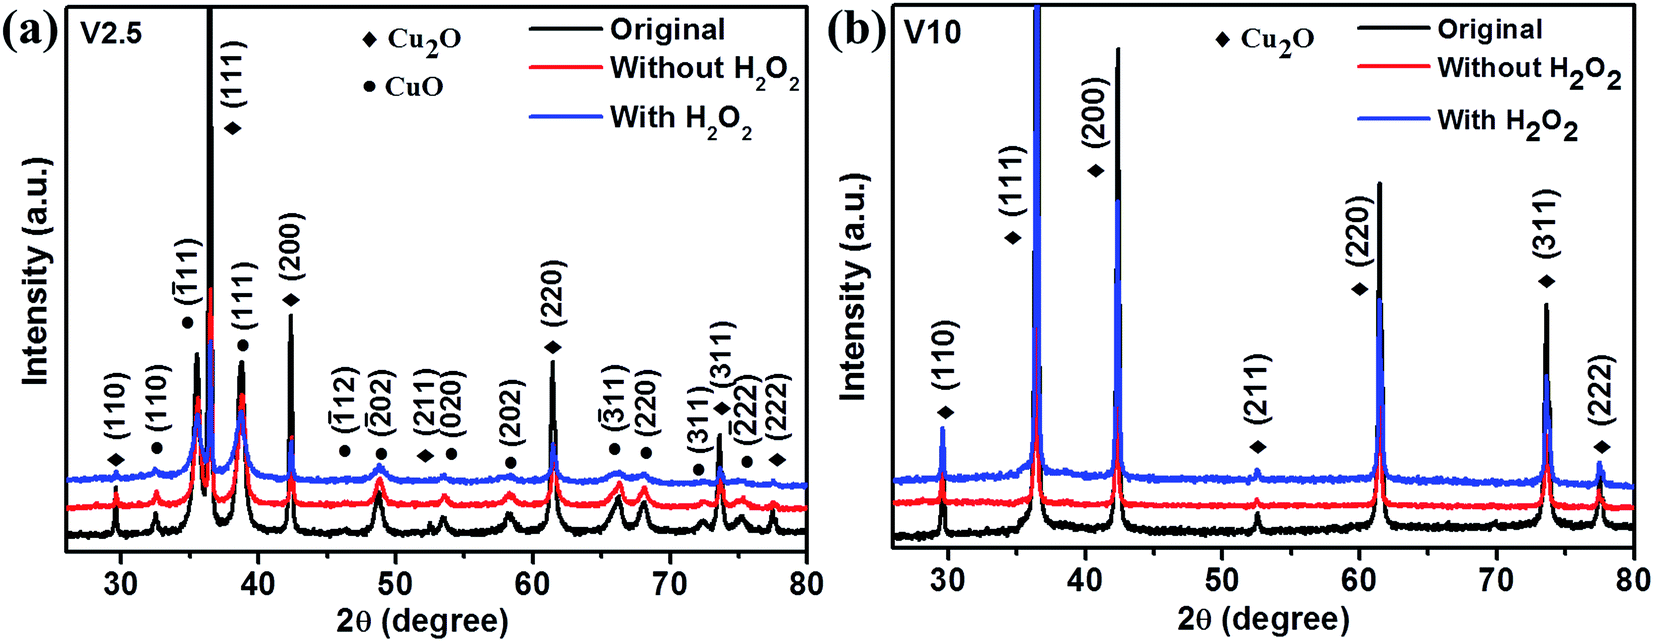 | ||
| Fig. 6 XRD patterns of (a) V2.5 and (b) V10 before and after the photodegradation of MO with and without H2O2. | ||
XPS analysis was used to examine the surface composition of the samples V2.5 and V10. Fig. 7 presents XPS spectra of V2.5 and V10 recorded by as-prepared samples and after MO photodegradation. The survey scan of V2.5 and V10 were observed as shown in Fig. 7a and d, which showed no obvious difference before and after photodegradation. As shown in Fig. 7b, high resolution XPS spectrum in the Cu 2p3/2 and Cu 2p1/2 binding energy region shows the major peaks locating at 933.8 and 954.5 eV are in consistent with the reported value of CuO, while the peaks located at 932.5 and 952.6 eV are assigned to Cu2O.18,64,65 The typical satellite peaks at 942 and 962.2 eV are also indexed to CuO18,27,59,64,65 and the peaks showed slightly decrease after photodegradation illustrating the decrease of CuO content on the surface of sample V2.5. The O 1s region in Fig. 7c could be fit into three main peaks locating at 529.6, 530.2 and 531.3 eV, which are ascribed to the Cu–O bond of CuO, lattice oxygen of Cu2O and surface-absorbed oxygen species (O2 and H2O), respectively.43,65,66 All the XPS analysis confirms the existence of both CuO and Cu2O in the sample V2.5 before and after photodegradation under different conditions, in agreement with XRD results. In addition, the intensities of O 1s at 529.6 eV and 531.3 eV become gradually lower and higher in the absence and presence of H2O2 for the degradation of MO, which demonstrates the decrease of CuO and increase of absorbed oxygen species on the surface of sample V2.5, respectively.66,67 The decrease of CuO on the surface of sample V2.5 may be ascribed to reduce CuO to form Cu2O by the photogenerated electrons,68 which further explained by the junction formation resulted in the electron transfer direction.6 However, the opposite results are observed in Fig. 7e and f due to the single phase of Cu2O for as-prepared sample V10. The intensity of satellite peak in Cu 2p region becomes stronger after the photodegradation with H2O2 illustrating the more content of surface CuO due to the more severe photocorrosion of Cu2O.29,47,67 In this case, the photocorrosion of Cu2O is dominant compared with the CuO reduction, and thus CuO increases after photodegradation. Moreover, CuO observed in the sample V10 after photodegradation is different from XRD result which could be attributed to the trace amount of CuO on the surface of the samples.65,66 Meanwhile, the intensity of O 1s at 531.4 eV becomes stronger under the photodegradation treatment with H2O2, demonstrating the bigger amount of surface-absorbed oxygen species.67 The more adsorbed oxygen species would lead to the more generation of hydroxyl radical, which could effectively decolorize MO dye.63 Therefore, it was reasonable for the enhanced photodegradation rate with H2O2 for all the samples.
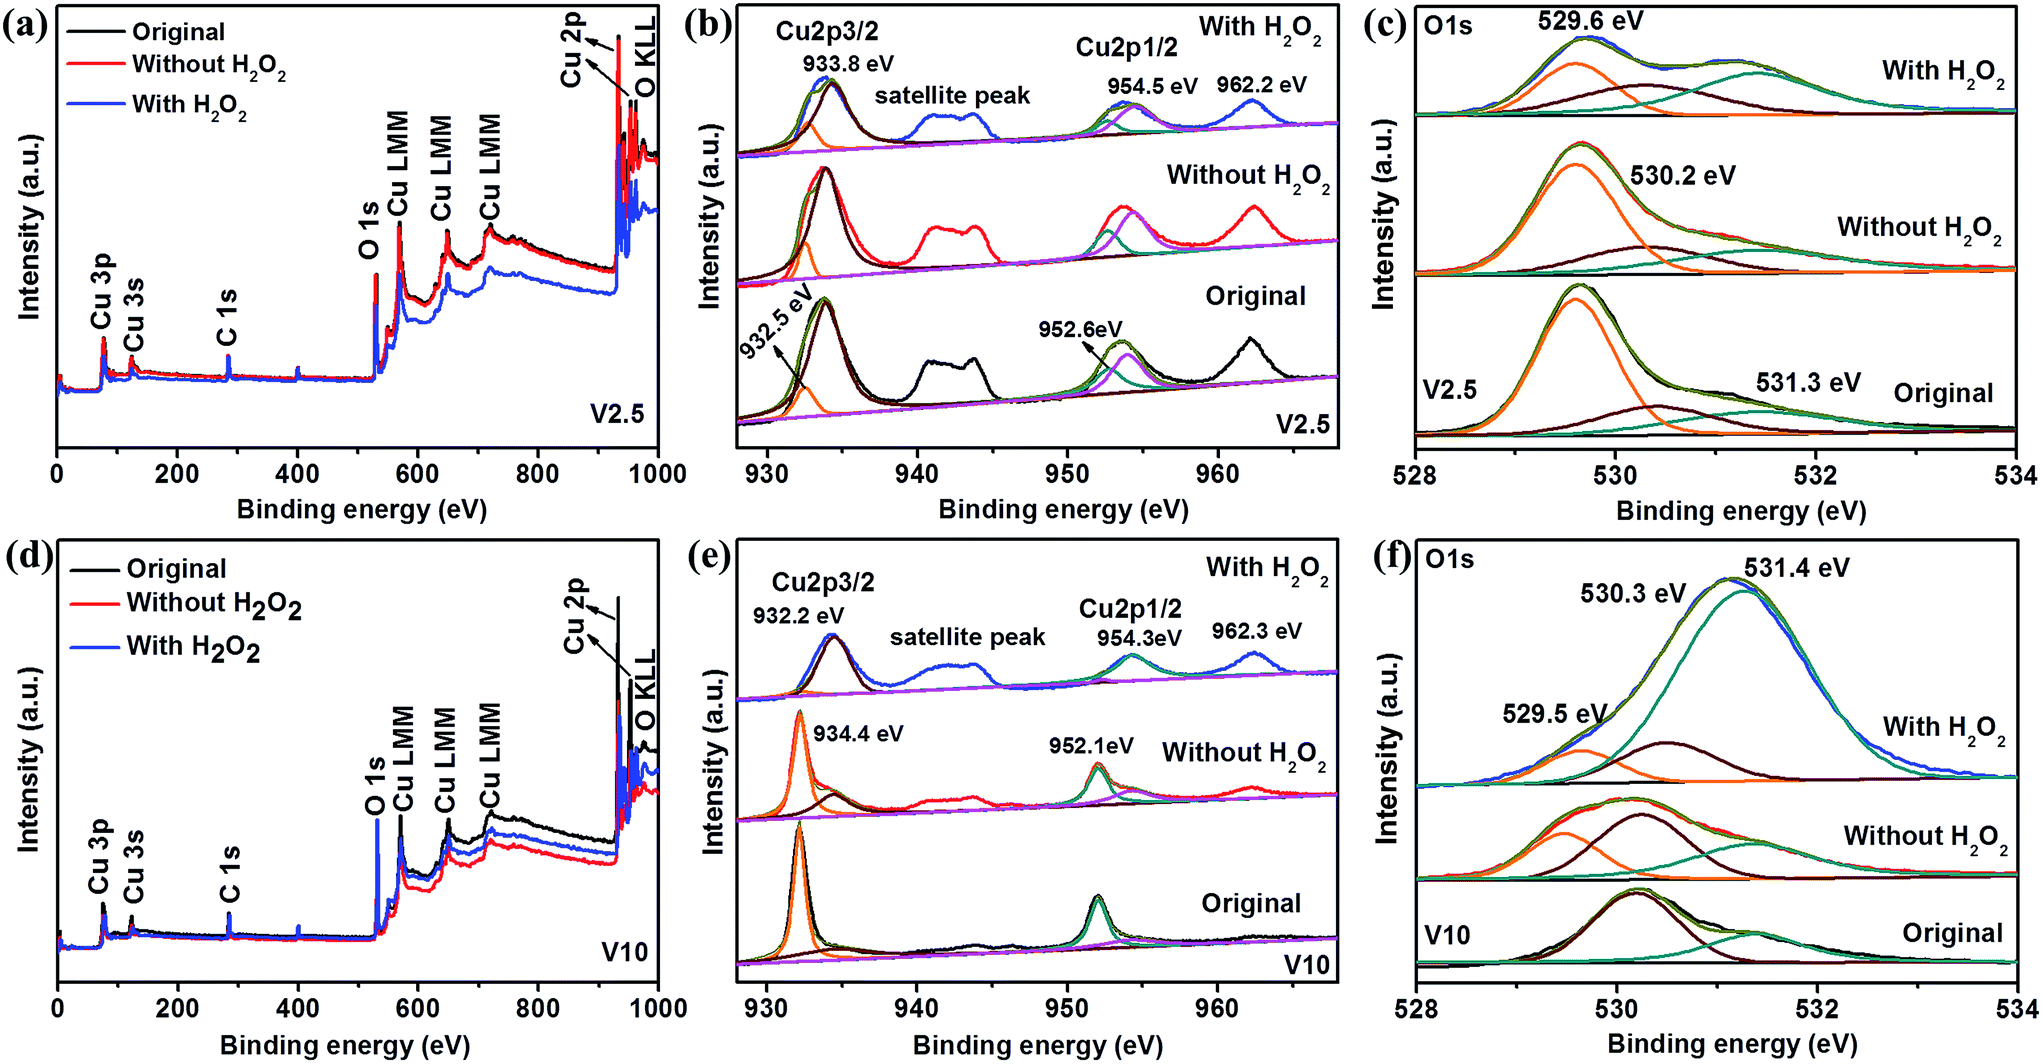 | ||
| Fig. 7 Typical XPS analysis of V2.5 (upper panel) and V10 (lower panel) before and after photodegradation of MO with different conditions including XPS full spectrum, Cu 2p spectrum, and O 1s spectrum, respectively. | ||
The SEM and TEM observations were carried out to investigate the morphological change of as-prepared samples under photodegradation process. After photodegradation with H2O2, the nanosheets and flakes were observed for sample V2.5 as shown in Fig. 8a, which was different from the original structures (nanosheets and octahedron in Fig. 2b). Meanwhile, the octahedral structures for V10 (Fig. 8d) were observed which retained the original structures before photodegradation (Fig. 2f). However, from the magnified SEM images, the octahedrons were completely consisted of flakes (Fig. 8e) for V10. Meanwhile, the original nanosheets were full of pores (inset of Fig. 8b) as well as the incompact octahedrons (Fig. 2c) changed into disperse flakes during the photocatalytic process for V2.5. All the observations illustrated the morphology changes during the photocatalytic process, which was consistent with the previous reports.18,63 Briefly, Cu2O and CuO could experience mutual transformation due to the photocorrosion and reduction by the photogenerated electrons, respectively. The reaction occurred at the surface of catalysts, resulting in the following possible deduction. Some part of generated Cu2O and CuO due to the photocatalysis could drop out from the surface of catalysts, leading to the final surface morphology transformation of photocatalysts. TEM images (Fig. 8c and f) further confirmed that the octahedrons were composed of flakes for V10 while sample V2.5 possessed porous nanosheets and disperse flakes. The results further deduced that the photocatalytic reaction occurred on the surface of as-prepared samples.
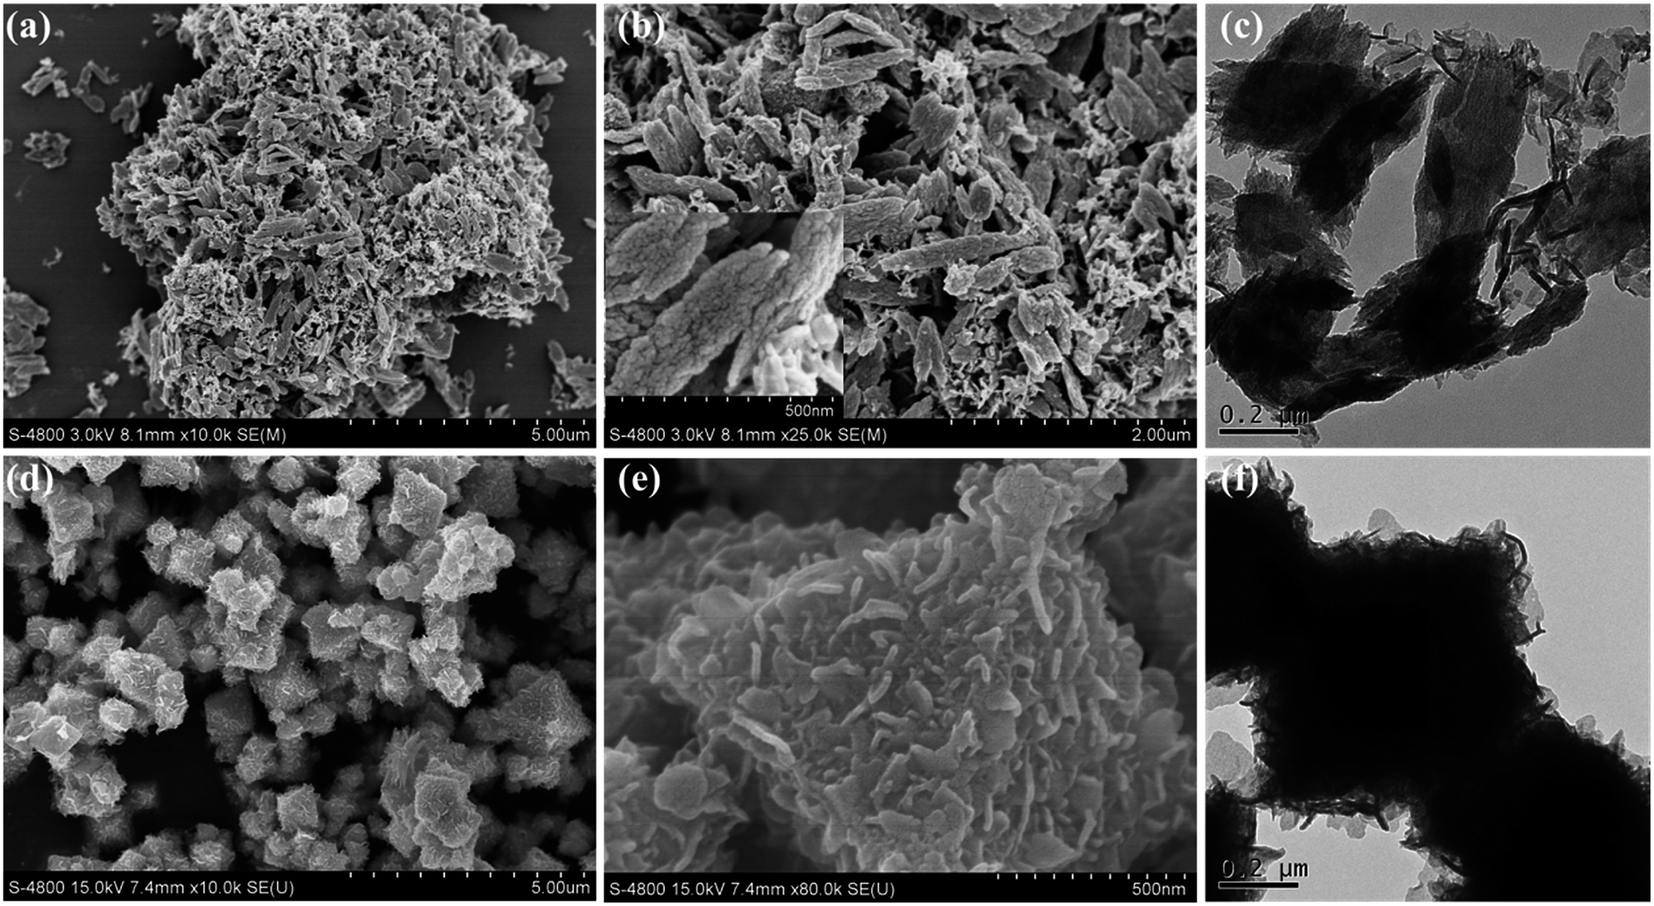 | ||
| Fig. 8 SEM (a, b, d and e) and TEM (c and f) images of as-prepared sample V2.5 (upper panel) and V10 (lower panel) after photodegradation of MO in the presence of H2O2 under visible light irradiation. Inset of (b) is the magnified SEM images of original nanosheets. | ||
4. Conclusions
In summary, CuxO (CuO, CuO/Cu2O composite, and Cu2O) nanostructures were successfully synthesized by a facile solution method under low temperature. The structural and morphological investigation proved that the amount of hydroxylamine hydrochloride had played an important role in the composition and morphological transformation of as-grown samples. The photocatalytic activity study confirmed that as-synthesized samples presented the selectivity to the dyes under visible light irradiation and H2O2 significantly enhanced the photodegradation rate for MO in aqueous solution. The following factors should be considered for the possible mechanism on the photodegradation of organic dyes: the adsorption ability of photocatalysts, the structural and morphological character of as-prepared samples, the composition of photocatalysts, and the addition of H2O2. The post-photodegradation analysis illustrated that (1) as-prepared samples were stable; (2) the existence of CuO could inhibit the photocorrosion of Cu2O; (3) the photocatalytic reaction occurred on the surface of photocatalysts. The results illustrated the potential application of CuxO in wastewater treatment and could be very important on the selection and design of metal oxide catalysts.Acknowledgements
This work was supported by the National Natural Science Foundation of China (Grant No. 21505050, 51672109), Natural Science Foundation of Shandong Province (Grant No. ZR2016JL015, ZR2016FM30), and a Project of Shandong Province Higher Educational Science and Technology Program (Grant No. J15LJ06).References
- E. Eltzov, V. Pavluchkov, M. Burstin and R. S. Marks, Sens. Actuators, B, 2011, 155, 859–867 CrossRef CAS.
- L. J. Zhou, Y. C. Zou, J. Zhao, P. P. Wang, L. L. Feng, L. W. Sun, D. J. Wang and G. D. Li, Sens. Actuators, B, 2013, 188, 533–539 CrossRef CAS.
- B. Kumar, S. Saha, A. Ganguly and A. K. Ganguli, RSC Adv., 2014, 4, 12043–12049 RSC.
- P. Basnet, G. K. Larsen, R. P. Jadeja, Y.-C. Hung and Y. P. Zhao, ACS Appl. Mater. Interfaces, 2013, 5, 2085–2095 CAS.
- L. L. Ma, J. L. Li, H. Z. Sun, M. Q. Qiu, J. B. Wang, J. Y. Chen and Y. Yu, Mater. Res. Bull., 2010, 45, 961–968 CrossRef CAS.
- P. Basnet and Y. P. Zhao, Catal. Sci. Technol., 2016, 6, 2228–2238 CAS.
- A. Kudo and Y. Miseki, Chem. Soc. Rev., 2009, 38, 253–278 RSC.
- L. L. Wang, J. Ge, A. L. Wang, M. S. Deng, X. J. Wang, S. Bai, R. Li, J. Jiang, Q. Zhang, Y. Luo and Y. J. Xiong, Angew. Chem., Int. Ed., 2014, 53, 5107–5111 CAS.
- X. Wan, X. Y. Liang, C. R. Zhang, X. X. Li, W. W. Liang, H. S. Xu, S. Lan and S. L. Tie, Chem. Eng. J., 2015, 272, 58–68 CrossRef CAS.
- X. Xu, Z. H. Gao, Z. D. Cui, Y. Q. Liang, Z. Y. Li, S. L. Zhu, X. J. Yang and J. M. Ma, ACS Appl. Mater. Interfaces, 2016, 8, 91–101 CAS.
- G. Mamba and A. K. Mishra, Appl. Catal., B, 2016, 198, 347–377 CrossRef CAS.
- F. Dong, Z. W. Zhao, T. Xiong, Z. L. Ni, W. D. Zhang, Y. J. Sun and W.-K. Ho, ACS Appl. Mater. Interfaces, 2013, 5, 11392–11401 CAS.
- M. Manikandan, T. Tanabe, P. Li, S. Ueda, G. V. Ramesh, R. Kodiyath, J. J. Wang, T. Hara, A. Dakshanamoorthy, S. Ishihara, K. Ariga, J. H. Ye, N. Umezawa and H. Abe, ACS Appl. Mater. Interfaces, 2014, 6, 3790–3793 CAS.
- W. Jiang, Z. M. Wu, X. N. Yue, S. J. Yuan, H. F. Lu and B. Liang, RSC Adv., 2015, 5, 24064–24071 RSC.
- X. Zheng, Z. C. Han, S. Y. Yao, H. H. Xiao, F. Chai, F. Y. Qu and X. Wu, Dalton Trans., 2016, 7094–7103 RSC.
- S. S. Dunkle, R. J. Helmich and K. S. Suslick, J. Phys. Chem. C, 2009, 113, 11980–11983 CAS.
- X. Wang, J. Yang, L. X. Shi and M. Z. Gao, Nanoscale Res. Lett., 2016, 11, 125 CrossRef PubMed.
- M. A. Nguyen, N. M. Bedford, Y. Ren, E. M. Zahran, R. C. Goodin, F. F. Chagani, L. G. Bachas and M. R. Knecht, ACS Appl. Mater. Interfaces, 2015, 7, 13238–13250 CAS.
- J. C. Park, J. H. Kim, H. S. Kwon and H. J. Song, Adv. Mater., 2009, 21, 803–807 CrossRef CAS.
- H. M. Wei, H. B. Gong, L. Chen, M. Zi and B. Q. Cao, J. Phys. Chem. C, 2012, 116, 10510–10515 CAS.
- L. Hu, Y. M. Huang, F. P. Zhang and Q. W. Chen, Nanoscale, 2013, 5, 4186–4190 RSC.
- P. P. Xu, J. J. Liu, T. Liu, K. Ye, K. Cheng, J. L. Yin, D. X. Cao, G. L. Wang and Q. Li, RSC Adv., 2016, 6, 28270–28278 RSC.
- D. S. Murali, S. Kumar, R. J. Choudhary, A. D. Wadikar, M. K. Jain and A. Subrahmanyam, AIP Adv., 2015, 5, 047143 CrossRef.
- M. Hara, T. Kondo, M. Komoda, S. Ikeda, K. Shinohara, A. Tanaka, J. N. Kondo and K. Domen, Chem. Commun., 1998, 3, 357–358 RSC.
- H. Xu, W. Wang and W. Zhu, J. Phys. Chem. B, 2006, 110, 13829–13834 CrossRef CAS PubMed.
- J. Shi, J. Li, X. J. Huang and Y. W. Tan, Nano Res., 2011, 4, 448–459 CrossRef CAS.
- C. S. Dong, M. L. Zhong, T. Huang, M. X. Ma, D. Wortmann, M. Brajdic and I. Kelbassa, ACS Appl. Mater. Interfaces, 2011, 3, 4332–4338 CAS.
- Y. Yu, L. Y. Zhang, J. Wang, Z. Yang, M. C. Long, N. T. Hu and Y. F. Zhang, Nanoscale Res. Lett., 2012, 7, 347 CrossRef PubMed.
- W. Zhai, F. Q. Sun, W. Chen, L. H. Zhang, Z. L. Min and W. S. Li, Mater. Res. Bull., 2013, 48, 4953–4959 CrossRef CAS.
- L. Liu, Y. H. Qi, J. S. Hu, Y. H. Liang and W. Q. Cui, Appl. Surf. Sci., 2015, 351, 1146–1154 CrossRef CAS.
- J. T. Zhang, J. F. Liu, Q. Peng, X. Wang and Y. D. Li, Chem. Mater., 2006, 18, 867–871 CrossRef CAS.
- Z. J. Li, N. N. Wang, Z. J. Lin, J. Q. Wang, W. Liu, K. Sun, Y. Q. Fu and Z. G. Wang, ACS Appl. Mater. Interfaces, 2016, 8, 20962–20968 CAS.
- K. B. Zhou, R. P. Wang, B. Q. Xu and Y. D. Li, Nanotechnology, 2006, 17, 3939–3943 CrossRef CAS.
- B. Pecquenard, F. L. Cras, D. Poinot, O. Sicardy and J.-P. Manaud, ACS Appl. Mater. Interfaces, 2014, 6, 3413–3420 CAS.
- D. P. Dubal, G. S. Gund, R. Holze, H. S. Jadhav, C. D. Lokhandeb and C.-J. Park, Dalton Trans., 2013, 42, 6459–6467 RSC.
- G. A. Artioli, A. Mancini, V. R. Barbieri, M. C. Quattrini, E. Quartarone, M. C. Mozzati, G. Drera, L. Sangaletti, V. Gombac, P. Fornasiero and L. Malavasi, Langmuir, 2016, 32, 1510–1520 CrossRef CAS PubMed.
- S. Zaman, A. Zainelabdin, G. Amin, O. Nur and M. Willander, J. Phys. Chem. Solids, 2012, 73, 1320–1325 CrossRef CAS.
- L. J. Wang, Q. Zhou, Y. J. Liang, H. L. Shi, G. L. Zhang, B. S. Wang, W. W. Zhang, B. Lei and W. Z. Wang, Appl. Surf. Sci., 2013, 271, 136–140 CrossRef CAS.
- L. J. Wang, Q. Zhou, G. L. Zhang, Y. J. Liang, B. S. Wang, W. W. Zhang, B. Lei and W. Z. Wang, Mater. Lett., 2012, 74, 217–219 CrossRef CAS.
- M. Yurddaskal, T. Dikici and E. Celik, Ceram. Int., 2016, 42, 17749–17753 CrossRef CAS.
- M. Villani, A. B. Alabi, N. Coppedè, D. Calestani, L. Lazzarini and A. Zappettini, Cryst. Res. Technol., 2014, 49, 594–598 CrossRef CAS.
- V. Scuderi, G. Amiard, S. Boninelli, S. Scalese, M. Miritello, P. M. Sberna, G. Impellizzeri and V. Privitera, Mater. Sci. Semicond. Process., 2016, 42, 89–93 CrossRef CAS.
- F. Wu, S. Banerjee, H. F. Li, Y. Myung and P. Banerjee, Langmuir, 2016, 32, 4485–4493 CrossRef CAS PubMed.
- Y. Y. Duan, X. Liu, L. Han, S. Asahina, D. D. Xu, Y. Y. Cao, Y. Yao and S. A. Che, J. Am. Chem. Soc., 2014, 136, 7193–7196 CrossRef CAS PubMed.
- M. Vaseem, A. Umar, S. H. Kim and Y.-B. Hahn, J. Phys. Chem. C, 2008, 112, 5729–5735 CAS.
- X. L. Deng, Q. Zhang, Q. Q. Zhao, L. S. Ma, M. Ding and X. J. Xu, Nanoscale Res. Lett., 2015, 10, 8 CrossRef PubMed.
- G. D. Wu, W. Zhai, F. Q. Sun, W. Chen, Z. Z. Pan and W. S. Li, Mater. Res. Bull., 2012, 47, 4026–4030 CrossRef CAS.
- K. Govender, D. S. Boyle, P. B. Kenway and P. O'Brien, J. Mater. Chem., 2004, 14, 2575–2591 RSC.
- S.-O. Kang, S. H. Hong, J. S. Choi, J.-S. Kim, I. R. Hwang, I.-S. Byun, Y. S. Kim, W. D. Kim and B. H. Park, J. Appl. Phys., 2010, 107, 053704 CrossRef.
- H. H. Wang, C. S. Xie, D. W. Zeng and Z. H. Yang, J. Colloid Interface Sci., 2006, 297, 570–577 CrossRef CAS PubMed.
- C.-H. Kuo and M. H. Huang, J. Phys. Chem. C, 2008, 112, 18355–18360 CAS.
- J.-Y. Ho and M. H. Huang, J. Phys. Chem. C, 2009, 113, 14159–14164 CAS.
- C.-H. Kuo, T.-E. Hua and M. H. Huang, J. Am. Chem. Soc., 2009, 131, 17871–17878 CrossRef CAS PubMed.
- B. High, D. Bruce and M. M. Richter, Anal. Chim. Acta, 2001, 449, 17–22 CrossRef CAS.
- P. S. Rendell, G. E. Batley and A. J. Cameron, Environ. Sci. Technol., 1980, 14, 314–318 CrossRef CAS PubMed.
- C. L. Allen, B. N. Atkinson and J. M. J. Williams, Angew. Chem., Int. Ed., 2012, 51, 1383–1386 CrossRef CAS PubMed.
- J. L. Liu, Z. Y. Gao, H. J. Han, D. P. Wu, F. Xu, H. X. Wang and K. Jiang, Chem. Eng. J., 2012, 185–186, 151–159 CrossRef CAS.
- C. H. Wang, Y. X. Ye, B. Tao and B. Y. Geng, CrystEngComm, 2012, 14, 3677–3683 RSC.
- R. C. Yang, Z. H. Zhang, Y. M. Ren, X. Zhang, Z. M. Chen and M. D. Xu, Mater. Sci. Technol., 2015, 31, 25–30 CrossRef CAS.
- L. Huang, F. Peng, H. Yu and H. J. Wang, Solid State Sci., 2009, 11, 129–138 CrossRef CAS.
- Y. Bessekhouad, D. Robert and J. V. Weber, Catal. Today, 2005, 101, 315–321 CrossRef CAS.
- H. G. Yu, J. G. Yu, S. W. Liu and S. Mann, Chem. Mater., 2007, 19, 4327–4334 CrossRef CAS.
- Z. K. Zheng, B. B. Huang, Z. Y. Wang, M. Guo, X. Y. Qin, X. Y. Zhang, P. Wang and Y. Dai, J. Phys. Chem. C, 2009, 113, 14448–14453 CAS.
- L. H. Zhang and X. F. Wang, Appl. Phys. A, 2014, 117, 2189–2196 CrossRef CAS.
- X. F. Lin, R. M. Zhou, J. Q. Zhang and S. T. Fei, Appl. Surf. Sci., 2009, 256, 889–893 CrossRef CAS.
- X. L. Deng, Q. Zhang, E. Zhou, C. J. Ji, J. Z. Huang, M. H. Shao, M. Ding and X. J. Xu, J. Alloys Compd., 2015, 649, 1124–1129 CrossRef CAS.
- Y. L. Du, N. Zhang and C. M. Wang, Catal. Commun., 2010, 11, 670–674 CrossRef CAS.
- J. Bandara, I. Guasaquillo, P. Bowen, L. Soare, W. F. Jardim and J. Kiwi, Langmuir, 2005, 21, 8554–8559 CrossRef CAS PubMed.
Footnote |
| † Electronic supplementary information (ESI) available. See DOI: 10.1039/c6ra27634b |
| This journal is © The Royal Society of Chemistry 2017 |