
 Open Access Article
 This Open Access Article is licensed under a
 Creative Commons Attribution 3.0 Unported Licence
Controllable synthesis of ultrathin nickel oxide sheets on carbon cloth for high-performance supercapacitors
Qianxiu Liu ab,
Chunxiang Lu*ac and
Ying Lid
ab,
Chunxiang Lu*ac and
Ying Lid
aCAS Key Laboratory of Carbon Materials, Institute of Coal Chemistry, Chinese Academy of Sciences, Taiyuan 030001, P. R. China. E-mail: chunxl@sxicc.ac.cn
bUniversity of Chinese Academy of Sciences, Beijing 100049, P. R. China
cNational Engineering Laboratory for Carbon Fiber Technology, Institute of Coal Chemistry, Chinese Academy of Sciences, Taiyuan 030001, P. R. China
dSchool of Materials Science and Engineering, North University of China, Taiyuan 030051, China
First published on 27th April 2017
Abstract
A small specific surface area and poor conductivity often limit the supercapacitor performance of metal oxide materials. In this work, we fabricated a nanocomposite based on NiO nanosheets with controllable size and thickness on carbon cloth (CC) by a cost-effective and scalable chemical precipitation method. The ultrathin nanosheets are coated on the CC with a diameter of 400 nm, showing a large specific surface area. The sample as a supercapacitor electrode displays a high specific capacitance (600.3 F g−1 at 1 A g−1), great rate capability and excellent long-term cycling life (98.1% after 3000 cycles). These great performances are attributed to the free-standing structure of the NiO nanosheets on the CC and the intimate contact of the NiO and CC. Also, an all-solid-supercapacitor was assembled to prove the possible prospects of the materials for flexible devices.
1 Introduction
Supercapacitors have been regarded as one of the promising candidates to meet the rising desire for solving the problem of energy shortage. They have higher power density than batteries, higher energy density than conventional electrostatic capacitors, fast charge and discharge rate and long service life.1–5 Electrode materials are the key part of supercapacitors with high performance. Metal oxides and hydroxides, such as RuO2,6 Ni(OH)2, NiO,7 MnO2,8 and Co3O4,9 are promising electrode materials due to their high theoretical specific capacitance, high chemical and thermal stability and ready availability.10–12 Among the investigated electrode materials, Ni(OH)2 and NiO draw much attention for their high capacitance and low cost nature.12,13The theoretical specific capacitance of Ni(OH)2 and NiO are 2584 F g−1 and 2082 F g−1, respectively.14 However, small specific surface area results in their relatively poor pseudocapacitance performance. More and more researches are settling down to design nanostructures to increase the specific surface area so that more redox reactions can be obtained.15 Meher16 et al. prepared nano-porous NiO samples with specific surface area up to 244 m2 g−1 by a simple hydrothermal method under homogeneous precipitation conditions using cetyltrimethyl ammonium bromide (CTAB) as the template, which showed a specific capacitance of 279 F g−1 at a scan rate of 5 mV s−1. Chai17 et al. obtained flower-like porous Ni(OH)2 by thermal decomposition of the precursor. The precursor was prepared by a hydrothermal process with hexamethylenetetramine and polyethylene glycol as hydrolysis-controlling agent and surfactant, respectively. The product exhibited a specific surface area of 72 m2 g−1 and a specific capacitance of 340 F g−1 at a current density of 1 A g−1. Therefore, designing nanostructured Ni(OH)2 and NiO with high specific surface area would obtain high-performance supercapacitors. Ultrathin sheets of Ni(OH)2 and NiO could increase the density of active sites in the materials,18 obtaining a better pseudocapacitance performance.
Rate capability is a significant factor to evaluate an electrode material. The sharp fall of electrode material's specific capacity at high scan rate or current density limits the application of Ni(OH)2 and NiO in market.19 Sun20 et al. prepared the NiO nanosheets by thermal treatment of porous Ni(OH)2 sheets, while the specific capacitance retained only 44.8% when the current density from 3 A g−1 to 15 A g−1. Hui17 et al. obtained flower-like porous NiO by thermal decomposition, displaying a high specific capacitance of 340 F g−1 at a current density of 1 A g−1, but only 121 F g−1 with retention of 35.6% at 10 A g−1. This is due to the poor conductivity of the Ni(OH)2 and NiO. And at high scan rate, the feature is more pronounced, causing a sharp reduction of the utilization of electrode materials.19,21 At the same time, the structure is inclined to collapse with the reactions.22 Inducing a substrate with good electric capability is an effective way to improve the rate capability.23–25 Carbon-based materials have been widely investigated as electrode substrates for their good electrical conductivity and remarkable mechanical properties. Carbon cloth (CC) stands out for high electrical conductivity, low density and a three-dimensional network for effective electrolyte diffusion. Moreover, the great flexibility of the CC provides the possibility in the application of flexible electronic devices. In situ synthesis is directly growing active materials in the substrates without the addition of conductive agent and agglomerants, which will avoid the problem of increased weight and deteriorated electrochemical performance.
In general, designing nanostructured Ni(OH)2 or NiO with high specific surface area on the CC could acquire a free-standing and bind-free flexible electrode material with great pseudocapacitance performance. In this work, the NiO nanosheets coated CC can be used as electrode directly. We obtained the different sized NiO nanosheets on the CC with different Ni(NO3)2 concentration solution. The specific capacitance of the CC coated with ultrathin NiO nanosheets with the diameter of 400 nm is remarkably higher than the others. At the same time, the electrode has good rate ability and long-term cycle life. Moreover, an all-solid-supercapacitor was assembled, showing a remarkable electrochemical performance, indicating the prospect of the materials for application in flexible devices.
2 Experimental
2.1 Preparation of conformally coated NiO nanosheets carbon cloth
The CC (1 × 3 cm, 0.036 g) was soaked in the mixture of concentrated HNO3 and H2SO4 (VHNO3![[thin space (1/6-em)]](https://www.rsc.org/images/entities/char_2009.gif) :VH2SO4 = 3:1) with a three necks flask refluxing at 80 °C for 3 h, and then the obtained CC was cleaned with a large number of water, ethyl alcohol and acetone. 4 mmol NH4F was dissolved in 40 mL Ni(NO3)2 solution with different concentration of 0.002, 0.004 and 0.008 mol L−1. Fig. 1 shows the schematic illustration for the synthesis of CC conformally coated NiO nanosheets. The mixture was vigorously stirred at 25 °C for 30 minutes until a homogeneous solution was obtained. Then a piece of CC put in and 2 mL ammonia dropwise added with the solution stirring. The solution containing a piece of CC was then transferred into a Teflon-lined stainless-steel autoclave and maintained at 150 °C for 6 h. After cooled down to room temperature, the CC was rinsed several times with deionized water and ethanol with the assistance of ultrasonication, and dried at 80 °C for 8 h. Then, the obtained sample after hydrothermal reaction was further calcined at 450 °C under the N2 atmosphere. The optical pictures of pure CC, Ni(OH)2 coated CC and NiO coated CC are shown in the Fig. 1e–g. The samples obtained on solution with different Ni(NO3)2 concentrations of 0.002, 0.004 and 0.008 mol L−1 were denoted as CCN1, CCN2 and CCN3, respectively. The weight of nanosheets coated on CC could be determined by measuring the weight difference of the CC before the hydrothermal reaction and after the calcination.
:VH2SO4 = 3:1) with a three necks flask refluxing at 80 °C for 3 h, and then the obtained CC was cleaned with a large number of water, ethyl alcohol and acetone. 4 mmol NH4F was dissolved in 40 mL Ni(NO3)2 solution with different concentration of 0.002, 0.004 and 0.008 mol L−1. Fig. 1 shows the schematic illustration for the synthesis of CC conformally coated NiO nanosheets. The mixture was vigorously stirred at 25 °C for 30 minutes until a homogeneous solution was obtained. Then a piece of CC put in and 2 mL ammonia dropwise added with the solution stirring. The solution containing a piece of CC was then transferred into a Teflon-lined stainless-steel autoclave and maintained at 150 °C for 6 h. After cooled down to room temperature, the CC was rinsed several times with deionized water and ethanol with the assistance of ultrasonication, and dried at 80 °C for 8 h. Then, the obtained sample after hydrothermal reaction was further calcined at 450 °C under the N2 atmosphere. The optical pictures of pure CC, Ni(OH)2 coated CC and NiO coated CC are shown in the Fig. 1e–g. The samples obtained on solution with different Ni(NO3)2 concentrations of 0.002, 0.004 and 0.008 mol L−1 were denoted as CCN1, CCN2 and CCN3, respectively. The weight of nanosheets coated on CC could be determined by measuring the weight difference of the CC before the hydrothermal reaction and after the calcination.
 | ||
| Fig. 1 Schematic illustration for the synthesis of CC conformally coated NiO nanosheets (a–d) and optical image of pure CC (e), CC after the hydrothermal reaction (f) and CC after the calcination (g). | ||
2.2 Preparation of non-conformal NiO nanosheets on carbon cloth
4 mmol NH4F was dissolved in 45 mL 0.004 mol L−1 Ni(NO3)2 solution. The mixture was vigorously stirred at 25 °C for 30 minutes until a homogeneous solution was obtained. 2 ml ammonia dropwise added with the solution stirring. The solution was then transferred into a Teflon-lined stainless-steel autoclave and maintained at 150 °C for 6 h. After cooled down to room temperature, the sample was rinsed several times with deionized water and ethanol with the assistance of ultrasonication, and dried at 80 °C for 8 h. Then, further calcination was performed at 450 °C under the N2 atmosphere. The obtained powder was mixed with carbon black and polyfluortetraethylene (PTFE) with the weight ratio of 80:10:10 and stirred until the homogeneous slurry was obtained. The slurry was pasting on the surface of the CC, and then dried in a vacuum at 80 °C for 8 h. The loading mass of the active material on the carbon cloth was calculated by the mass difference of the carbon cloth before pasting and after drying.
2.3 Characterization
X-ray diffraction (XRD) patterns of all the samples were recorded with Bruker D8-advance with Cu Kα radiation (λ = 0.15406 nm) to characterize the phase structures. The morphology of the products was examined by scanning electron microscopy (SEM, JSM-7001F). The specific surface area and the pore size distribution were evaluated from N2 adsorption–desorption analysis at 77 K on JW-BK 122 W. The specific surface area was achieved by the Brunauer–Emmett–Teller (BET) method. The pore size distribution was measured from the desorption plots by the Barrett–Joyner–Halenda (BJH) analysis.2.4 Electrochemical tests of as-prepared electrode materials
To examine the capacitive performance of the electrodes, cycle voltammetry (CV), galvanostatic charge–discharge (GCD) and electrochemical impedance spectroscopy (EIS) measurements were carried out by CHI660E using the three-electrode cell configuration in 2 M KOH electrolyte at room temperature. The samples were acted as a working electrode, a Pt sheet electrode and a saturated calomel electrode (SCE) as the counter and the reference electrodes, respectively. The LAND was used to test the stability of the NiO coated CC electrode at the current density of 2 A g−1.The CV curves of the samples were measured at the scan rate from 5 mV s−1 to 20 mV s−1 between 0–0.5 V. GCD investigations of the electrodes were performed between 0–0.5 V at different current densities from 0.5 A g−1 to 10 A g−1. The EIS measurements were carried out in the frequency range from 100 kHz to 0.01 Hz.
2.5 Electrochemical tests of all-solid-supercapacitors
First, the PVA/KOH gel electrolyte was made for flexible supercapacitor tests. 3 g PVA was added in 30 mL deionized water under stirring. The mixture was heated to 80 °C under vigorous stirring until a clear solution was obtained. Then 1.5 g KOH was added into the solution and stirred for 30 min. Then two piece of CCN2 were dipped into the PVA/KOH solution for 5 min. The CCN2 electrodes with a thin PVA/KOH coating were left at room temperature to vaporize the excess water. After that, two piece of CCN2 electrodes were pressed together, using a plastic sheet as packing shell. Thus, an all-solid-state flexible symmetric supercapacitor was obtained, which was named as SSC.The areal capacitance (CA, mF cm−2) and volumetric capacitance (CV, mF cm−3) of the symmetric supercapacitor were calculated from the galvanostatic charge–discharge (GCD) curves according to eqn (1)10 and (2), respectively:
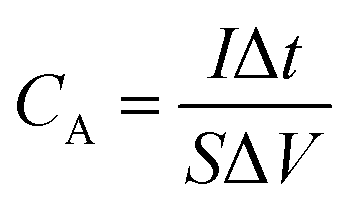 | (1) |
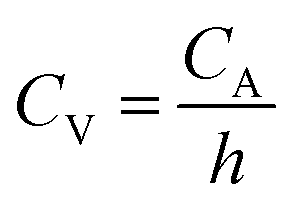 | (2) |
The CV curves of the SSC were measured at the scan rate from 5 mV s−1 to 100 mV s−1 between 0–0.5 V. GCD investigations of the electrodes were performed between 0–0.5 V at different current densities from 1 to 5 mA cm−2. The long-term electrochemical stability of the SSC was tested at the current density of 2 mA cm−2.
3 Results and discussion
To determine the phase of the NiO nanosheets on the CC and NiO powder, XRD measurement was performed. As shown in the Fig. 2, both the CCs after the hydrothermal reaction and the calcinations. Exhibit a broad peak around 24°, which is assigned to the typical amorphous structure of carbon of CC. Other diffraction peaks in the red curve can be assigned to the β-Ni(OH)2 phase, corresponding to (001), (100), (101), (102), (110), (111), (103) and (201) planes (JCPDS card no. 74-2075), respectively. No characteristic peaks of impurities are observed, indicating the high purity of the obtained Ni(OH)2. After the calcinations, the peaks corresponding to (111), (200), (220), (311) and (222) planes of cubic NiO (JCPDS card no. 47-1049) appear, and the XRD peaks of β-Ni(OH)2 disappear, indicating the pure NiO nanosheets had been obtained on the CC after calcination. The peaks of black curve are all corresponding to the peaks in the JCPDS card no. 47-1049, suggesting pure NiO powder was obtained.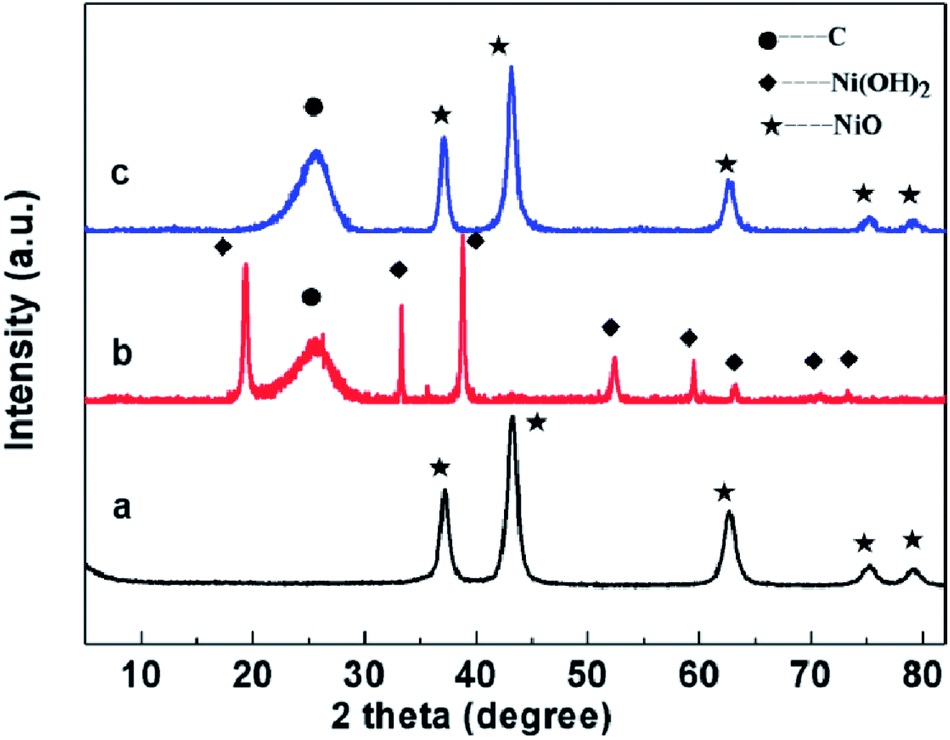 | ||
| Fig. 2 XRD patterns of samples: (a) NiO nanoflowers; (b) CCN2 before calcination; (c) CCN2. | ||
To control the size and thickness NiO nanosheets, different concentrations of Ni(NO3)2 solution of 0.002, 0.004 to 0.008 mol L−1 were prepared in the hydrothermal reaction and final weights of NiO nanosheets growing on CC were 0.5 mg, 1.0 mg and 1.5 mg, respectively. The surface color of the CC changed from black to green after the hydrothermal reaction (Fig. 1f), because Ni(OH)2 nanosheets produced. Then the color of CC changed to blackish green after the calcinations (Fig. 1g) for Ni(OH)2 changed to NiO. When the concentration of Ni(NO3)2 solution is 0.002 mol L−1, the ultrathin nanosheets on the surface of the CC exhibit diameter about 200 nm and thickness about 25 nm (Fig. 3a). The sheets on the CC are too few to cover the surface. The ultrathin nanosheets are uniformly growing on the surface of CC when the concentration of Ni(NO3)2 solution increased to 0.004 mol L−1 (Fig. 3b). It can be seen that the average diameter of the NiO nanosheets increases to about 400 nm, but the thickness keep almost invariant. The NiO nanosheets are closed packed and vertically aligned on the surface, which will ensure the NiO nanosheets contact to the CC sufficiently. When the concentration of Ni(NO3)2 solution is increased to 0.008 mol L−1, ultrathin nanosheets are overlapped together (Fig. 3c). As a result, the weight of the NiO nanosheets on the surface of CC increases apparently. At the same time, the diameter of the nanosheets also increases, and even up to 1 μm. Under the same experiment conditions of preparing CCN2 without CC, NiO nanoflowers were obtained (Fig. 3d). Without the supporting of CC, the NiO nanosheets gather together forming a bulb-like flower, and the size of the petal is several times of the nanosheets for CCN2. The average diameter of the nanoflowers is about 2 μm. The CC acted as the skeleton to support the Ni(OH)2 nanosheets synthesized in the hydrothermal reaction. Ni(OH)2 nanosheets combine with the CC via the chemical bond of X–Ni. X is the active functional group on the surface of CC.26 Thus, after calcinations NiO nanosheets show different morphology with and without the CC in the reaction.
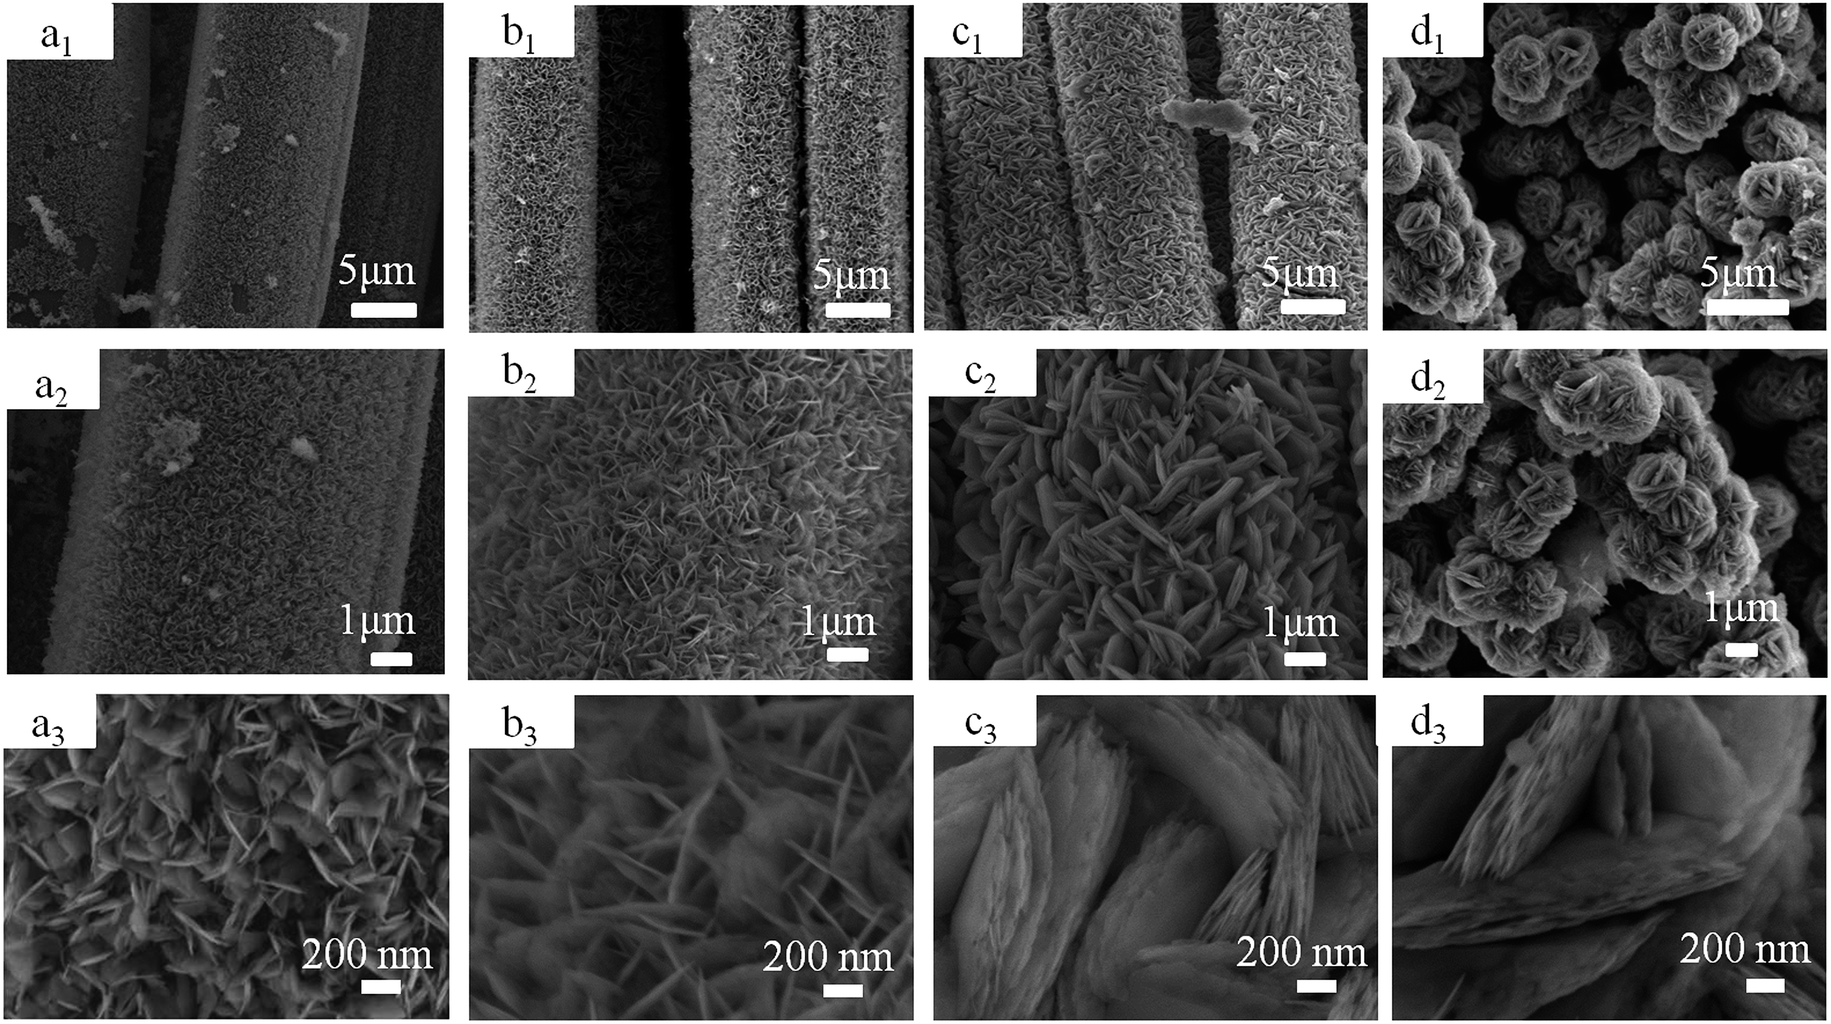 | ||
| Fig. 3 SEM images of CNN1 (a1, a2 and a3), CNN2 (b1, b2 and b3), CNN3 (c1, c2 and c3) and NiO nanoflowers (d1, d2 and d3) in different magnifications. | ||
The BET surface areas of different NiO nanosheets were calculated by the BET measurement. And the porous characteristics were performed by BJH measurements by the N2 adsorption–desorption, as shown in Fig. 4. Both the N2 adsorption–desorption isotherms of the CCN1, CCN2, CCN3 and NiO nanoflowers are containing a hysteresis loop corresponding to the type IV curve, indicating the mesoporous structure of the NiO nanosheets. The BET surface of the CC, CCN1, CCN2 and CCN3 are calculated to be 0.34, 7.03, 17.20 and 11.75 m2 g−1 (normalized by the total mass of the electrode), respectively. The BET surface of NiO nanoflower is calculated to be 91.52 m2 g−1. When we just consider of the weight of NiO on the CC, the BET surface of the nanosheets on CCN1, CCN2 and CCN3 are even calculated to be 167.59, 219.52 and 103.02 m2 g−1, respectively.27 The specific surface area of ultrathin nanosheets on CCN2 is much larger than that on CCN1 and CCN3. The pore size distribution patterns were measured from the desorption branch of the isotherms. The curves show the average pore diameters of CCN1, CCN2, CCN3 and NiO nanoflower are 4.80 nm, 4.82 nm, 5.71 nm and 5.74 nm, respectively. The pore size distribution of CCN1, CCN2, CCN3 and NiO nanoflowers mainly center in the range of 3 to 6 nm, 3 to 6 nm, 4 to 6 nm and 4 to 8 nm, respectively. Pore sizes of four samples are all in the mesoporous region, which is beneficial to the fast-transmission of the ions in the electrolyte.28 Comparing to the NiO nanoflowers, the NiO nanosheets have larger specific surface area and smaller pore size. As described above, the CC conformally coated by NiO nanosheets with high BET surface area has been controllable synthesized.
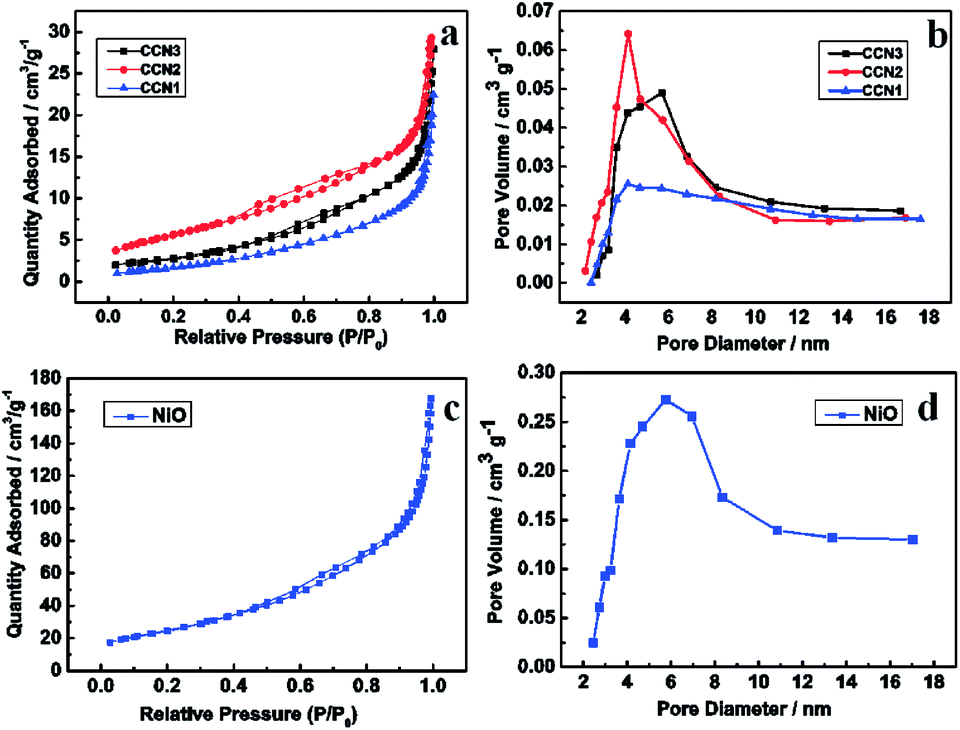 | ||
| Fig. 4 Nitrogen adsorption/desorption isotherms (a) and pore size distribution patterns (b) of CCN1, CCN2 and CCN3. Nitrogen adsorption/desorption isotherm (c) and pore size distribution pattern of NiO nanoflowers (d). | ||
The electrochemical redox processes in the samples were examined through cyclic voltammetry. The CV curves of CCN1, CCN2, CCN3 and NiO nanoflowers at a scan rate of 20 mV s−1 are shown in Fig. 5a. Four curves all contain a pair of redox peaks, implying that the capacitive characteristics of samples are governed by faradic redox reaction. The reaction is mainly originated from the faradic reactions related to Ni–O/Ni–O–OH, as the formula (3):29
| NiO + OH− ↔ NiOOH + e | (3) |
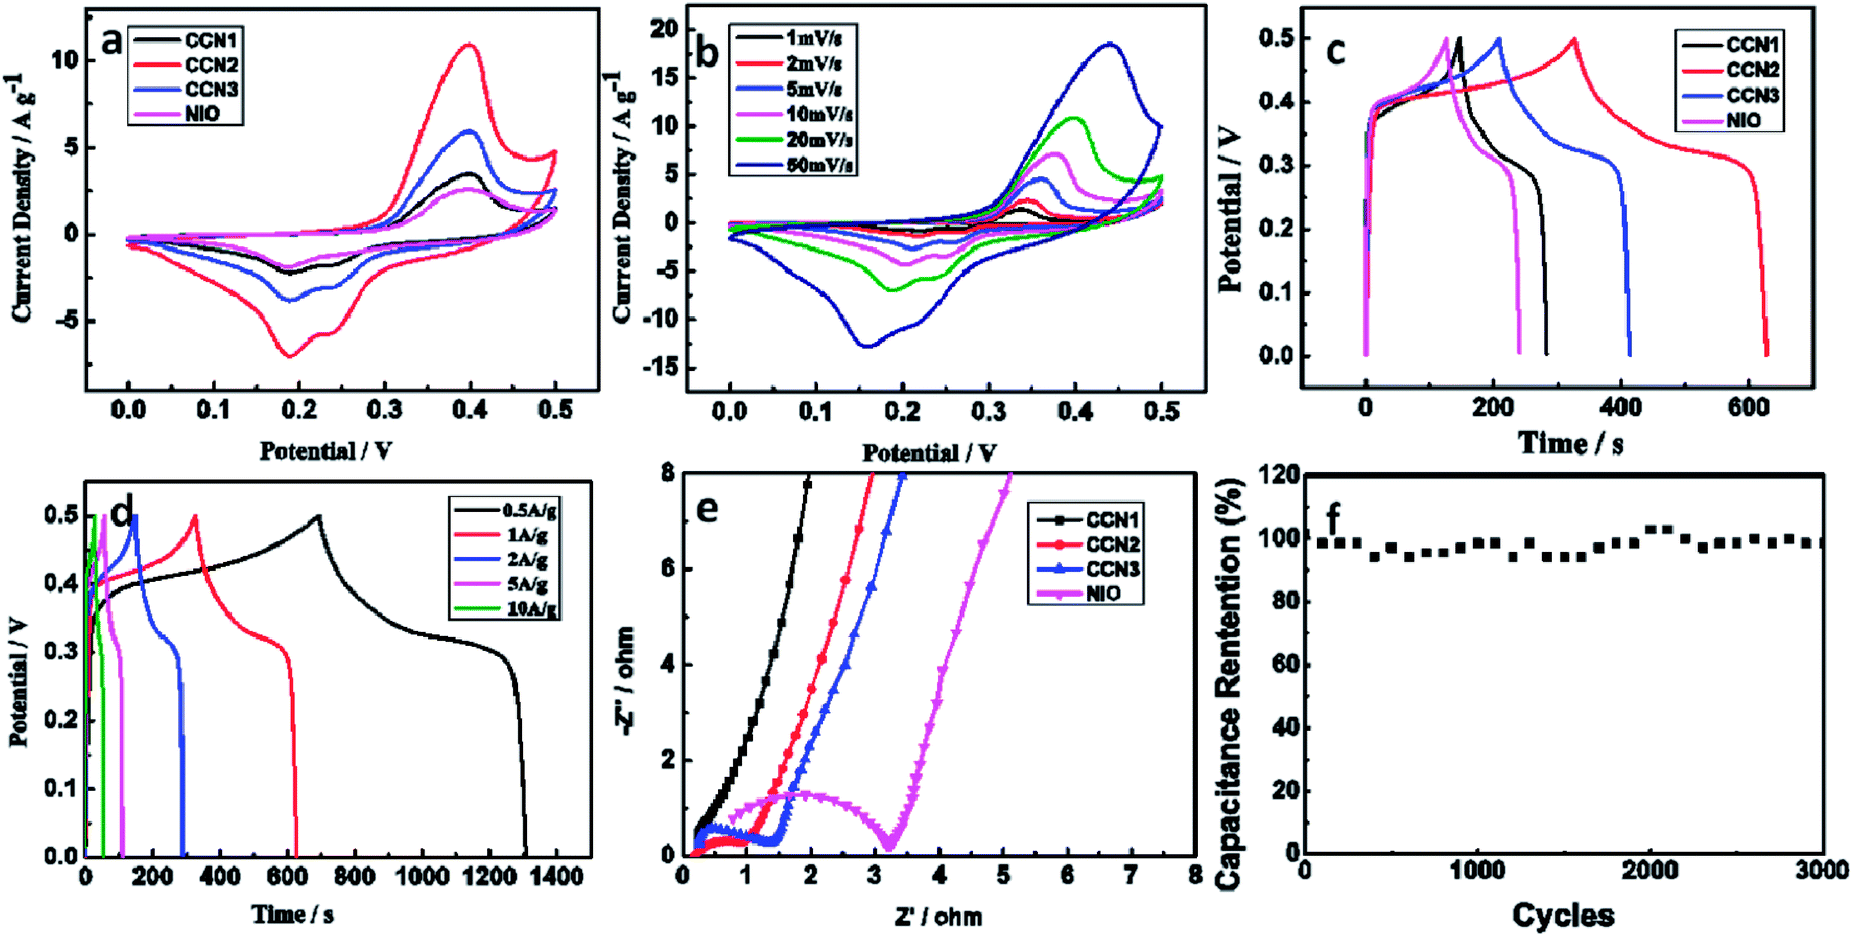 | ||
| Fig. 5 The electrochemical performance of samples in 2 M KOH. (a) CV curves of CCN1, CCN2, CCN3 and NiO nanoflowers at scan rate of 20 mV s−1. (b) CV curves of CCN2 at different scan rates. (c) GCD curves of CCN1, CCN2, CCN3 and NiO nanoflowers at current density of 1 A g−1. (d) GCD curves of CCN2 at different current densities. (e) Nyquist plots of CCN1, CCN2, CCN3 and NiO nanoflowers in the frequency range of 100 kHz to 0.01 Hz. (f) Retention of specific capacitance with the cycle number at a current density of 2 A g−1 of the CCN2. | ||
The CV curve of CCN2 shows largest area. It can be interpreted that the NiO nanosheets on CCN2 have biggest BET surface, containing more active sites to introduce more redox reactions. At the same time, CCN3 and CCN1 have better performance than NiO nanoflowers. With the supporting of CC, NiO nanosheets on the CC have bigger BET surface. And the NiO nanosheets on the CC contact to the electrolyte sufficiently, facilitating the electron transmission between the electrode and active materials.30 As shown in Fig. 5b, the CV curves of CCN2 at different scan rates exhibit the well-defined pair of strong redox peaks. The electrode presents well-defined reversible reduction and oxidation process and the redox current increases clearly with the scan rate increasing. At the same time, there shows a slight shift in both cathodic and anodic peak potentials, indicating the little increase of the internal diffusion resistance within the ultrathin nanosheets on the CCN2.31
GCD curves of the four samples between 0–0.5 V at 1 A g−1 are shown in the Fig. 5c. Corresponding to the GCD curves, CCN2 exhibits the specific capacitance of 600.3 F g−1, CCN1, CCN3 and NiO nanoflowers only show the specific capacitance of 260.3 F g−1, 404.2 F g−1 and 228.6 F g−1, respectively. The highest capacitance of CCN2 is contributed by the largest specific surface area, and the result consists with CV curves. Further GCD investigation of the CCN2 between 0–0.5 V at different current densities are shown in Fig. 5d. The specific capacitances of the electrode at 0.5, 1 2, 5, and 10 A g−1 are 614.1, 600.3, 570.4, 527.0 and 456.0 F g−1, respectively. The capacitance retention at 10 A g−1 is still 75.9% of that at 1 A g−1, demonstrating the CCN2 electrode exhibits good rate capability. This is mainly because the NiO nanosheets on CCN3 can contact to the CC more sufficiently, shortening the electron transmission distance. This is mainly due to the close contact between the NiO nanosheets and CC, as well as the great conductivity of CC, resulting in fast electron diffusion at high current density.
The EIS measurements were performed in the frequency range from 100 kHz to 0.01 Hz to further confirm the enhanced electrochemical performance of the ultrathin NiO nanosheets coated CC. Fig. 5e shows Nyquist plots of EIS spectra of the four samples. Nyquist plots exhibit the similar shape. The diameter of capacitive loop in high-frequency region is attributed to the charge transfer resistance. The diameter of capacitive loop for CCN1, CCN2 and CCN3 electrode are much smaller than that for NiO nanoflower. This low charge-transfer resistance is attributed to the great conductivity of CC, facilitating the electron transport. In addition, each NiO nanoflake on the CC has its own electrical contact with the electrode. The high-frequency intercept of the capacitive loop on the real axis yields corresponds to the bulk solution resistance. CCN1, CCN2 and CCN3. The steeper lines in low-frequency indicate the electrode reactions are affected by diffusion resistance of the sample to some extent.
To study the long-term electrochemical stability of the CCN2, the LAND was used to test the stability of the CCN2 electrode at the current density of 2 A g−1. Fig. 5f shows that the capacitance retention ratio approached 98.1% after 3000 cycles, indicating the outstanding stability of the electrode.
To further evaluate the flexibility of the electrode, an all-solid-state supercapacitor was prepared. The CV curves (Fig. 6a) of SSC exhibit rectangular-like shape. Fig. 6b shows the GCD curves of SSC at different current densities. The CA calculated by the GCD curves are 34.3, 29.6 and 27.3 mF cm−2 at the current densities of 1, 2 and 4 mA cm−2, respectively. The corresponding CV could reach 1143.33, 986.66 and 910.00 mF cm−3, respectively. Capacitance retention of SCC at 1 mA cm−2 bending for 90° and 180° were shown as Fig. 6c. After bending, the capacitance fluctuation is less than 5%, implying the potential application in flexible storage field. The specific capacitance retention of the SSC decays about 12.8% after 300 cycles (Fig. 6d). The insert shows the specific capacitance retention of the SSC under bending for 180°. The specific capacitance retention declines 16.3% after 300 cycles, suggesting good cycling stability of the flexible SSC device.
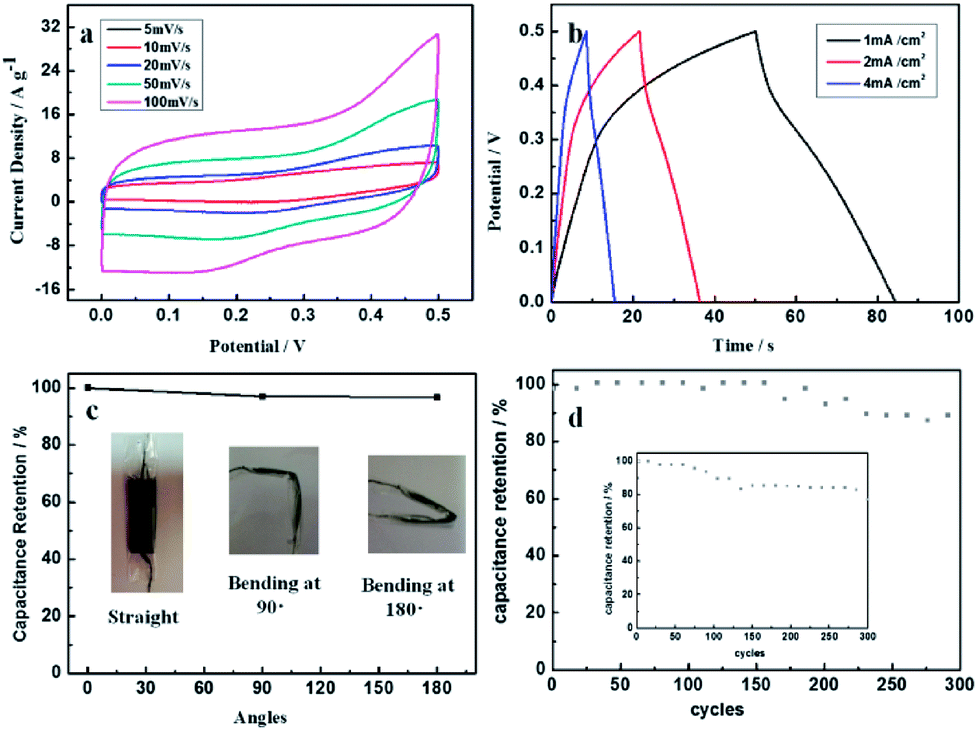 | ||
| Fig. 6 The electrochemical performance of SSC. (a) CV curves of SSC at different scan rates. (b) Galvanostatic charge–discharge curves of SSC at different current densities. (c) Capacitance retention at 1 mA cm−2 of SCC bending for 90° and 180°. The insert shows the optical pictures of SCC bending for different angles. (d) Cycling performance of SSC at a current density of 2 mA cm−2. The insert shows the cycling performance of SSC bending for 180°. | ||
4 Conclusions
In this work, the uniform and conformal coating of ultrathin nanosheets on the carbon cloth was prepared using a cost-effective and scalable chemical precipitation method. The CC coated with NiO nanosheets has bigger BET surface area and smaller pore size than NiO nanoflowers, thus a better pseudocapacitance performance is obtained. Among the different NiO nanosheets coated CC, nanosheets with ultrathin thickness and with the diameter of 400 nm coated CC has the biggest BET surface area and the highest specific capacitance (600.3 F g−1 at 1 A g−1). In addition, it has good rate performance and excellent cycle stable (98.1% after 3000 cycles). In addition, the SSC assembled by the CCN2 shows an area capacitance of 34.3 mF cm−2 at the current densities of 1 mA cm−2. And cycling stability was proved of the SSC bending for different angles, implying CC coated with NiO nanosheets has a great application prospect on the flexible electronic devices.Acknowledgements
This work is supported by the National Engineering Laboratory for Carbon Fiber Technology, Institute of Coal Chemistry, Chinese Academy of Sciences, China.Notes and references
- P. Simon and Y. Gogotsi, Nat. Mater., 2008, 7, 845–854 CrossRef CAS PubMed
.
- M. Beidaghi and Y. Gogotsi, Energy Environ. Sci., 2014, 7, 867–884 CAS
- L. Dong, C. Xu, Y. Li, Z. H. Huang, F. Kang, Q. H. Yang and X. Zhao, J. Mater. Chem. A, 2016, 1–3 CAS
- L. Dong, C. Xu, Y. Li, C. Wu, B. Jiang, Q. Yang, E. Zhou, F. Kang and Q. H. Yang, Adv. Mater., 2016, 28, 1675–1681 CrossRef CAS PubMed
- L. Dong, G. Liang, C. Xu, W. Liu, Z. Z. Pan, E. Zhou, F. Kang and Q. H. Yang, Nano Energy, 2017, 34, 242–248 CrossRef CAS
- M. G. Jeong, K. Zhuo, S. Cherevko, W. J. Kim and C. H. Chung, J. Power Sources, 2013, 244, 806–811 CrossRef CAS
- X. Zhang, W. Shi, J. Zhu, W. Zhao, J. Ma, S. Mhaisalkar, T. L. Maria, Y. Yang, H. Zhang, H. H. Hng and Q. Yan, Nano Res., 2010, 3, 643–652 CrossRef CAS
- Y. X. Zhang, M. Huang, F. Li, X. L. Wang and Z. Q. Wen, J. Power Sources, 2014, 246, 449–456 CrossRef CAS
- X.-H. Xia, J.-P. Tu, X.-L. Wang, C.-D. Gu and X.-B. Zhao, Chem. Commun., 2011, 47, 5786–5788 RSC
- H. C. Gao, F. Xiao, C. B. Ching and H. W. Duan, ACS Appl. Mater. Interfaces, 2012, 4, 7020–7026 CAS
- J. Jiang, Y. Li, J. Liu, X. Huang, C. Yuan and X. W. Lou, Adv. Mater., 2012, 24, 5166–5180 CrossRef CAS PubMed
- G. Q. Zhang, L. Yu, H. E. Hoster and X. W. Lou, Nanoscale, 2013, 5, 877–881 RSC
- Y. Tokudome, N. Tarutani, K. Nakanishi and M. Takahashi, J. Mater. Chem. A, 2013, 1, 7702–7708 CAS
- M. Zhi, C. Xiang, J. Li, M. Li and N. Wu, Nanoscale, 2013, 5, 72–88 RSC
- Y. Ren and L. A. Gao, J. Am. Ceram. Soc., 2010, 93, 3560–3564 CrossRef CAS
- S. K. Meher, P. Justin and G. R. Rao, Nanoscale, 2011, 3, 683–692 RSC
- H. Chai, X. Chen, D. Z. Jia, S. J. Bao and W. Y. Zhou, Mater. Res. Bull., 2012, 47, 3947–3951 CrossRef CAS
- Y. Q. Zhu, H. Z. Guo, Y. Wu, C. B. Cao, S. Tao and Z. Y. Wu, J. Mater. Chem. A, 2014, 2, 7904–7911 CAS
- Q. Lu, J. G. G. Chen and J. Q. Xiao, Angew. Chem., Int. Ed., 2013, 52, 1882–1889 CrossRef CAS PubMed
- X. Sun, G. K. Wang, J. Y. Hwang and J. Lian, J. Mater. Chem., 2011, 21, 16581–16588 RSC
- J. W. Weidner and P. Timmerman, J. Electrochem. Soc., 1994, 141, 346–351 CrossRef CAS
- A. K. Mondal, D. Su, Y. Wang, S. Chen and G. Wang, Chem.–Asian J., 2013, 8, 2828–2832 CrossRef CAS PubMed
- J. Li, W. Zhao, F. Huang, A. Manivannan and N. Wu, Nanoscale, 2011, 3, 5103–5109 RSC
- J. Zhu, J. Jiang, J. Liu, R. Ding, H. Ding, Y. Feng, G. Wei and X. Huang, J. Solid State Chem., 2011, 184, 578–583 CrossRef CAS
- Z. Lu, Z. Chang, J. Liu and X. Sun, Nano Res., 2011, 4, 658–665 CrossRef CAS
- X. Luo, C. Lu and M. Zhang, Electroplationg & Finishing, 2010, vol. 29, pp. 21–23 Search PubMed
- W. Yang, G. Cheng, C. Dong, Q. Bai, X. Chen, Z. Peng and Z. Zhang, J. Mater. Chem. A, 2014, 2, 20022–20029 CAS
- H. Liu, G. Wang, J. Liu, S. Qiao and H. Ahn, J. Mater. Chem., 2011, 21, 3046–3052 RSC
- H. Yan, D. Zhang, J. Xu, Y. Lu, Y. Liu, K. Qiu, Y. Zhang and Y. Luo, Nanoscale Res. Lett., 2014, 9, 424–430 CrossRef PubMed
- I. Shakir, M. Nadeem, M. Shahid and D. J. Kang, Electrochim. Acta, 2014, 118, 138–142 CrossRef CAS
- X. Dai, D. Chen, H. Fan, Y. Zhong, L. Chang, H. Shao, J. Wang, J. Zhang and C.-n. Cao, Electrochim. Acta, 2015, 154, 128–135 CrossRef CAS
| This journal is © The Royal Society of Chemistry 2017 |