
 Open Access Article
 This Open Access Article is licensed under a
 Creative Commons Attribution 3.0 Unported Licence
Effect of tungsten surface density of WO3–ZrO2 on its catalytic performance in hydrogenolysis of cellulose to ethylene glycol†
Jiachun Chaiab,
Shanhui Zhu *a,
Youliang Cenab,
Jing Guoab,
Jianguo Wanga and
Weibin Fan*a
*a,
Youliang Cenab,
Jing Guoab,
Jianguo Wanga and
Weibin Fan*a
aState Key Laboratory of Coal Conversion, Institute of Coal Chemistry, Chinese Academy of Sciences, Taiyuan, Shanxi 030001, PR China. E-mail: fanwb@sxicc.ac.cn; zhushanhui@sxicc.ac.cn
bUniversity of Chinese Academy of Sciences, Beijing 100049, PR China
First published on 27th January 2017
Abstract
One-pot hydrogenolysis of cellulose to ethylene glycol (EG) was carried out on WO3-based catalysts combined with Ru/C. To probe the active catalytic site for breaking the C–C bond of cellulose, a series of WO3–ZrO2 (WZr) catalysts were synthesized and systematically characterized with XRD, Raman, UV-Vis, H2-TPR, DRIFS and XPS techniques and N2 physisorption experiment. It was found that the WO3 crystallites became more easily reduced to W5+–OH species with increasing crystallite size or tungsten surface density of the WZr catalyst owing to the decrease of their absorption edge energy (AEE) originating from weakening their interaction with ZrO2 support. This, as a result, gave higher EG yield at higher tungsten surface density. The structure–activity relationship of the WZr catalyst reveals that the active catalytic site for cleaving the C2–C3 bond of the glucose molecule is the W5+–OH species.
1. Introduction
Abundant sustainable lignocellulose is an alternative feedstock to fossil fuels for producing chemicals and oils with less emission of CO2.1–4 Generally, lignocellulose contains 35–50% of cellulose, 20–25% of hemicellulose, and 10–25% of lignin.5,6 Cellulose consists of glucose monomer units connected through β-1,4-glycosidic linkages, which leads to a fibrous crystalline structure with large amounts of intra- and intermolecular hydrogen bonds, and consequently, makes it difficult to be hydrolyzed.1,7,8 Therefore, selective transformation of cellulose into a specific chemical is a promising but challenging task.9,10To date, various catalytic systems have been developed to convert cellulose into profitable chemicals, including sugar alcohols, glucose, lactic acid, 5-hydroxymethylfurfural (5-HMF), levulinic acid (LA), ethylene glycol (EG), propylene glycol and alkanes.11 Among them, EG is an important commodity chemical. It is widely used as a functional fluid such as antifreeze, coolant, and monomer for synthesis of polyester fiber and resin.12–14 Currently, EG is mainly produced through two-step transformation of petroleum-derived ethene, including selective oxidation of ethene to epoxide and subsequent hydrolysis of the generated epoxide.13,15
Recently, a new route has been developed by direct hydrogenolysis of cellulose to EG over Ni-W2C/AC by Zhang and coworkers.16 This route provides a new potential approach for the production of EG. It will not only alleviate the dependence on the non-regenerated petroleum, but also reduce the net emission of CO2.14,17 Moreover, this process is highly atom-economic because most of the carbon atoms and hydroxyl groups from cellulose are well reserved in the products.18 Further studies reveal that the combination of W species with RANEY® Ni is effective for the selective conversion of cellulose to EG. Zhang and coworkers assumed that soluble HxWO3 species played a crucial role in selectively breaking the C–C bond of glucose.19 The detection of glycolaldehyde intermediate suggests that HxWO3-catalyzed C–C cleavage of glucose should follow the retro-aldol pathway as it is subsequently hydrogenated into EG over Ru or Ni.20,21 This is, however, denied by Liu and coworkers, who found that 2-deoxy-glucose couldn't transform into EG on WO3 and Ru/C under the same conditions.22 Therefore, they thought that the adjacent α-OH group in the sugar molecule underwent the C–C bond cleavage over WO3 through the formation of complex. Their work demonstrated that W species are catalytically active for the synthesis of EG from cellulose, but the catalytic mechanism, especially the structure of active site has not been illustrated. This directly affects the design of advanced catalyst.
Among different types of WOx-based catalysts employed in the cellulose conversion reaction, tungstated zirconia shows unique performance, because it has high stability under both reduction and hydrothermal conditions.23 Besides, it has been confirmed that WOx species on ZrO2 can generate strong acid sites.24 The lower surface free energy of WO3 than that of ZrO2 causes WO3 to thermally spread on the ZrO2.25 In general, the WOx state on the ZrO2 support depends on its surface density.26 Below the monolayer surface coverage (<4 W nm−2), tungstate are monotungstate and polytungstate species. When the surface density is increased to 4–8 W nm−2, polytungstate and crystalline WO3 nanoparticles are the main phases. A further increase in the surface density to >8 W nm−2 leads to formation of bulky WO3 crystals. It has been widely accepted that the structure and catalytic activity of WO3 species on ZrO2 is only determined by the tungsten surface density (W nm−2).27 Liu and coworkers found that the yield of EG increased with increasing tungsten surface density until the formation of primarily crystalline WO3. A further increase in the agglomeration degree of WO3 did not change the EG yield. This indicates that WO3 crystallites act as solid acid sites to catalytically cleave the C–C bonds in the intermediate sugar molecules.22
However, we found that the EG yield still increased with further increasing WO3 size by elevating calcination temperature or increasing tungsten loading supported on zirconia, showing that the reaction process has not been clearly understood yet. Hence, the process for hydrogenolysis of cellulose to EG over WO3/ZrO2 is investigated here for illustrating the structure of active catalytic site and the catalytic mechanism. It is shown that W5+–OH species is the active site for catalyzing the glucose to glycolaldehyde (GA).
2. Experimental
2.1. Catalyst preparation
The WZr catalysts were prepared according to the following procedures. First, Zr(OH)4 (Aladdin) was added in the aqueous solution of (NH4)10W12O41 (Sinopharm Chem. Reagent Co., Ltd), and refluxed at 110 °C for 9 h. Then, the solid sample was dried at 80 °C overnight in an oven. Finally, the sample was calcined at 600, 650, 700, 750, 800, 850 and 900 °C for 3 h in air. The resultant sample was designated as ZWx,t with x and t representing the tungsten content (wt%) and the calcination temperature (°C) respectively.Tungsten oxide (WO3), phosphotungstic acid (H3PW12O40), silicotungstic acid (H4SiW12 O40) and cellulose (the crystalline can be seen in Fig. S1†) were purchased from Sinopharm Chem. Reagent Co., Ltd. Ru/C was obtained from Aladdin.
2.2. Catalyst characterization
N2 physisorption isotherms were measured at −196 °C on a Tristar II 3020 volumetric adsorption analyzer after the sample was pretreated at 150 °C for 4 h under high vacuum conditions. The specific surface area was calculated by the Brunauer–Emmett–Teller (BET) method.X-ray diffraction (XRD) patterns were recorded in the 2θ range of 20–70° at a scanning rate of 4° min−1 on a Rigaku MiniFlex II desktop X-ray diffractometer equipped with CuKα radiation.
Raman spectra of raw powders were obtained at room temperature on a Horiba LabRAM HR800 spectrometer using the 514 nm argon ion laser with a long-distance objective (50×). The laser power density on the sample was kept low enough to assure that the material was not decomposed. The spectra of samples were obtained by directly focusing the laser on their upper parts.
Diffuse reflectance (DR) UV-Vis spectra were collected from 200 to 800 nm at a scanning rate of 600 nm min−1 on a Cary 5000 UV-Vis-NIR spectrophotometer with a spectral resolution of 2 nm. The Teflon reference was used for the baseline calibration.
The H2 temperature-programmed reduction (H2-TPR) was conducted on a Micromeritics AutoChem II 2920 chemisorption analyzer. First, 30 mg sample was loaded in a U-type reactor and heated to 300 °C in Ar flow (30 mL min−1). Then, the sample was cooled to room temperature after 2 h, and the Ar flow was switched to a 10% H2/Ar flow (30 mL min−1). Finally, the temperature was increased to 750 °C at a rate of 5 °C min−1, and the consumed H2 amount was monitored by a thermal conductivity detector (TCD).
In situ diffuse reflectance infrared spectra (DRIFS) of WZr30,800 were measured on a Nicolet iS10 Fourier transform infrared spectrometer (Thermo Scientific) equipped with a MCT detector cooled with liquid N2, a diffuse reflectance accessory (Thermo Scientific Spectra-Tech Collector II) and an in situ cell (High Pressure Catalytic Chamber 0030-102). The spectra were collected at a resolution of 4 cm−1 by accumulating 32 scans at room temperature after the self-supported wafers were pretreated at 400 °C for 2 h in Ar flow (50 mL min−1). The sample reduction was conducted at 400 °C for 2 h in 10% H2/Ar flow (50 mL min−1).
The X-ray photoelectron spectra (XPS) of WZr30,800 before and after reduction were taken on a Kratos AXIS ULTRA DLD spectrometer equipped with a monochromated AlKα radiation source (hv = 1486.6 eV) and a multichannel detector. All the spectra were recorded by using an aperture slot of 300 × 700 μm, and the survey spectra were recorded with the pass energy of 160 eV, while high-resolution spectra were collected with the pass energy of 40 eV. The binding energies were calibrated with adventitious C 1s peak (284.8 eV) as the reference. The experimental error was ±0.1 eV.
2.3. Catalytic test
All the catalytic experiments were carried out in a batch reactor (100 mL stainless steel autoclave). The typical reaction conditions are as follows: 0.08 g WZrx,t, 0.01 g Ru/C, 0.3 g cellulose, 40 mL water, initial H2 pressure of 5.2 MPa, temperature of 215 °C, reaction time of 1.5 h, and stirring rate of 1000 rpm. After reaction, the liquid sample was centrifuged to separate from the solid catalyst. The low boiling-point products were analyzed by a Shimadzu GC-2014C gas chromatograph equipped with a DB-WAX column and a flame ionization detector (FID) using n-butanol as internal standard, whereas the high boiling-point products were analyzed using the external standard method by a LC-10Avp HPLC equipped with an Aminex HPX-87H column and refractive index detector. The cellulose conversion was calculated by the total organic carbon (TOC) method in terms of the carbon content of the liquid products following the equation: conversionTOC (%) = (moles of total organic carbon in the reaction liquid)/(moles of carbon in cellulose charged into the reactor) × 100%.28 The yields of polyols were calculated by using the equation: yield (%) = (molar amount of the product × carbon content in the product)/(molar amount of cellulose charged into the reactor × 6) × 100%.3. Results and discussions
3.1. Characterization of samples
Fig. 1 shows that when the calcination temperature increased from 600 to 900 °C, the BET surface area of WZr30,t declined from 115 to 29 m2 g−1 due to the sintering of ZrO2, while the tungsten surface density rose from 7.2 to 27.9 W nm−2. This makes the average distance among the dispersed WOx particles shortened, resulting in the evolution of two-dimensional polytungstate clusters into three-dimensional WO3 crystallites.29 It was indicated by the catalyst color change from white to yellow at 650 °C,30 and was confirmed by the XRD measurements. No obvious diffraction peaks (at 2θ range of 23–25°) characteristic of monoclinic WO3 (ref. 31) was observed for the sample calcined at 600 °C (Fig. 2), but they were visible at 650 °C, and the intensity increased with the calcination temperature, showing the gradual increase of WO3 particle size as a result of the severe agglomeration of surface WO3 species. The supported surface WO3 species can stabilize the tetragonal phase of ZrO2,32,33 as substantiated by the finding that this structural phase was totally kept below 850 °C. Even when the calcination temperature reached 900 °C, only a very small amount of monoclinic ZrO2 was formed. | ||
| Fig. 1 Changes of the BET surface area and the tungsten surface density of WZr30,t with the calcination temperature. | ||
 | ||
| Fig. 2 XRD patterns of WZr30,t calcined at different temperature. | ||
Raman spectroscopy is a very sensitive technique for detecting the supported oxide species.34 The round band at about 647 cm−1 is associated with tetragonal ZrO2 (Fig. 3), while those around 960 and 996 cm−1 are ascribed to the symmetric stretching mode of terminal W![[double bond, length as m-dash]](https://www.rsc.org/images/entities/char_e001.gif) O vibrations in hydrated polytungstate species and at the surface of WO3 crystals.35,36 As for the two sharp bands at 716 and 807 cm−1, they are attributed to W–O bending and stretching modes in microcrystalline WO3.35,37 These two bands greatly intensify, while those at 960 and 996 cm−1 remain almost constant with the calcination temperature. This gives another piece of evidence for the more severe agglomeration of WO3 species at higher calcination temperature.
O vibrations in hydrated polytungstate species and at the surface of WO3 crystals.35,36 As for the two sharp bands at 716 and 807 cm−1, they are attributed to W–O bending and stretching modes in microcrystalline WO3.35,37 These two bands greatly intensify, while those at 960 and 996 cm−1 remain almost constant with the calcination temperature. This gives another piece of evidence for the more severe agglomeration of WO3 species at higher calcination temperature.
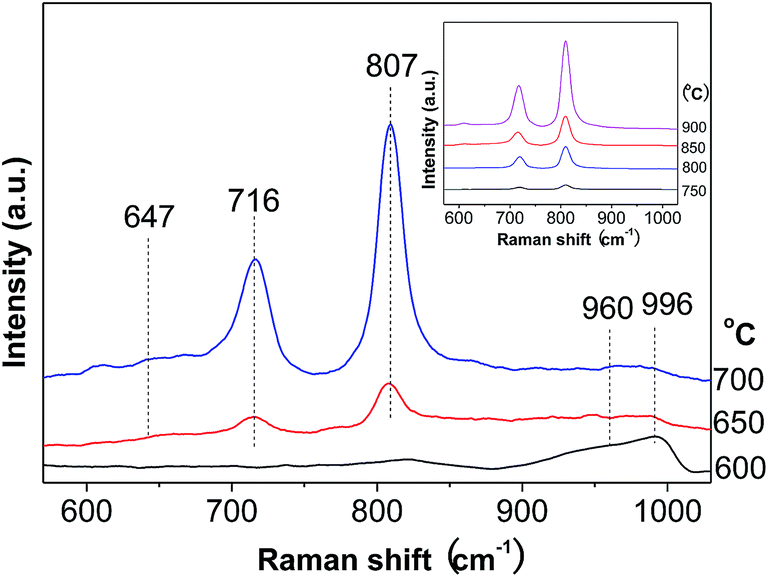 | ||
| Fig. 3 Raman spectra of WZr30,t calcined at different temperature. | ||
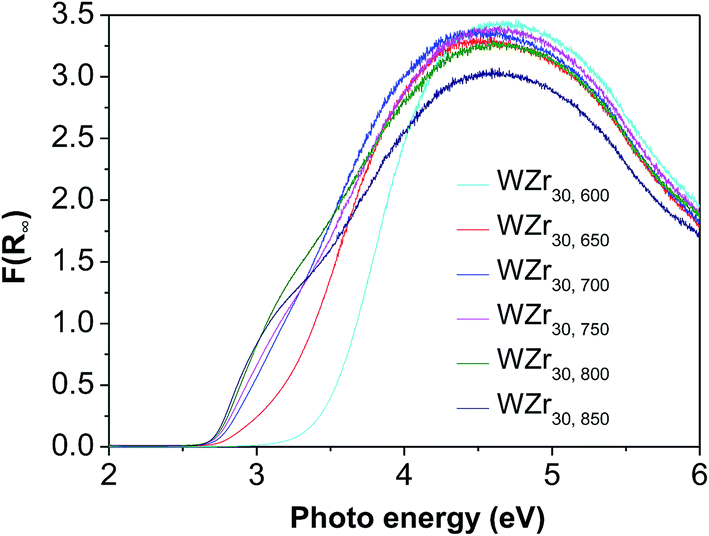
The good charge-storage/delivery property of WO3 originates from the redox reaction of W6+ ↔ W5+.38,39 Fig. 4 shows the DR UV-Vis spectra of different W compounds. The lowest absorption edge energy (AEE) of six-coordinated W6+ in monoclinic WO3 indicates that it contains an extended three-dimensional crystalline network of octahedra bonded to six neighboring octahedra. The isopolytungstates in phosphotungstic acid, silicotungstic acid and ammonium paratungstate connect octahedra bonded through corners and edges, and these samples share higher AEE. Moreover, the AEE value is relevant to not only the bonding geometry but also the crystallite size for small semiconductor nanocrystals.35,40 Fig. 5 compares the DR UV-Vis spectra of WZr30,t catalysts. The increase of the calcination temperature causes the shift of AEE to low value, which leads to a narrowing of HOMO–LUMO gap,41 and hence, would facilitate the reduction of WO3 species. XRD and Raman spectroscopy results reveal that the particles increase in size with the increase of calcination temperature. In addition, for nano-sized WO3 with an increased grain size, the bandgap generally decreases, which is attributed to the quantum-size effect.39,42 Thus, it can be inferred that the bigger the WO3 crystallite size is, the more feasible the charge delocalization is,43 and the more reducible the surface WO3 species would be. Indeed, this is confirmed by the H2-TPR results of samples calcined at different temperature.
 | ||
| Fig. 4 DR UV-Vis spectra of different W-containing compounds. | ||
 | ||
| Fig. 5 DR UV-Vis spectra of various WZr30,t catalysts. | ||
Fig. 6 shows the H2-TPR profiles of various WZr30,t samples. The peak between 450 and 550 °C is due to reduction of WO3 to WO2.9, and that around 775 °C is ascribed to further reduction of WO2.9 to WO2.31,44 Pure ZrO2 does not show any detectable TPR peak at temperature <1000 °C. Clearly, no obvious reduction peak was present below 625 °C in the H2-TPR profile of WZr30,600, whereas all the other samples calcined in the temperature range of 650–850 °C showed a broad peak between 450 and 550 °C, and it shifted to low temperature with the calcination temperature. This confirms that the reduction degree of WO3 increases with its particle size as a result of weakening of its interaction with ZrO2 support. The same AEE of WZr30,850 and WZr30,900 (Fig. S2†) indicates that the reducibility of these two samples are similar, which is confirmed by their H2-TPR results (Fig. S3†).
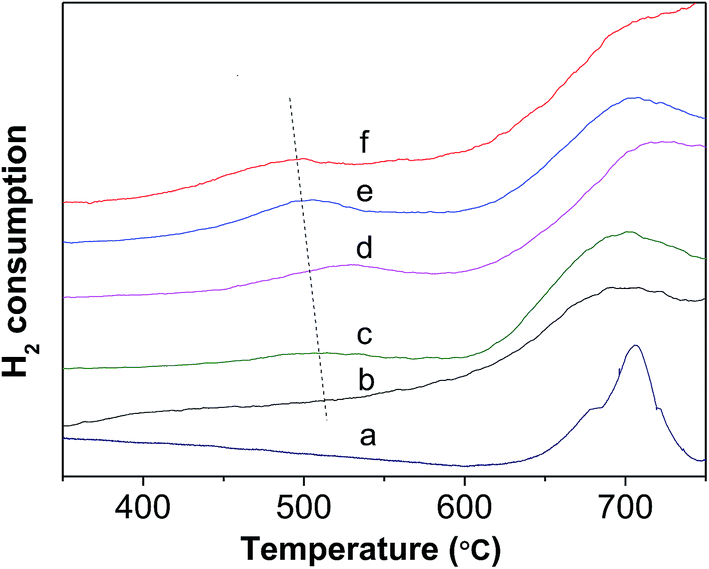 | ||
| Fig. 6 H2-TPR profile of (a) WZr30,600, (b) WZr30,650, (c) WZr30,700, (d) WZr30,750, (e) WZr30,800 and (f) WZr30,850. | ||
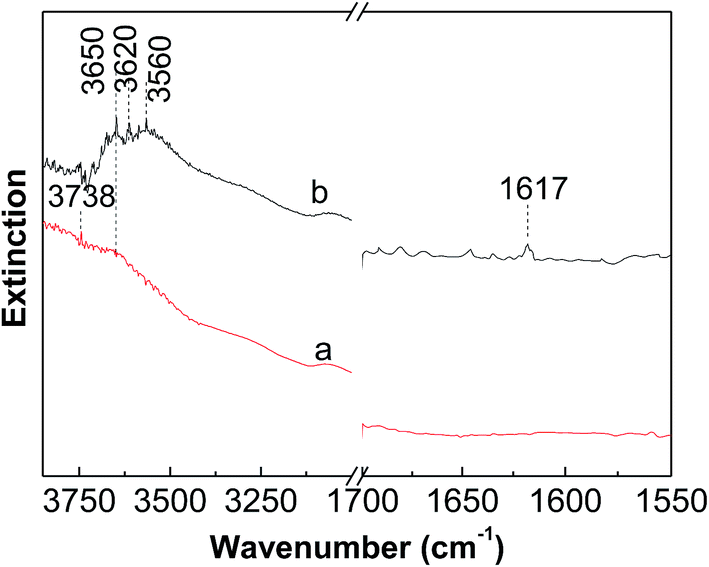
Fig. 7 shows the DRIFS spectra of dehydrated and reduced WZr30,800. The bending mode of water molecules at about 1617 cm−1 could not be differentiated in the spectrum of dehydrated sample, evidencing the total removal of adsorbed water. In the dehydrated state, the WO stretching vibration locates at 987 cm−1 (not shown here). The two weak bands around 3738 and 3620 cm−1 are characteristic of Zr–OH and W–OH groups respectively.45 After reduction with H2 at 400 °C, the broad band in the region from 3700 to 3500 cm−1 significantly increased in the intensity, revealing generation of large numbers of OH groups. In addition, the band at 1617 cm−1 became visible as a result of formation of H2O during the reduction process. The DRIFS results suggest that significant numbers of W6+O groups are reduced to W5+–OH species, as also confirmed by the EPR spectroscopy result that the signal at g⊥ = 1.84 assigned to the surface W5+ ions is generated after reduction of the tungstated zirconia with H2.36
 | ||
| Fig. 7 In situ DRIFS spectra measured at room temperature of (a) dehydrated and (b) reduced WZr30,800. | ||
Fig. 8 shows the XPS of fresh and spent WZr30,800 catalysts. The intense signals at 35.2 and 37.4 eV are attributed to the W4f spin–orbit component of surface W6+ species and the less intense ones at 33.9 and 36.2 eV are due to surface W5+ species.44 After reaction, the signals characteristic of W5+ species enhance in intensity, while those of W6+ species reduce. As a result, the ratio of W5+ to W6+ increased significantly. The increase of surface W5+ species arises from the reduction of WZr30,800 with pressured H2 in the reaction process. It is in accordance with the result of the DRIFS that W5+–OH species is formed.
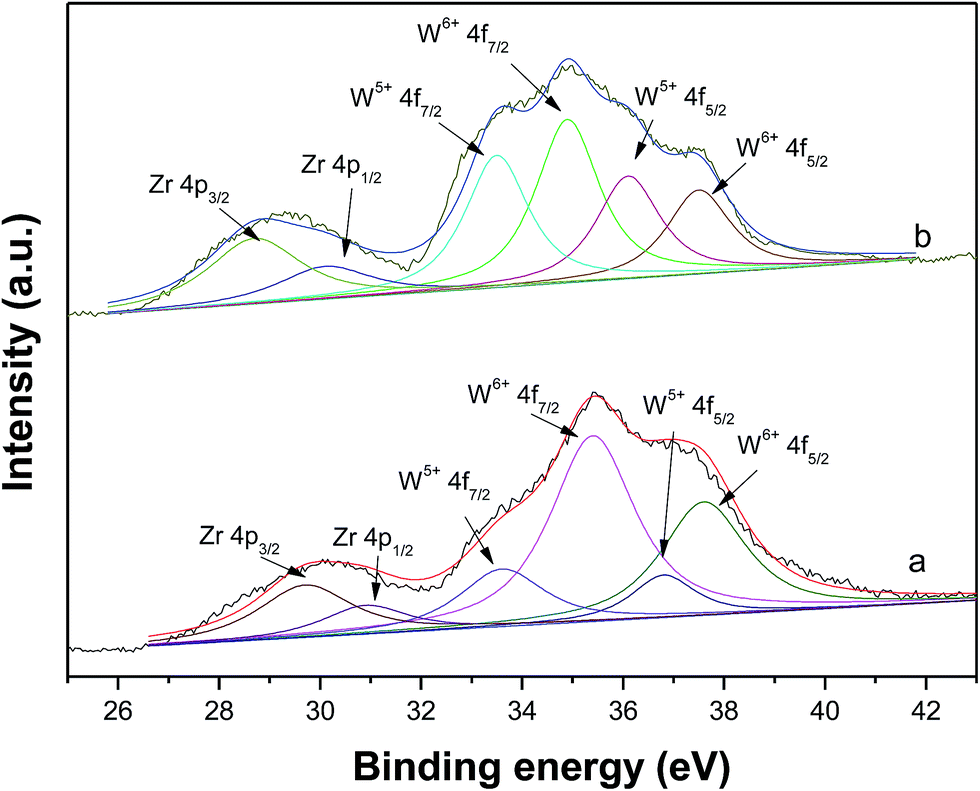 | ||
| Fig. 8 Experimental and simulated XPS of (a) fresh and (b) spent WZr30,800. | ||
3.2. Catalytic test
Table 1 summarizes the catalytic results for hydrogenolysis of cellulose obtained at 215 °C and 5.2 MPa over different WZr30,t combined with Ru/C. Clearly, the EG yield increased to 58.8% with increasing calcination temperature to 850 °C, showing that the large WO3 crystallites are beneficial to the transformation of cellulose to EG. However, when the calcination temperature was further ramped to 900 °C, the EG yield contrarily decreased. This is due to the transformation of some tetragonal ZrO2 into monoclinic phase. It has been shown that monoclinic ZrO2 has higher concentration and basicity of hydroxyl groups on this morphology. In addition, Zr4+ cations and O2− anions of monoclinic ZrO2 show stronger Lewis acidity and Lewis basicity than those of tetragonal ZrO2 respectively.46 The stronger basicity and Lewis acidity have been reported to promote the isomerization of glucose to fructose.47,48 Therefore, the EG yield declined.| Entry | Catalystb | Conv. (%) | Product yield (%) | ||||||
|---|---|---|---|---|---|---|---|---|---|
| EGc | 1,2-PGc | 1,2-BDc | 1,2-HDc | Glyc | Eryc | Hexc | |||
| a Reaction conditions: 0.3 g cellulose, 0.08 g WZr30,t, 0.01 g Ru/C, 40 mL H2O, 215 °C, 5.2 MPa, 1000 rpm, 1.5 h.b 0.024 g Tungsten species for the other W-containing compounds.c EG, 1,2-PG, 1,2-BD, 1,2-HD, Gly, Ery and Hex refer to ethylene glycol, 1,2-propylene glycol, 1,2-butanediol, 1,2-hexanediol, glycerol, erythritol and hexanehexol, respectively. | |||||||||
| 1 | WZr30,600 | 85 | 30.6 | 10.5 | 8.5 | 4.6 | 3.6 | 9.3 | 2.1 |
| 2 | W/Zr30,650 | 88 | 40.6 | 9.6 | 7.8 | 3.9 | 3.2 | 9 | 2.4 |
| 3 | W/Zr30,700 | 87 | 43.3 | 6.2 | 6 | 3.7 | 3 | 8.2 | 2.3 |
| 4 | W/Zr30,750 | 90 | 47.2 | 5.1 | 5.2 | 3.4 | 2.7 | 7.3 | 1.9 |
| 5 | W/Zr30,800 | 92 | 53.6 | 4.8 | 4.3 | 2.9 | 2.1 | 5.6 | 1.8 |
| 6 | W/Zr30,850 | 90 | 58.8 | 4.5 | 4.6 | 2.6 | 1.8 | 4.5 | 1.8 |
| 7 | W/Zr30,900 | 88 | 54.0 | 3.6 | 3.8 | 1.9 | 2 | 4.6 | 1.6 |
| 8 | WO3 | 86 | 47.5 | 3.2 | 3.5 | 2.5 | 1.6 | 5.6 | 1.9 |
| 9 | [NH4]6W7O24 | 82 | 25.3 | 2.4 | 3.1 | 2.7 | 1.2 | 6.8 | 2.4 |
| 10 | H3PW12O40 | 84 | 32.6 | 12.5 | 8.4 | 2.4 | 3.5 | 7.2 | 3 |
| 11 | H4SiW12O40 | 80 | 31.8 | 14.2 | 8.9 | 3.2 | 3.2 | 7.6 | 2.8 |
Fig. 1–6 show that increase of tungsten surface density results in the growth of monoclinic WO3 crystallite and facilitates their reduction to W5+ species owing to the lower AEE originating from weakening of their interaction with ZrO2 support. The degree for the reduction of WO3 to W5+ species was significantly promoted by Ru/C as it catalyzed the dissociation of H2 (Fig. S3†). DRIFS and XPS results verify the formation of OH groups and W5+ sites on the reduced WZr catalyst. Moreover, the Table 2 illustrates that the EG yield has a positive correlation with the surface W5+/W6+ ratio of the spent catalyst. Additionally, the formed W5+–OH groups can act as Brønsted acid sites for hydrolysis of cellulose to glucose and further to GA by selectively cleaving C2–C3 bond in glucose molecule. Thus, it can be deduced that W5+–OH species is the active catalytic site.
| Spent catalyst | Surface W5+/W6+ ratio (%) | EG yield (%) |
|---|---|---|
| WZr30,600 | 37.3 | 30.6 |
| WZr30,700 | 42.2 | 43.3 |
| WZr30,800 | 48.7 | 53.6 |
| WZr30,850 | 52.6 | 58.8 |
Compared to [NH4]6W7O24, H3PW12O40 and H4SiW12O40, WO3 has a lower AEE (Fig. 4), but gives a higher EG yield. This is agreement with that observed for the samples calcined at different temperature, suggesting that W species with low AEE exhibits high catalytic activity due to its high reduction degree.
The tungsten surface density can also be increased by increasing tungsten loading on ZrO2 support (Table S1 and Fig. S4†).35,49 Fig. 9 compares the catalytic results obtained over the WZrx,800 samples. The EG yield monotonously increases with the tungsten loading because of the increase in the crystallite size of WO3.
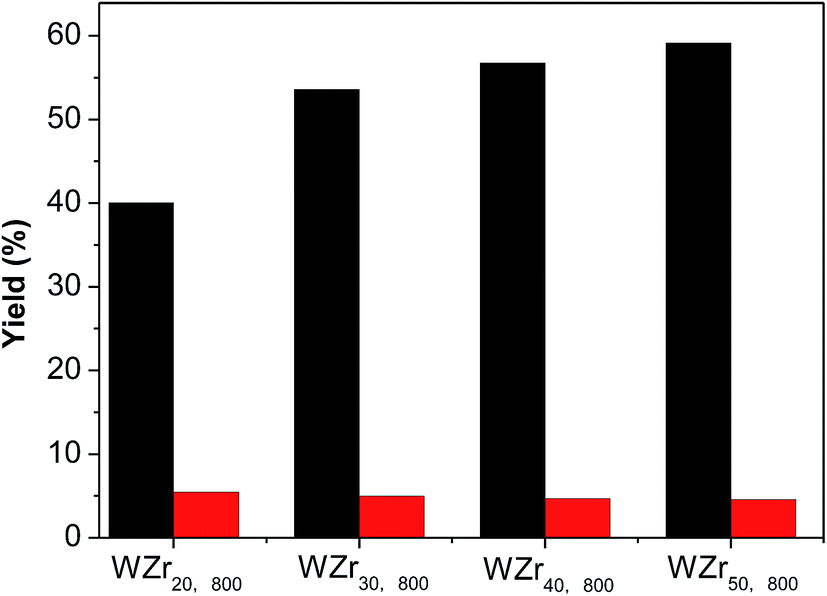 | ||
| Fig. 9 The EG (black) and PG (red) yields obtained over the samples loading different amounts of WO3 and being calcined at 800 °C (reaction conditions: 0.3 g cellulose, 0.01 g Ru/C, 0.08 g WZrx,800, 40 mL H2O, 215 °C, 5.2 MPa, 1000 rpm, 1.5 h). | ||
3.3. Catalytic mechanism of WZrx,t for hydrogenolysis of cellulose to EG
It is considered that the hydrogenolysis of cellulose to EG occurs by the following steps: (1) cellulose is hydrolyzed to glucose under the catalysis of reversibly generated H+ in hot water;50,51 (2) glucose is transformed into GA via complexation to W species; (3) GA is rapidly hydrogenated to EG on Ru/C. However, to date, no direct evidence for the second step was acquired, for they cannot be monitored by in situ characterization methods which are actually not available in the case of such kinds of gas/liquid/solid–solid reaction systems.51,52 Therefore, the catalytic mechanism for hydrogenolysis of cellulose to EG has not been clearly understood yet.The above results show that W5+–OH species is the active catalytic site for selectively cleaving the C2–C3 bond of glucose molecule. Thus, it can be deduced that the cleavage occurs through complexation of α- and β-OH groups to W5+–OH species. The detailed process is possibly as follows:
After hydrolysis of cellulose to glucose, the glucose molecule attacks the W5+–OH species (Fig. 10). Due to the electron-withdrawing effect of the carbonyl group, the H atom in the α-OH group is prone to be positively charged and attacks the exposed OH group of the W5+–OH species. Meanwhile, the O atom in the β-OH group coordinates to W atom by means of lone-pair electrons and forms a six-membered heterocyclic ring, which rapidly eliminates one H2O molecule and one H+ because of its instability. The circular flow of the electrons of the formed five-membered heterocycle breaks the C–C bond to form GA and erythrose through an oxidative-reductive process, which is the same as the catalytic mechanism for oxidation of diol by periodic acid.53,54 The erythrose molecule can be also decomposed into two GA molecules in a similar way.
 | ||
| Fig. 10 Proposed reaction mechanism for selectively breaking the glucose C–C bond. | ||
GA is an unstable intermediate at high temperature. It would be easily polymerized or degraded if it is not timely hydrogenated to EG.55 Indeed, it was found by us with GC-MS (Fig. S5†) and NMR spectrum (Fig. S6†) that 2,2′-oxydiacetaldehyde was a major byproduct at the reaction time of 0.5 h. This unsaturated compound is easily to be formed by polymerizing two GA molecules.56 However, when the reaction was carried out for 1 h, 2,2′-oxydiacetaldehyde disappeared. This may be because it reversibly hydrolyzed into GA and was quickly hydrogenated into EG. Addition of both H2 and Ru/C in the reaction mixture is necessary for obtaining EG. In the absence of H2 and/or Ru/C, 2,2′-oxydiacetaldehyde was only generated without the detection of EG.
4. Conclusions
A series of ZrO2-supported WO3 catalysts have been hydrothermally prepared by changing calcination temperature and tungsten loading for hydrogenolysis of cellulose to EG. The EG yield obtained over these samples increased with the tungsten surface density as a result of severe agglomeration of WO3 particles, which facilitates the reduction of WO3 to W5+–OH species due to the weakening of its interaction with support. The cleavage of C2–C3 bond in glucose occurs on the W5+–OH species to form GA through formation of a complex. This is followed by hydrogenation to EG over Ru/C.Acknowledgements
This work is financially supported by the National Natural Science Foundation of China (21403269), Shanxi Province of China (2016021033), Science Foundation for Youth Scholars of State Key Laboratory of Coal Conversion (2016BWZ002), and Youth Innovation Promotion Association CAS (2015140).References
- M. Benoit, A. Rodrigues, K. De Oliveira Vigier, E. Fourré, J. Barrault, J. M. Tatibouët and F. Jérôme, Green Chem., 2012, 14, 2212–2215 RSC.
- W. Deng, Q. Zhang and Y. Wang, J. Energy Chem., 2015, 24, 595–607 CrossRef.
- J. Xi, D. Ding, Y. Shao, X. Liu, G. Lu and Y. Wang, ACS Sustainable Chem. Eng., 2014, 2, 2355–2362 CrossRef CAS.
- Y. Yang, W. Zhang, F. Yang, D. E. Brown, Y. Ren, S. Lee, D. Zeng, Q. Gao and X. Zhang, Green Chem., 2016, 18, 3949–3955 RSC.
- J. Song, H. Fan, J. Ma and B. Han, Green Chem., 2013, 15, 2619–2635 RSC.
- C. Zhou, X. Xia, C. Lin, D. Tong and J. Beltramini, Chem. Soc. Rev., 2011, 40, 5588–5617 RSC.
- N. Meine, R. Rinaldi and F. Schuth, ChemSusChem, 2012, 5, 1449–1454 CrossRef CAS PubMed.
- S. Liu, M. Tamura, Y. Nakagawa and K. Tomishige, ACS Sustainable Chem. Eng., 2014, 2, 1819–1827 CrossRef CAS.
- R. Rinaldi and F. Schuth, ChemSusChem, 2009, 2, 1096–1107 CrossRef CAS PubMed.
- S. Van de Vyver, J. Geboers, P. A. Jacobs and B. F. Sels, ChemCatChem, 2011, 3, 82–94 CrossRef CAS.
- F. Yu, J. Thomas, M. Smet, W. Dehaen and B. F. Sels, Green Chem., 2016, 18, 1694–1705 RSC.
- J. Sun and H. Liu, Green Chem., 2011, 13, 135–142 RSC.
- R. Ooms, M. Dusselier, J. A. Geboers, B. Op de Beeck, R. Verhaeven, E. Gobechiya, J. A. Martens, A. Redl and B. F. Sels, Green Chem., 2014, 16, 695–707 RSC.
- R. Sun, T. Wang, W. Deng, J. Pang, A. Wang, X. Wang and T. Zhang, ACS Catal., 2015, 5, 874–883 CrossRef CAS.
- S. Wang, J. Chen and L. Chen, Catal. Lett., 2014, 44, 1728–1734 CrossRef.
- N. Ji, T. Zhang, M. Zheng, A. Wang, H. Wang, X. Wang and J. Chen, Angew. Chem., Int. Ed., 2008, 47, 8510–8513 CrossRef CAS PubMed.
- J. Pang, M. Zheng, A. Wang and T. Zhang, Ind. Eng. Chem. Res., 2011, 50, 6601–6608 CrossRef CAS.
- J. Pang, M. Zheng, R. Sun, L. Song, A. Wang, X. Wang and T. Zhang, Bioresour. Technol., 2015, 175, 424–429 CrossRef CAS PubMed.
- Z. Tai, J. Zhang, A. Wang, J. Pang, M. Zheng and T. Zhang, ChemSusChem, 2013, 6, 652–658 CrossRef CAS PubMed.
- A. Wang and T. Zhang, Acc. Chem. Res., 2013, 46, 1377–1386 CrossRef CAS PubMed.
- R. Sun, M. Zheng, J. Pang, X. Liu, J. Wang, X. Pan, A. Wang, X. Wang and T. Zhang, ACS Catal., 2016, 6, 191–201 CrossRef CAS.
- Y. Liu, C. Luo and H. Liu, Angew. Chem., Int. Ed., 2012, 51, 3249–3253 CrossRef CAS PubMed.
- K. M. Parida, P. K. Pattnayak and P. Mohapatra, J. Mol. Catal. A: Chem., 2006, 260, 35–42 CrossRef CAS.
- A. Martinez, G. Prieto, M. Arribas, P. Concepcion and J. Sanchezroyo, J. Catal., 2007, 248, 288–302 CrossRef CAS.
- J. S. da Cruz, M. A. Fraga, S. Braun and L. G. Appel, Appl. Surf. Sci., 2007, 253, 3160–3167 CrossRef.
- I. E. Wachs, T. Kim and E. I. Ross, Catal. Today, 2006, 116, 162–168 CrossRef CAS.
- W. Zhou, E. I. Ross-Medgaarden, W. V. Knowles, M. S. Wong, I. E. Wachs and C. J. Kiely, Nat. Chem., 2009, 1, 722–728 CrossRef CAS PubMed.
- X. Wang, L. Meng, F. Wu, Y. Jiang, L. Wang and X. Mu, Green Chem., 2012, 14, 758–765 RSC.
- S. L. Soled, C. D. Baertsch and E. Iglesia, J. Phys. Chem. B, 2001, 105, 1320–1330 Search PubMed.
- J. Song, Z. Huang, L. Pan, J. Zou, X. Zhang and L. Wang, ACS Catal., 2015, 5, 6594–6599 CrossRef CAS.
- S. R. Vaudagna, R. A. Comelli and N. S. FÍgoli, Appl. Catal., A, 1997, 164, 265–280 CrossRef CAS.
- M. A. Cortes-Jacome, J. A. Toledo and C. Angeles-Chavez, J. Phys. Chem. B, 2005, 109, 22730–22739 CrossRef CAS PubMed.
- C. Zhang, T. Liu, H. Wang, F. Wang and X. Pan, Chem. Eng. J., 2011, 174, 236–241 CrossRef CAS.
- S. S. Chan, I. E. Wachs, L. L. Murrell and N. C. Dispenziere, J. Catal., 1985, 92, 1–10 CrossRef CAS.
- D. G. Barton, M. Shtein, R. D. Wilson, S. L. Soled and E. Iglesia, J. Phys. Chem. B, 1999, 103, 630–640 CrossRef CAS.
- S. Kuba, M. Che, R. K. Grasselli and H. Knozinger, Phys. Chem. Chem. Phys., 2001, 3, 146–154 RSC.
- S. R. Vaudagna, S. A. Canavese, R. A. Comelli and N. S. Fõ Âgoli, Appl. Catal., A, 1998, 168, 93–111 CrossRef CAS.
- H. Zheng, J. Ou, M. S. Strano, R. B. Kaner, A. Mitchell and K. Kalantar-zadeh, Adv. Funct. Mater., 2011, 21, 2175–2196 CrossRef CAS.
- Z. Huang, J. Song, L. Pan, X. Zhang, L. Wang and J. Zou, Adv. Mater., 2015, 27, 5309–5327 CrossRef CAS PubMed.
- A. P. Alivisatos, Science, 1996, 271, 933–937 CAS.
- R. S. Weber, J. Catal., 1995, 151, 470–474 CrossRef CAS.
- M. R. Waller, T. K. Townsend, J. Zhao, E. M. Sabio, R. L. Chamousis, N. D. Browning and F. E. Osterloh, Chem. Mater., 2012, 24, 698–704 CrossRef CAS.
- D. G. Barton, S. L. Soled and E. Iglesia, Top. Catal., 1998, 6, 87–99 CrossRef CAS.
- F. Di Gregorio and V. Keller, J. Catal., 2004, 225, 45–55 CrossRef CAS.
- S. Kuba, M. Che, R. K. Grasselli and H. Knozinger, J. Phys. Chem. B, 2003, 107, 3459–3463 CrossRef CAS.
- K. Pokrovski, K. T. Jung and A. T. Bell, Langmuir, 2001, 17, 4297–4303 CrossRef CAS.
- J. Guo, S. Zhu, Y. Cen, Z. Qin, J. Wang and W. Fan, Appl. Catal., B, 2017, 200, 611–619 CrossRef CAS.
- C. Liu, S. Sun, K. Liu, S. Hao, J. Xu, Y. Zhu and Y. Li, ACS Catal., 2015, 5, 4612–4623 CrossRef CAS.
- E. Rossmedgaarden, W. Knowles, T. Kim, M. Wong, W. Zhou, C. Kiely and I. Wachs, J. Catal., 2008, 256, 108–125 CrossRef CAS.
- J. Xi, Y. Zhang, Q. Xia, X. Liu, J. Ren, G. g Lu and Y. Wang, Appl. Catal., A, 2013, 459, 52–58 CrossRef CAS.
- K. Fabičovicová, M. Lucas and P. Claus, Green Chem., 2015, 17, 3075 RSC.
- K. Fabičovicová, M. Lucas and P. Claus, Green Chem., 2014, 16, 3580 RSC.
- A. Liu, Ferriin oxidation of benzylic 1,2 -diols: A mechanistic approach, West Virginia University, 1999 Search PubMed.
- P. Spannring, V. Yazerski, P. C. Bruijnincx, B. M. Weckhuysen and R. J. Klein Gebbink, Chem.–Eur. J., 2013, 19, 15012–15018 CrossRef CAS PubMed.
- G. Zhao, M. Zheng, J. Zhang, A. Wang and T. Zhang, Ind. Eng. Chem. Res., 2013, 52, 9566–9572 CrossRef CAS.
- J. Zhang, B. Hou, A. Wang, Z. Li, H. Wang and T. Zhang, AIChE J., 2014, 60, 3804–3813 CrossRef CAS.
Footnote |
| † Electronic supplementary information (ESI) available. See DOI: 10.1039/c6ra27524a |
| This journal is © The Royal Society of Chemistry 2017 |