 Open Access Article
Creative Commons Attribution 3.0 Unported Licence
Synthesis and characterization of a poly(o-anisidine)–SiC composite and its application for corrosion protection of steel
Chuanbo Hu ab,
Ying Li*ab,
Ning Zhangab and
Yushi Dingab
aSchool of Metallurgy, Northeastern University, Shenyang 110819, China. E-mail: liying@mail.neu.edu.cn; Fax: +86 24 83687731; Tel: +86 24 83688995
bLiaoning Key Laboratory for Metallurgical Sensor and Technology, Northeastern University, Shenyang 110819, China
First published on 16th February 2017
Abstract
Conducting polymers have been widely used for corrosion protection of metals. Herein, a poly(o-anisidine) (POA)–SiC composite was synthesized by an in situ chemical oxidative polymerization method in a p-toluenesulfonic acid medium. The structure and morphology of the POA–SiC composite were characterized by Fourier transformation infrared spectroscopy (FT-IR), X-ray diffraction (XRD), X-ray photoelectron spectroscopy (XPS) and field emission scanning electron microscopy (FESEM). The thermal stability was studied by thermal gravimetric analysis (TGA) and the electrochemical behavior was studied by cyclic voltammetry (CV) measurements. Subsequently, the synthesized POA–SiC composite was introduced to epoxy resin through a solution blending method, and the three-component POA–SiC/epoxy hybrid materials were applied onto the surface of steel. The corrosion resistance of the POA–SiC/epoxy coating was evaluated by Tafel polarization and electrochemical impedance spectroscopy measurements in a 3.5 wt% NaCl solution and also compared with that of a POA/epoxy coating. The results demonstrated that the POA–SiC composite containing coating has a higher corrosion resistance than that of POA, with a lower corrosion rate and a higher corrosion protection efficiency. The excellent corrosion protection ability of the POA–SiC/epoxy coating is mainly attributed to the micro/nano structure of the POA–SiC composite which promoted a good compatibility with the epoxy resin and thus decreased the pinhole defects of the coating, and a conclusion was drawn that the protection is associated with the barrier effect of SiC nanoparticles, and the passivation and hydrophobic effects of POA. Furthermore, the protection mechanisms of the POA/epoxy coating and the POA–SiC/epoxy coating were also discussed.
1 Introduction
Corrosion has posed a serious industrial and economic threat since the use of metallic materials, therefore various efforts have been made to prevent metals from corroding. The four approaches that are normally applied to reduce the corrosion rate of metals include the development of alloy materials,1 the use of corrosion inhibitors,2 cathodic or anodic protection,3 and applied protective coatings.4 Among those approaches, using applied protective coatings is the most effective approach, and they can be used as barrier coatings to prevent the direct contact of metal substrates with corrosive media. In the past few decades, conducting polymers have been widely used for corrosion protection due to their unique conduction mechanisms.5 Polyaniline (PANI) is the most attractive conducting polymer as it was found to have a higher corrosion resistance than other polymers.6,7 Accordingly, in most cases, PANI has tended to replace some traditional heavy metal coatings or their oxide coatings.Although PANI shows good corrosion resistance, the poor solubility and processability of PANI powders, the pinhole defect and the unfavorable adhesion of PANI coatings to metal substrates have gravely restricted its applications. It has been found that ring-substituted or N-substituted modified PANI can be prepared. The literature8–10 indicates that the introduction of alkyl or alkoxy groups on the benzene ring or the amine and imine groups can significantly improve the physical properties and corrosion resistance of PANI, which may be due to the steric hindrance and π-electron effects of substituted PANI.11,12 Furthermore, the larger molecular size of substituted PANI facilitates a greater coverage surface and leads to a better adhesion to metal substrates.13 Substituted PANI has been found to provide higher corrosion protection for metals. Ma et al.14 prepared soluble phosphoric acid doped poly(2,3-dimethylaniline) (P(2,3-DMA)) by a chemical polymerization method. Corrosion analysis showed that the corrosion resistance of the uniform and strongly adherent P(2,3-DMA) coating was better than the corrosion resistance of PANI. Narayanasamy et al.15 electrodeposited homopolymer PANI and poly(N-methylaniline) (PNMA) coatings and copolymer and composite-bilayer coatings on mild steel using a cyclic voltammetric technique. Analysis of the corrosion resistance behavior found that composite-bilayer coatings showed higher stability and better protection than the copolymer and homopolymer coatings. For the individual homopolymer coatings, PNMA exhibited higher corrosion protection of mild steel than PANI. In addition, composite modification of PANI or its derivatives can also overcome the deficiency of the single polymer. The literature16,17 reports that a PANI–inorganic composite would improve the thermal stability, mechanical properties, corrosion resistance and adhesion to the substrate as well. Bhanvase et al.18 prepared a PANI–CaCO3 nanocomposite (PAC) using an emulsion polymerization technique. Thermal analysis showed that the PANI loaded CaCO3 nanoparticles can reduce the exothermicity of the polymer matrix. The analysis also indicated that the mechanical and corrosion resistances of PAC containing coatings were stronger than those of PANI, and the increased effects of the coatings were attributed to the dual effect of the CaCO3 nanoparticles. As can be seen, substitution or composite modification of PANI is an effective way to improve the processability and corrosion resistance.
In recent years, composites of conducting polymers and inorganic nanoparticles have attracted much attention due to their synergistic and complementary behaviors. Poly(o-anisidine) (POA) is a major derivative of PANI. Due to the methoxy group at the ortho position of the benzene ring attached to the amino group, POA has better solution processability as it is soluble in both acids and organic solvents.19 At present, syntheses of POA–inorganic composites by chemical or electrochemical methods have been reported. Their electrical conductivity, thermal stability, humidity sensing and corrosion resistance properties have also been widely studied.20–22 Nevertheless, the larger portion of this literature still focuses on studying the corrosion resistances of single POA–inorganic composites, and reports on the corrosion protection of POA–inorganic composites incorporated with epoxy resin on metals are limited. Silicon carbide (SiC) is a new class of inorganic material with good chemical stability, high strength and microhardness, a low friction coefficient, and good wear resistance and corrosion resistance in extreme environments. Kormányos et al.23 and Kassiba et al.24 reported that the addition of SiC nanoparticles can improve the thermal stability and electrical conductivity of PANI. Therefore, in this study, we synthesized a POA–SiC composite using an in situ chemical oxidative polymerization method and using p-toluenesulfonic acid as a dopant. Furthermore, we also used this composite in the preparation of POA–SiC/epoxy hybrid materials and then applied them on a steel surface. The structure, thermal stability and electrochemical activity of the POA–SiC composite were investigated and analyzed. The corrosion resistance of the POA–SiC/epoxy coating was investigated, in a 3.5 wt% NaCl solution as the corrosive medium, by Tafel polarization and electrochemical impedance spectroscopy, and the corrosion protection mechanism was also discussed in detail.
2 Experimental
2.1 Materials
The o-Anisidine (OA) monomer was obtained from Beijing J&K Technology Co., Ltd., and was distilled until it was colorless before use. p-Toluenesulfonic acid (C7H7SO3H, p-TSA), N-methyl-2-pyrrolidone (NMP) and dibutyl phthalate (DBP) were obtained from the Tianjin Guangfu Fine Chemical Research Institute. Ammonium persulfate (APS), butyl alcohol and sodium chloride (NaCl) were purchased from Tianjin Kemiou Chemical Reagent Co., Ltd. Ethanol, acetone and ethyl acetate were purchased from Sinopharm Chemical Reagent Co., Ltd. All chemical reagents were of analytical grade and were used as received. SiC powder with a particle size of 40 nm was supplied by Shanghai Chaowei Nano Technology Co., Ltd. Epoxy resin (E44, EP) and polyamide (651) were purchased from Nantong Xingchen Synthetic Material Co., Ltd.2.2 Synthesis of the POA–SiC composite
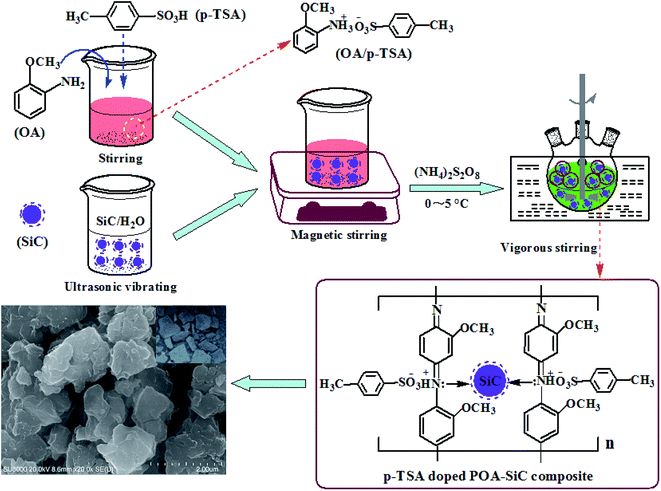
The POA–SiC composite was synthesized by in situ chemical oxidative polymerization of the OA monomer at 0–5 °C in air in the presence of SiC nanoparticles. A typical synthesis process is as follows: 0.30 g of SiC nanoparticles was dispersed in deionized water under ultrasonic vibration to reduce the agglomeration of SiC nanoparticles, and then the turbid liquid was added to a beaker containing an emulsion of 30 ml of 1.0 M p-TSA and 3.38 ml of OA monomer under magnetic stirring for 30 min to accelerate the dispersion of SiC nanoparticles. Following this, the emulsion mixture was added to a three-necked flask and vigorous stirring was continued. After 30 min, 100 ml of 0.3 M APS solution was added dropwise to the emulsion mixture over 2.5 h with constant stirring at 0–5 °C, followed by continued stirring for 10 h in an ice bath to ensure complete polymerization. The resulting composite was filtered and washed with ethanol and deionized water. Finally, the precipitated filter cake was dried in an air oven at 60 °C for 24 h and then finely ground by an agate mortar before use as a pigment. Pure POA was also synthesized by the same method without the use of SiC nanoparticles. Fig. 1 shows the schematic synthesis of the POA–SiC composite.2.3 Characterization
The FT-IR spectra of the powders were recorded using a Nicolet 380 spectrometer in the range of 4000–500 cm−1 using the KBr pellet method. The XRD patterns of the powders were obtained using an Ultima IV X-ray diffractometer in the range of 10–90°. The chemical compositions of the powders were measured using an Escalab 250Xi X-ray photoelectron spectroscope. The morphological structures of the powders were obtained using an SU8010 field emission scanning electron microscope. TGA analysis of the powders was carried out using an SDT-Q600 thermal analyzer in the range of 25–800 °C at a heating rate of 10 °C min−1. Cyclic voltammetry (CV) measurements of POA and the POA–SiC composite were carried out in a 1.0 M HCl solution using a Princeton 2273 electrochemical workstation. The working electrode was prepared as follows; a certain amount of powder was dissolved in NMP solvent, then a piece of carbon paper was immersed in the solution and vibrated for 30 min by ultrasound, and finally the carbon paper loaded with the POA or POA–SiC film was obtained after drying. A conventional three-electrode system was utilized with a platinum plate as the counter electrode, the carbon paper loaded with POA or the POA–SiC composite as the working electrode, and a saturated calomel electrode (SCE) as the reference electrode. CV curves were measured over a range of −0.2 to 0.6 V vs. SCE with a potential sweep rate of 20 mV s−1.2.4 Preparation of the coatings
Steel samples were cut into 2 cm × 2 cm dimensions and their surfaces were polished using 100, 320, 600, 1000 and 1200 grade emery papers on an MP-1B polishing machine, followed by degreasing with acetone and ethanol solvents, and then air-drying at room temperature prior to use. For preparation of the coatings, the pigment powders (POA and the POA–SiC composite) were dispersed in epoxy resin and a polyamide blending system using a ball-grinding mill, and a mixture of butyl alcohol and NMP was used as the solvent, DBP as the plasticizer and ethyl acetate as the defoaming agent. The mass ratio of the polyamide/epoxy resin was 0.3 and the pigment powder content was 5 wt%. The above hybrid materials were cured at room temperature for 24 h, and then applied on the treated steel samples, followed by curing the coated samples at 60 °C for 24 h. Two kinds of coating films were thus formed, including a POA/EP coating and a POA–SiC/EP coating. A pure epoxy resin coating (pure EP coating) was also applied on the steel sample to compare the corrosion resistance.2.5 Electrochemical corrosion studies
Electrochemical corrosion test techniques were carried out in a 3.5 wt% NaCl solution using a Princeton 2273 electrochemical workstation. A conventional three-electrode system was utilized with a platinum plate as the counter electrode, the uncoated and coated steel samples with an exposed area of 1 cm2 as the working electrode, and a saturated calomel electrode (SCE) as the reference electrode. Tafel polarization curves were measured over a range of −1.2 to −0.2 V vs. SCE with a potential sweep rate of 1 mV s−1, and the corrosion data were obtained through superimposing a straight line along the linear portion of the cathodic and anodic curves. Electrochemical impedance spectroscopy (EIS) measurements were performed at a frequency range from 100 kHz to 10 mHz with an AC amplitude of 10 mV, and the impedance data were analyzed using Zview2.0 software.3 Results and discussion
3.1 Structure and morphology
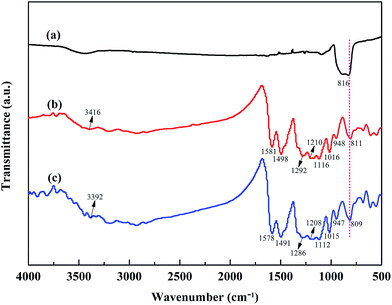
Fig. 2 shows the FT-IR spectra of SiC nanoparticles, POA and the POA–SiC composite. As shown in Fig. 2(a), the strong characteristic absorption peak at 816 cm−1 can be attributed to the Si–C stretching of SiC nanoparticles.25 From Fig. 2(b), it can be seen that the main characteristic absorption peaks of POA occur at 3416, 1580, 1498, 1292, 1116 and 811 cm−1, which can be assigned to the N–H stretching of the benzenoid rings, C![[double bond, length as m-dash]](https://www.rsc.org/images/entities/char_e001.gif) C stretching of the quinoid rings, C
C stretching of the quinoid rings, C![[double bond, length as m-dash]](https://www.rsc.org/images/entities/char_e001.gif) C stretching of the benzenoid rings, C–N stretching of the secondary aromatic amine, C–H in plane bending of the quinoid rings and C–H out of plane bending of the benzenoid rings, respectively.26,27 Furthermore, the peak at 1210 cm−1 represents the degree of delocalization of electrons on POA. The peak at 1016 cm−1 is assigned to the C–O stretching of the methoxy group, which shows that there are methoxy substituents in the polymer backbone. The peak at 948 cm−1 is attributed to the S–O stretching of the p-TSA group, and this result confirms that p-TSA has been successfully doped in the POA chains. As shown in Fig. 2(c), it can be found that the characteristic peaks of the POA–SiC composite center at 3392, 1578, 1491, 1286, 1208, 1112, 1015, 947 and 809 cm−1, and these peaks are found to shift to lower wavenumbers in comparison with those of POA, indicating the existence of a strong interaction between POA and SiC nanoparticles. The characteristic peak of the SiC nanoparticles either weakened in the composite or overlapped with the characteristic peaks of POA; these results suggest that SiC nanoparticles are effectively covered by POA.
C stretching of the benzenoid rings, C–N stretching of the secondary aromatic amine, C–H in plane bending of the quinoid rings and C–H out of plane bending of the benzenoid rings, respectively.26,27 Furthermore, the peak at 1210 cm−1 represents the degree of delocalization of electrons on POA. The peak at 1016 cm−1 is assigned to the C–O stretching of the methoxy group, which shows that there are methoxy substituents in the polymer backbone. The peak at 948 cm−1 is attributed to the S–O stretching of the p-TSA group, and this result confirms that p-TSA has been successfully doped in the POA chains. As shown in Fig. 2(c), it can be found that the characteristic peaks of the POA–SiC composite center at 3392, 1578, 1491, 1286, 1208, 1112, 1015, 947 and 809 cm−1, and these peaks are found to shift to lower wavenumbers in comparison with those of POA, indicating the existence of a strong interaction between POA and SiC nanoparticles. The characteristic peak of the SiC nanoparticles either weakened in the composite or overlapped with the characteristic peaks of POA; these results suggest that SiC nanoparticles are effectively covered by POA.
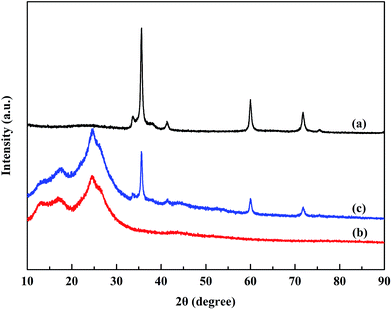
Fig. 3 shows the XRD patterns of the SiC nanoparticles, POA and POA–SiC composite. It can be seen that the characteristic diffraction peaks of the SiC nanoparticles appear at 35°, 41°, 60° and 71°, representing the crystalline nature of SiC, which is consistent with the standard JCPDS card (JCPDS no. 29-1129). As presented in Fig. 3(b), the diffraction peaks of POA appear between 17° and 25°, and are attributed to the amorphous nature of POA. At a 2θ of around 25°, the intensive peak arising from the amorphous polymer decreases and the peak corresponding to the protonated polymer appears; this indicates that doping POA with p-TSA evidently increases the crystalline nature, and this may derive from the protonation of the intercalated p-TSA between the POA chains.28 For the POA–SiC composite, it can be observed that the XRD pattern exhibits the diffraction characteristics of both POA and SiC, which confirms that adsorbing POA on the surfaces of the SiC nanoparticles has no effect on the crystalline properties of the SiC nanoparticles. However, the diffraction intensities of the composite are weaker than those of pure SiC nanoparticles. The probable reason for this decrease is that the adsorption of POA on the surfaces of the nanoparticles reduces the mass-volume percentage of SiC, and sequentially weakens the diffraction peaks.
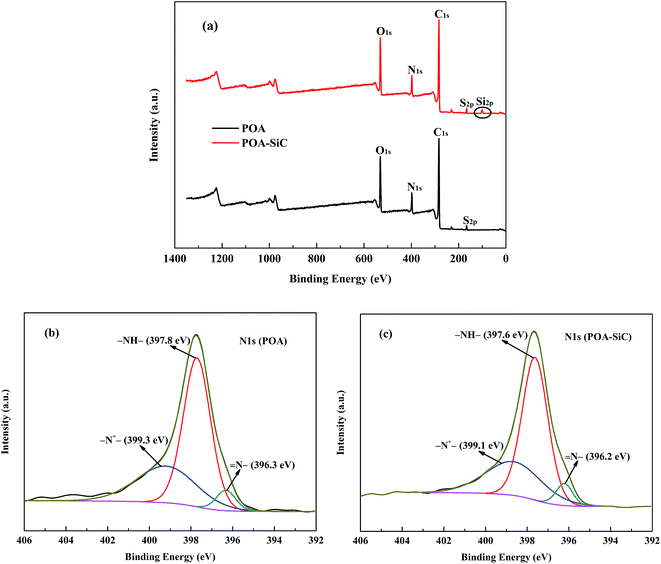
XPS was used to study the chemical compositions of the powders and the chemical states of the elements. Fig. 4(a) shows the XPS survey spectra of POA and the POA–SiC composite. The survey spectra of POA display clearly visible C 1s, N 1s, O 1s and S 2p peaks, and the binding energies are located at 283.02, 397.76, 531.45 and 166.1 eV, respectively. The S 2p peak demonstrates that the p-TSA dopant has doped into the POA chains. In the case of the POA–SiC composite, the C 1s, N 1s, O 1s and S 2p peaks of POA can be observed in the same positions. In addition, a peak located at 100.25 eV, corresponding to the Si 2p binding energy of SiC, is also observed in the composite, which confirms that POA has covered the SiC surfaces. Fig. 4(b and c) show the N 1s XPS spectra of POA and the POA–SiC composite. The N 1s XPS spectrum of POA can be well fitted into three peaks. The peaks located at about 396.3, 397.8 and 399.3 eV are attributed to imine (![[double bond, length as m-dash]](https://www.rsc.org/images/entities/char_e001.gif) N–), amine (–NH–) and protonated imine (–N+–),29 respectively. Generally, POA could achieve its highly conductive state through protonation of the imine and oxidation of the amine in its fully reduced state.30 This result indicates that POA is in its conductive state. As shown in Fig. 4(c), the changes in the binding energies of the fitted chemical states of nitrogen atoms are very small. This shows that the addition of SiC nanoparticles did not affect the bonding modes of POA, and there was no obvious chemical reaction between POA and SiC. This phenomenon confirms that POA is adsorbed and grows on the surfaces of the nanoparticles.
N–), amine (–NH–) and protonated imine (–N+–),29 respectively. Generally, POA could achieve its highly conductive state through protonation of the imine and oxidation of the amine in its fully reduced state.30 This result indicates that POA is in its conductive state. As shown in Fig. 4(c), the changes in the binding energies of the fitted chemical states of nitrogen atoms are very small. This shows that the addition of SiC nanoparticles did not affect the bonding modes of POA, and there was no obvious chemical reaction between POA and SiC. This phenomenon confirms that POA is adsorbed and grows on the surfaces of the nanoparticles.
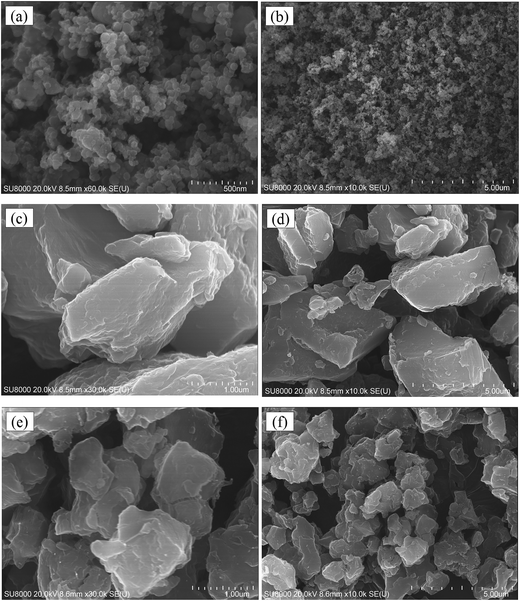
Fig. 5 shows the FESEM images of SiC nanoparticles, POA and the POA–SiC composite. It can be seen from Fig. 5(a and b) that the SiC nanoparticles have smaller granular sizes and are uniformly distributed together. The FESEM images of Fig. 5(c and d) show that POA is similar to a lump structure, which reveals the irregular clustered morphology of the polymer. From Fig. 5(e and f) it is seen that the lump structure of POA is evidently reduced due to the nucleation of SiC nanoparticles, and the nanoparticles are covered by POA to form a more compact composite with a micro/nano structure. Such a structure helps to reduce the agglomeration and improve the dispersity of the composite in the epoxy resin and polyamide blending system.18 In addition, the size distribution of POA is 13.02–14.29 μm and that of the POA–SiC composite is 5.60–6.05 μm, which also demonstrates that the doping of nanoparticles can improve the compact structure and reduce the size of POA.
3.2 Thermal stability
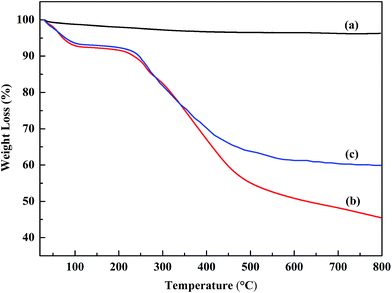
The thermal stabilities of the powders were investigated using thermo-gravimetric analysis. Fig. 6 shows the TGA curves of the SiC nanoparticles, POA and the POA–SiC composite. From Fig. 6(a), it can be seen that the SiC nanoparticles are very stable in air and exhibit almost no weight loss from 25 °C to 800 °C. The thermal behaviors of POA and the POA–SiC composite are similar to that of PANI, and exhibit two major stages in the weight loss process.31 For POA, the first stage of weight loss occurs over the temperature range from 25 °C to 126 °C, which is mainly attributed to the expulsion of impurities and residual water in the POA matrix. The second stage of weight loss occurs continuously from 162 °C to 800 °C, which is due to the loss of the p-TSA dopant and the degradation of the POA chains. As shown in Fig. 6(c), it is found that the degradation trend of the POA–SiC composite is similar to that of POA, the only difference being that the degradation rate of the POA–SiC composite is lower than that of POA. When the temperature rises to 800 °C, the weight loss percentage of POA is 54.5% while that of the POA–SiC composite is 39.9%. The difference in the percentage of residues between POA and the POA–SiC composite is considered to be due to the content of SiC nanoparticles.32 Therefore, it can be estimated that the weight ratio of POA to SiC nanoparticles is about 3![[thin space (1/6-em)]](https://www.rsc.org/images/entities/char_2009.gif) :
:![[thin space (1/6-em)]](https://www.rsc.org/images/entities/char_2009.gif) 1. Furthermore, according to the literature,33 the reported weight loss percentage of the POA–PANI composite is more than 80% at 800 °C, therefore a conclusion can be drawn that inorganic nanoparticle composite modified POA has a higher thermal behavior than that of the organic polymer. The drop in degradation rate may be explained by the fact that inorganic nanoparticles restrict the thermal motion of POA in the composite.34 All results confirm that the incorporation of SiC nanoparticles can evidently improve the thermal stability of POA.
1. Furthermore, according to the literature,33 the reported weight loss percentage of the POA–PANI composite is more than 80% at 800 °C, therefore a conclusion can be drawn that inorganic nanoparticle composite modified POA has a higher thermal behavior than that of the organic polymer. The drop in degradation rate may be explained by the fact that inorganic nanoparticles restrict the thermal motion of POA in the composite.34 All results confirm that the incorporation of SiC nanoparticles can evidently improve the thermal stability of POA.
3.3 Electrochemical activity
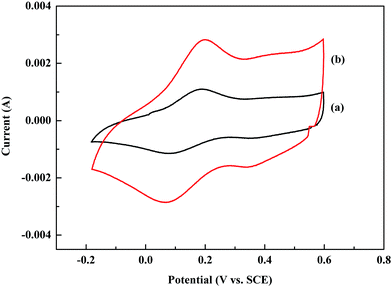
Cyclic voltammetry (CV) has been widely used to evaluate the electrochemical behavior of conducting polymers. The potential difference between the oxidation and reduction peaks has been used to evaluate the reversibility of the electrochemical redox reaction.35 The closer the potential difference is to zero, the higher the electrochemical reversibility it could achieve. Fig. 7 shows the CV curves of the POA film and POA–SiC film immersed in a 1.0 M HCl solution. As shown in Fig. 7(a), the CV curve of POA displays a couple of oxidation/reduction peaks. The potentials of the oxidation and reduction peaks are about 0.20 V and 0.07 V, therefore the potential difference is 0.13 V, which implies that the electrochemical behavior of POA is reversible. From Fig. 7(b), it can be seen that the CV curve of the POA–SiC composite is similar to that of POA, and the potentials of the oxidation and reduction peaks show almost no changes. This indicates that the introduction of SiC nanoparticles has no change on the electrochemical reversibility of POA. In addition, the POA–SiC composite shows a higher redox current than that of POA, which implies that the presence of SiC nanoparticles in the POA matrix is beneficial for promoting the redox reaction of POA chains and the POA–SiC composite with a higher electrochemical activity than that of POA.3.4 Corrosion protection evaluation
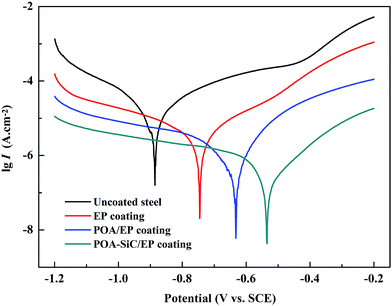
The Tafel polarization curve is the most efficient method to evaluate the corrosion protection abilities of coatings for steel. Generally, in a typical Tafel polarization curve, the excellent corrosion resistance of the coating exhibits a lower corrosion rate (CR), which corresponds to a higher corrosion potential (Ecorr) or a lower corrosion current density (Icorr).6,36 Fig. 8 shows the Tafel plots of uncoated and coated steel samples immersed in 3.5 wt% NaCl solution for a few days; the Tafel regions can be easily identified from the anodic and cathodic curves, and the corrosion data calculated by the Tafel extrapolation method are listed in Table 1. The CR values of the uncoated and coated steel samples were calculated by the following equation:37
 | (1) |
 | (2) |
| Samples | Ecorr (mV) | Icorr (A cm−2) | CR (mm a−1) | ba (V dec−1) | bc (V dec−1) | PE (%) |
|---|---|---|---|---|---|---|
| Uncoated steel | −880 | 1.29 × 10⁻⁵ | 0.15 | 0.17 | 0.16 | — |
| Pure EP coating | −745 | 2.08 × 10⁻⁶ | 2.43 × 10⁻² | 0.14 | 0.15 | 83.87 |
| POA/EP coating | −636 | 4.21 × 10⁻⁷ | 4.93 × 10⁻³ | 0.13 | 0.14 | 96.73 |
| POA–SiC/EP coating | −532 | 1.54 × 10⁻⁷ | 1.80 × 10⁻³ | 0.11 | 0.12 | 98.80 |
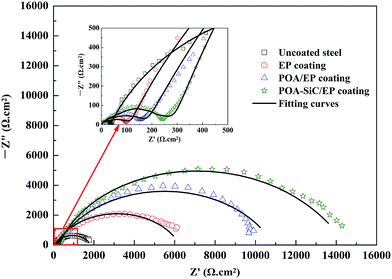
The corrosion behaviors of uncoated and coated steel were also investigated by EIS in 3.5 wt% NaCl solution. Fig. 9 shows the Nyquist plots of uncoated and coated steel immersed in 3.5 wt% NaCl solution for a few days. The EIS data were fitted using the equivalent circuit shown in Fig. 10, where Rs is the electrolyte solution resistance, Cc is the constant phase element (CPE) representing the coating capacitance, Rp is the pore resistance, Cdl is the constant phase element representing the double layer capacitance and Rct is the charge transfer resistance. As we know, the CPE element is a non-ideal capacitance that is generally used to imitate the EIS data, and the CPE value can be calculated using the following equation:40
| ZCPE(ω) = Y−10(jω)−n | (3) |
| Cc (or) Cdl = Y0(ωm)n−1 | (4) |
| ωm = [(Y0R)−1]1/n | (5) |
From Fig. 9, it can be seen that all steel samples exhibited a depressed semicircle loop, and the equivalent circuit provided a good fitting result. The Nyquist plot for uncoated steel shows two semicircle loops, the small semicircle loop in the high frequency regions is attributed to the formation of a corrosion film at the beginning, and the large semicircle loop in the low frequency regions is attributed to the corrosion processes occurring underneath the corrosion film.46 The Nyquist plot of uncoated steel is characteristic of a system undergoing dissolution with the precipitation of a corrosion film at the steel surface. For all of the coated steel samples, the Nyquist plots display the same semicircle characteristics as those of uncoated steel. The first semicircle loop represents the coating/electrolyte interface and is denoted by Rp and Cc, and the second semicircle represents the coating/steel interface and is denoted by Rct and Cdl. The fitting impedance parameters of the equivalent circuit are shown in Table 2. The data shows that the Rp value of the POA–SiC/EP coating is 215.60 Ω cm2, which is 1.5-fold higher than that of the POA/EP coating and 2.5-fold higher than that of the pure EP coating. This result indicates that the porosity of the POA–SiC/EP coating is clearly lower than that of the POA/EP coating and the pure EP coating. The Rct value of the POA–SiC/EP coating is 14416 Ω cm2, which is 1.3-fold higher than that of the POA/EP coating and 2.3-fold higher than that of the pure EP coating. The higher Rct value is attributed to the effective barrier effect of the POA–SiC/EP coating.47 Furthermore, the lower Cc and Cdl values of coated steel further support the hypothesis of the protection of steel by the POA–SiC/EP coating. Thus, all results indicate that the POA–SiC/EP coating has provided excellent corrosion protection of steel. Based on the fitted Rct value, the protection efficiency (PE) of coated steel was calculated by the expression:39,48
 | (6) |
| Samples | Rs (Ω cm2) | Y0 (Ω−1 sn) | n | Cc (F cm−2) | Rp (Ω cm2) | Y′0 (Ω−1 sn) | n′ | Cdl (F cm−2) | Rct (Ω cm2) | PE (%) |
|---|---|---|---|---|---|---|---|---|---|---|
| Uncoated steel | 2.34 | 2.54 × 10⁻⁶ | 0.93 | 1.32 × 10⁻⁶ | 35.42 | 6.05 × 10⁻⁴ | 0.78 | 6.19 × 10⁻⁴ | 1796 | — |
| Pure EP coating | 12.79 | 2.21 × 10⁻⁷ | 0.90 | 6.70 × 10⁻⁸ | 87.86 | 1.61 × 10⁻⁴ | 0.75 | 1.62 × 10⁻⁴ | 6342 | 71.68 |
| POA/EP coating | 13.43 | 2.61 × 10⁻⁷ | 0.85 | 4.19 × 10⁻⁸ | 148.20 | 1.03 × 10⁻⁴ | 0.73 | 1.08 × 10⁻⁴ | 11135 | 83.87 |
| POA–SiC/EP coating | 31.47 | 8.07 × 10⁻⁸ | 0.91 | 2.69 × 10⁻⁸ | 215.60 | 7.35 × 10⁻⁵ | 0.77 | 7.48 × 10⁻⁵ | 14416 | 87.54 |
Both the Tafel slope and EIS results show that the addition of pigments can improve the corrosion resistance of the pure EP coating significantly, and that the POA–SiC composite containing coating is more protective. The better corrosion protection ability of the POA–SiC composite containing coating is derived from the synergistic effects of the SiC nanoparticles, POA and epoxy resin. The POA–SiC composite as a pigment can be uniformly dispersed in epoxy resin due to its relatively low size distribution. Once the coated steel is attacked by a corrosive medium, POA can passively catalyze the steel surface and facilitate the maintaining of a dense passive film on the steel surface. Additionally, POA chains contain the hydrophobic methoxy group which could create the free surface of the coatings and result in a decrease in the permeability of water molecules.49 Therefore, it is reasonable to propose that the POA–SiC/EP coating exhibits higher corrosion resistance due to its excellent passivation, barrier and hydrophobic effects.
Generally, the corrosion of metals in neutral chloride solution is mainly an electrochemical corrosion process. The corrosion reaction of steel in 3.5 wt% solution can be described as follows:17,50
| Anodic reaction: 2Fe → 2Fe2+ + 4e, 2Fe2+ → 2Fe3+ + 2e | (7) |
| Cathodic reaction: O2 + 2H2O + 4e → 4OH− | (8) |
| Total reaction: 2Fe3+ + 6OH− → Fe2O3 + 3H2O | (9) |
It can be seen that it is necessary to have sufficient H2O and O2 for the production of the cathodic reaction. If the cathodic reaction process can be prevented, corrosion will be inhibited and the protection becomes effective. As has been widely reported, PANI and substituted PANI containing coatings protect the underlying metal from corrosion through the physical barrier and electrochemical passivation effects.51,52 In the case of the POA/EP coating, the corrosion protection mechanism is derived from the physical barrier, electrochemical passivation and hydrophobic effects. Under the attack of a corrosive medium, POA is expected to intercept the released ions during the corrosion reaction, become doped and release the dopant ions, therefore undergoing a self-healing process, forming a passive layer of Fe2O3 and insoluble Fe(C7H7SO3)3 compounds in the coating/metal interface. In other words, POA intercepts the electrons at the coating/metal interface and transports them to the coating/electrolyte interface, thus avoiding bubbling and protection failure due to a cathodic reaction occurring at the steel surface, which causes the adhesion strength of the coating to decrease. The proposed corrosion schematic diagram is shown in Fig. 11(a). The corrosion protection mechanism of the POA–SiC/EP coating is similar to that of the POA/EP coating, the difference being that the physical barrier effect of the POA–SiC/EP coating has been improved. The barrier effect was improved no doubt due to the excellent dispersity of the POA–SiC composite. The small and uniform dispersion of the composite with a micro/nano structure would increase the compatibility of the pigment with epoxy resin and reduce the pinhole defects of the coating; the SiC nanoparticles act as a barrier in the coating, thus reducing the passing routes used by the corrosive medium. Moreover, the SiC nanoparticles released by the redox reaction of POA may form Fex(SiC)y complex compounds with iron ions, which could increase the passivation effects of the POA–SiC/EP coating.53 The corrosion schematic diagram is shown in Fig. 11(b). Therefore, it is expected that the epoxy coating containing the POA–SiC composite demonstrates effective corrosion protection of the steel because of its excellent barrier, passivation and hydrophobic effects. It was clear that the use of the POA–SiC composite as a pigment of the epoxy coating is the best solution as it provides ternary protection effects that limit the permeation of corrosive media.
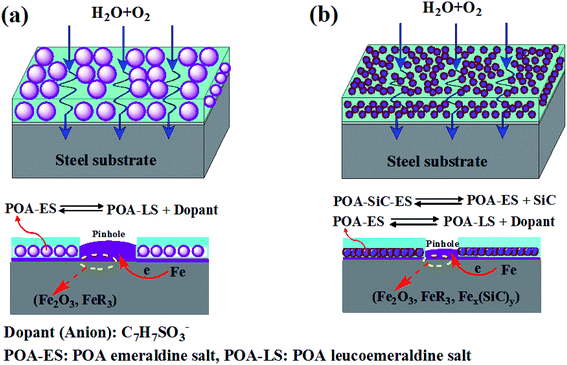 | ||
| Fig. 11 The corrosion schematic diagram of (a) POA/EP coating and (b) POA–SiC/EP coating immersed in 3.5 wt% NaCl solution. | ||
4 Conclusions
In summary, a POA–SiC composite was synthesized through an in situ chemical oxidative polymerization method using p-TSA as the dopant. The structure, morphology and thermal stability of the composite were studied using FT-IR, XRD, XPS, FESEM and TGA techniques. The structure studies revealed that certain interactions exist in between POA and the SiC nanoparticles, and POA is adsorbed and grows on the surfaces of the nanoparticles. The morphology study confirmed that the formation of a POA–SiC composite with a micro/nano structure and the doping of nanoparticles can improve the compactness and reduce the size distribution of POA. The thermal stability study indicated that SiC nanoparticles significantly restrict the thermal motion of POA in the composite. The electrochemical behavior study revealed that POA is reversible and that the POA–SiC composite exhibits higher electrochemical activity than that of POA. The corrosion studies of all the coated steel samples immersed in 3.5 wt% NaCl solution by Tafel slope and EIS measurements showed that the POA–SiC composite containing coating exhibits a higher corrosion resistance than that of POA. The higher corrosion protection of the POA–SiC/EP coating has been associated with the micro/nano structure of the POA–SiC composite which promoted good compatibility with the epoxy resin, and the mechanism of corrosion protection was mainly derived from the increase in the barrier of SiC nanoparticles, passivation and hydrophobic properties of POA.Acknowledgements
The authors are grateful for the financial support from the National Natural Science Foundation of China (No. 51274057, 51474057) and Initial Scientific Research Fund of Young Teachers (No. N140203003). The authors are also thankful to the School of Metallurgy of Northeastern University for providing the facilities for this research.References
- P. A. Sørensen, S. Kiil, K. Dam-Johansen and C. E. Weinell, J. Coat. Technol. Res., 2009, 6, 135–176 CrossRef.
- P. B. Raja and M. G. Sethuraman, Mater. Lett., 2008, 62, 113–116 CrossRef CAS.
- H. G. Wei, D. W. Ding, S. Y. Wei and Z. H. Guo, J. Mater. Chem. A, 2013, 1, 10805–10813 CAS.
- D. Snihirova, S. V. Lamaka and M. F. Montemor, Electrochim. Acta, 2012, 83, 439–447 CrossRef CAS.
- Y. N. Meng, K. Wang, Y. J. Zhang and Z. X. Wei, Adv. Mater., 2013, 25, 6985–6990 CrossRef CAS PubMed.
- C. H. Chang, T. C. Huang, C. W. Peng, T. C. Yeh, H. I. Lu, W. I. Hung, C. J. Weng, T. I. Yang and J. M. Yeh, Carbon, 2012, 50, 5044–5051 CrossRef CAS.
- E. Armelin, Á. Meneguzzi, C. A. Ferreira and C. Alemán, Surf. Coat. Technol., 2009, 203, 3763–3769 CrossRef CAS.
- M. Jaymand, Prog. Polym. Sci., 2013, 38, 1287–1306 CrossRef CAS.
- B. Duran, M. C. Turhan, G. Bereket and A. S. Saraç, Electrochim. Acta, 2009, 55, 104–112 CrossRef CAS.
- B. Duran, G. Bereket, M. C. Turhan and S. Virtanen, Thin Solid Films, 2011, 519, 5868–5874 CrossRef CAS.
- S. Sathiyanarayanan, S. K. Dhawan, D. C. Trivedi and K. Balakrishnan, Corros. Sci., 1992, 33, 1831–1841 CrossRef CAS.
- S. Sathiyanarayanan, K. Balakrishnan, S. K. Dhawan and D. C. Trivedi, Electrochim. Acta, 1994, 39, 831–837 CrossRef CAS.
- A. Benchikh, R. Aitout, L. Makhloufi and B. Saidani, Desalination, 2009, 249, 466–474 CrossRef CAS.
- L. Ma, C. Q. Huang and M. Y. Gan, J. Appl. Polym. Sci., 2013, 127, 3699–3704 CrossRef CAS.
- B. Narayanasamy and S. Rajendran, Prog. Org. Coat., 2010, 67, 246–254 CrossRef CAS.
- Q. Zhang, Y. Li, Y. Feng and W. Feng, Electrochim. Acta, 2013, 90, 95–100 CrossRef CAS.
- A. Mostafaei and F. Nasirpouri, Prog. Org. Coat., 2014, 77, 146–159 CrossRef CAS.
- B. A. Bhanvase and S. H. Sonawane, Chem. Eng. J., 2010, 156, 177–183 CrossRef CAS.
- L. H. Mahajan and S. T. Mhaske, Mater. Lett., 2012, 68, 183–186 CrossRef CAS.
- A. Khan, A. M. Asiri, A. A. P. Khan, M. A. Rub, N. Azum, M. M. Rahman, A. O. Al-Youbi and A. H. Qusti, Composites, Part B, 2014, 58, 451–456 CrossRef CAS.
- D. Patil, P. Patil, Y. K. Seo and Y. K. Hwang, Sens. Actuators, B, 2010, 148, 41–48 CrossRef CAS.
- S. M. Ghoreishi, M. Shabani-Nooshabadi, M. Behpour and Y. Jafari, Prog. Org. Coat., 2012, 74, 502–510 CrossRef.
- A. Kormányos, B. Endrődi, R. Ondok, A. Sápi and C. Janáky, Materials, 2016, 9, 201–213 CrossRef.
- A. Kassiba, W. Bednarski, A. Pud, N. Errien, M. Makowska-Janusik, L. Laskowski, M. Tabellout, S. Kodjikian, K. Fatyeyeva, N. Ogurtsov and Y. Noskov, J. Phys. Chem. C, 2007, 111, 11544–11551 CAS.
- J. Y. Hao, Y. Y. Wang, X. L. Tong, G. Q. Jin and X. Y. Guo, Int. J. Hydrogen Energy, 2012, 37, 15038–15044 CrossRef CAS.
- D. Sangamithirai, V. Narayanan, B. Muthuraaman and A. Stephen, Mater. Sci. Eng., C, 2015, 55, 579–591 CrossRef CAS PubMed.
- S. Thakur and P. Patil, RSC Adv., 2015, 6, 45768–45782 RSC.
- M. J. Niu and X. J. Kong, RSC Adv., 2015, 5, 27273–27277 RSC.
- D. Sangamithirai, S. Munusamy, V. Narayanan and A. Stephen, Surf. Interfaces, 2016, 4, 27–34 CrossRef.
- J. Q. Chen, Z. B. Xia, H. Li, Q. Li and Y. J. Zhang, Electrochim. Acta, 2015, 166, 174–182 CrossRef CAS.
- H. M. Zhang, W. Q. Zhou, Y. K. Du, J. K. Xu and P. Yang, J. Mater. Sci., 2010, 45, 5795–5801 CrossRef CAS.
- J. Zhang, D. Shu, T. R. Zhang, H. Y. Chen, H. M. Zhao, Y. S. Wang, Z. J. Sun, S. Q. Tang, X. M. Fang and X. F. Cao, J. Alloys Compd., 2012, 532, 1–9 CrossRef CAS.
- X. F. Yang, G. C. Wang, R. Y. Wang and X. W. Li, Electrochim. Acta, 2010, 55, 5414–5419 CrossRef CAS.
- C. B. Hu, Y. Li, Y. Z. Kong and Y. S. Ding, Synth. Met., 2016, 214, 62–70 CrossRef CAS.
- H. G. Wei, J. H. Zhu, S. J. Wu, S. Y. Wei and Z. H. Guo, Polymer, 2013, 54, 1820–1831 CrossRef CAS.
- Y. Q. Qing, C. N. Yang, N. N. Yu, Y. Shang, Y. Z. Sun, L. S. Wang and C. S. Liu, Chem. Eng. J., 2016, 290, 37–44 CrossRef CAS.
- T. C. Yeh, T. C. Huang, H. Y. Huang, Y. P. Huang, Y. T. Cai, S. T. Lin, Y. Wei and J. M. Yeh, Polym. Chem., 2012, 3, 2209–2216 RSC.
- M. G. Hosseini, M. Jafari and R. Najjar, Surf. Coat. Technol., 2011, 206, 280–286 CrossRef CAS.
- C. J. Xing, Z. M. Zhang, L. M. Yu, G. I. N. Waterhouse and L. J. Zhang, Prog. Org. Coat., 2014, 77, 354–360 CrossRef CAS.
- S. P. Harrington and T. M. Devine, J. Electrochem. Soc., 2009, 156, C154–C159 CrossRef CAS.
- S. Sathiyanarayanan, V. Karpakam, K. Kamaraj, S. Muthukrishnan and G. Venkatachari, Surf. Coat. Technol., 2010, 204, 1426–1431 CrossRef CAS.
- R. Arefinia, A. Shojaei, H. Shariatpanahi and J. Neshati, Prog. Org. Coat., 2012, 75, 502–508 CrossRef CAS.
- S. Pour-Ali, C. Dehghanian and A. Kosari, Corros. Sci., 2014, 85, 204–214 CrossRef CAS.
- H. Ashassi-Sorkhabi and M. Es’haghi, J. Coat. Technol. Res., 2014, 11, 371–380 CrossRef CAS.
- S. Chaudhari and P. P. Patil, Electrochim. Acta, 2011, 56, 3049–3059 CrossRef CAS.
- S. Chaudhari, S. R. Sainkar and P. P. Patil, J. Phys. D: Appl. Phys., 2007, 40, 520–533 CrossRef CAS.
- M. A. Deyab, J. Power Sources, 2014, 268, 50–55 CrossRef CAS.
- V. Karpakam, K. Kamaraj, S. Sathiyanarayanan, G. Venkatachari and S. Ramu, Electrochim. Acta, 2011, 56, 2165–2173 CrossRef CAS.
- B. D. Mert and B. Yazıcı, Mater. Chem. Phys., 2011, 125, 370–376 CrossRef CAS.
- G. Gupta, N. Birbilis, A. B. Cook and A. S. Khanna, Corros. Sci., 2013, 67, 256–267 CrossRef CAS.
- F. Chen and P. Liu, ACS Appl. Mater. Interfaces, 2011, 3, 2694–2702 CAS.
- P. Sambyal, G. Ruhi, H. Bhandari and S. K. Dhawan, Surf. Coat. Technol., 2015, 272, 129–140 CrossRef CAS.
- Y. Sasikumar, A. M. Kumar, Z. M. Gasem and E. E. Ebenso, Appl. Surf. Sci., 2015, 330, 207–215 CrossRef CAS.
| This journal is © The Royal Society of Chemistry 2017 |

