 Open Access Article
All-solid-state asymmetric supercapacitors based on cobalt hexacyanoferrate-derived CoS and activated carbon†
K. Subramani ab,
N. Sudhanac,
R. Divyaa and
M. Sathish
 *a
*a
aFunctional Materials Division, CSIR-Central Electrochemical Research Institute, Karaikudi – 630 003, Tamilnadu, India. E-mail: marappan.sathish@gmail.com; msathish@cecri.res.in
bAcademy of Scientific and Innovative Research (AcSIR), India
cCentre for Education, CSIR-Central Electrochemical Research Institute, Karaikudi – 630 003, Tamilnadu, India
First published on 20th January 2017
Abstract
All-solid-state asymmetric supercapacitors have received significant attention for being flexible, bendable, and wearable energy storage devices due to their optimum energy and power densities. Nanostructured transition-metal chalcogenides have been used as positive electrodes in the asymmetric supercapacitors due to their high theoretical capacitance, good rate capability, and excellent cycling stability. Electrochemically active dumb-bell shaped cobalt sulfide (CoS) particles were prepared via solvothermal decomposition of cobalt hexacyanoferrate (CoHCF). The dumb-bell shaped particles (2.1 to 2.7 μm in length with a lateral size of ∼1.3 μm) were formed via the self-assembly of 10–20 nm sized CoS nanoparticles. CoS exhibited a high specific capacitance of 310 F g−1 at a current density of 5 A g−1 and 95% of capacitance retention after 5000 charge–discharge cycles in a three-electrode system. An all-solid-state flexible asymmetric supercapacitor (ASC) device was fabricated using CoS and activated carbon as positive and negative electrodes, respectively. The PVA/KOH-based solid-state electrolyte offers high flexibility to the all-solid-state supercapacitor device. It exhibited a maximum cell voltage of 1.8 V with a high specific capacitance of 47 F g−1 at a current density of 2 A g−1. Moreover, the fabricated device delivered a high energy density of 5.3 W h kg−1 and a high power density of 1800 W kg−1 with an excellent electrochemical stability of 92% even after 5000 cycles at 10 A g−1 current density. Furthermore, the solvothermal decomposition strategy for the preparation of metal sulfide could be applicable for the preparation of other metal sulfide electrode materials.
1. Introduction
The development and discovery of new eco-friendly energy generation and storage materials, which must be developed due to the paucity of fossil fuels and their associated health problems in human and the environment, is a must to enervate our energy demands.1,2 Over the past decade, our inevitable energy needs have been balanced due to energy storage and conversion devices such as batteries and fuel cells.1,3,4 In the consideration of energy storage, batteries and conventional capacitors are the main devices that persistently store and deliver the power. According to the abovementioned statement, capacitors, as energy storage devices, suffer from low energy density; however, they have high power density. On the other hand, batteries have high energy density and low power density.1,2,4 Due to this inflexible gap between conventional capacitors and batteries, a new advent of electrochemical capacitors is called supercapacitor, which has optimal energy density and power density between conventional capacitors and batteries.1,5,6 In recent years, significant attention has been paid to supercapacitors research due to their eco-friendliness, energy efficiency, moderate energy density, and high power density. Nowadays, supercapacitors have been employed in portable electronics and hybrid vehicles due to their ingenious properties such as high energy density, fast charge–discharge processes, good cycle life, and low maintenance cost.3,4 Based on the materials and the charge storage mechanism, supercapacitors can be categorized into two types. One is electric double-layer capacitors (EDLCs) type of materials that can store energy by physical adsorption and desorption processes that occur at the electrode and electrolyte interface.1,6,7 The other type is pseudocapacitive materials, which has gained extensive interest due to their fast surface redox reactions and high specific capacitance.7 However, pseudocapacitive materials also suffer from some disadvantages related to the limitation of energy and power densities. Recently, hybrid-based asymmetric supercapacitors (ASC) have received significant attention due to their improved energy density with maximum power. Generally, ASC consists of faradaic and non-faradaic components such as metal oxide (or metal sulfide) electrode materials and carbonaceous electrode materials, respectively. In fact, the faradaic component is responsible for the energy and the non-faradaic component influences the power.8–11 Accordingly, a combination of both components can improve the overall enhanced cell voltage. To the best of our knowledge, other commercially offered supercapacitors in the market do not have this kind of asymmetric configuration.In recent years, metal oxide/sulfide-based electrode materials are more interesting towards supercapacitor applications due to their high specific capacitance, excellent redox reversibility, and high electrical conductivity.12–15 In recent times, a raft of sulfide-based electrode materials, such as CoS, NiS, Ni3S2, SnS2, CuS, MnS, NiCo2S4, and Co3S4, have been employed as emerging type of electrode materials for supercapacitors.16–21 Typically, different types of nanostructures can be responsible for effective energy storage and improve the electrochemical performance of electrode materials.8,9 More specifically, morphologies can be tuned by employing various synthesis methods such as hydrothermal, solvothermal, and supercritical fluid syntheses22 (Table S1†). Recently, a few sulfide-based electrode materials, such as nano-wires,23 nano-tubes,24 nano-sheets,25 nano-strip-like,26 and nano-flower-like27 structures, with some remarkable morphologies have been reported. The morphology of the electrode materials also has a higher impact on the overall performance of the supercapacitor device. To achieve a wide potential window, organic electrolytes or ionic liquid-based electrolytes have been used in supercapacitor applications.28–30 However, the use of abovementioned non-aqueous electrolytes has been restricted due to their toxicity, limited ionic conductivity, and poor cost-effectiveness. Herein, to stabilize these effects, an aqueous asymmetric supercapacitor (ASC) with a maximum cell voltage of 1.8 V has been introduced.31,32
Solid-state gel electrolytes have been used in supercapacitor devices to attain flexible, bendable, and paper-like modulations for miniaturizing the current devices.10,33 Recently, X. Meng et al.16 reported the hydrothermal synthesis of interconnected three-dimensional (3D) structured CoS/graphene composite hydrogel (3D CGH) materials. Compared to that of pure CoS (433 F g−1), 3D CGH exhibits a high specific capacitance of 564 F g−1 at a current density of 1 A g−1. R. B. Rakhi et al.34 have reported that porous cobalt sulfide (Co9S8) nanostructures, which directly develops over the carbon fiber, can be used as electrodes for asymmetric hybrid supercapacitors. In this study, asymmetric hybrid supercapacitors were constructed from Co9S8 and activated carbon (AC) as cathode and anode, respectively, with a cell voltage of 1.6 V. The 2D Co9S8||AC asymmetric hybrid supercapacitor exhibits a gravimetric cell capacitance of 82.9 F g−1 at a constant current density of 1 A g−1. S. Liu et al.35 have reported ultra-long cobalt sulfide (CoS1.097) nanotube networks, synthesized by a simple one-step solvothermal method, in the working potential range from 0 to 1.5 V with a calculated specific capacitance of 107 F g−1 at 1 A g−1. The capacitance retention was 91.7% and 83.3%, even after 2000 cycles and 5000 cycles, respectively. J. Shi et al.36 demonstrated the fabrication of a high-performance 3D CoS/graphene hybrid network on a Ni foam surface via a two-step electrodeposition process. The fabricated CoS/graphene||AC asymmetric supercapacitor in a 2 M KOH solution exhibited a maximum specific capacitance of 80 F g−1 at a current density of 1 A g−1. From the abovementioned studies, it is obvious that CoS-based electrode materials exhibit good electrochemical behavior for full cell studies. To our knowledge, there are only few limited reports available for the CoS-based flexible and bendable all-solid-state asymmetric supercapacitors.
Herein, we demonstrated the preparation of CoS nanoparticles via simple solvothermal decomposition of cobalt hexacyanoferrate (CoHCF). The prepared materials were characterized by XRD, FT-IR spectroscopy, FE-SEM analysis, and HR-TEM analysis. The electrochemical properties of CoS and activated carbon (AC) were investigated by cyclic voltammetry (CV) and galvanostatic charge/discharge (CD) experiments. All-solid-state flexible asymmetric supercapacitor (ASC) cells were fabricated using PVA/KOH, CoS, and AC as a polymer solid-state gel electrolyte, cathode and anode materials, respectively. The flexible ASC cell exhibited a high energy and power density of 5.3 W h kg−1 and 9000 W kg−1, respectively, with an excellent electrochemical stability of 92%, even after 5000 cycles at a high current density. Note that this methodology is readily applicable for preparing other metal sulfide nanoparticles for electrochemical applications.
2. Materials and methods
2.1. Materials
Cobalt nitrate [Co(NO3)2·6H2O, 99%], activated carbon (mesoporous graphitized carbon black, 99.95%), poly(vinyl alcohol) ([–CH2CHOH–]n, Mw ∼ 125![[thin space (1/6-em)]](https://www.rsc.org/images/entities/char_2009.gif) 000), and PVDF poly(vinylidene fluoride) were purchased from Sigma-Aldrich, India. Sodium sulfide (Na2S), potassium hydroxide (KOH), sodium hydroxide (NaOH), ethanol (CH3CH2OH), N-methyl-2-pyrrolidone (NMP), L-ascorbic acid, and potassium ferricyanide (K3[Fe(CN)6], 99%) were purchased from E-Merck Co. Ltd. Graphite foil (0.13 mm thick, 99.8%) was purchased from Alfa Aesar India Pvt. Ltd. All purchased chemicals were of analytical grade and used as received without any further purification. Deionized (DI) water was obtained through a Millipore water system.
000), and PVDF poly(vinylidene fluoride) were purchased from Sigma-Aldrich, India. Sodium sulfide (Na2S), potassium hydroxide (KOH), sodium hydroxide (NaOH), ethanol (CH3CH2OH), N-methyl-2-pyrrolidone (NMP), L-ascorbic acid, and potassium ferricyanide (K3[Fe(CN)6], 99%) were purchased from E-Merck Co. Ltd. Graphite foil (0.13 mm thick, 99.8%) was purchased from Alfa Aesar India Pvt. Ltd. All purchased chemicals were of analytical grade and used as received without any further purification. Deionized (DI) water was obtained through a Millipore water system.
2.2. Preparation of the CoHCF complex and CoS nanoparticles
The two-step synthesis of CoS nanoparticles was carried out through the formation of a CoHCF complex followed by solvothermal conversion into crystalline CoS nanoparticles. In a typical preparation, 10 mM Co(NO3)2·6H2O was slowly added to 10 mM of K3[Fe(CN)6] and stirred for 3 h. The resulting CoHCF complex was washed with DI water and dried at 70 °C in a hot air oven. Then, 300 mg of dried CoHCF powder (dissolved in 10 ml ethanol) was mixed with 100 mg of ascorbic acid (dissolved in 10 ml ethanol). To this mixture, 2.4 g of sodium sulfide (dissolved in 10 ml of ethanol) was added and stirred for 1 h. The resulting mixture (30 ml) was transferred to a 50 ml Teflon-lined stainless steel autoclave and kept in a hot air oven at 180 °C for 24 h. The resulting precipitate was filtered, washed with DI water followed by ethanol, and finally dried at 70 °C for 3 h. The dried cake was ground to make a fine CoS powder.2.3. Materials characterization
The phase formation and crystalline nature of the CoS nanoparticles was examined by powder X-ray diffraction (XRD) (Bruker D8 Advance X-ray diffractometer) using Cu Kα radiation (λ = 1.5418 Å) in the 2θ range from 10 to 80° at 0.02° steps with a count time of 0.2 s at each step. Fourier transform infrared (FT-IR) spectra were obtained by a Tensor 27 spectrometer (Bruker) from 400 to 4000 cm−1 using the KBr pellet technique. Nitrogen adsorption–desorption isotherm and pore-size distribution of the CoS nanoparticles was measured using a Quantachrome NOVA 3200e surface area analyzer. The morphology and particle size of the CoS nanoparticles were analyzed by field-emission scanning electron microscopy (FE-SEM, Carl Zeiss Supra 55VP) and high resolution-transmission electron microscopy (HR-TEM, Tecnai G2 TF20).2.4. Electrochemical characterization
The electrochemical behavior of CoS nanoparticles was studied via CV, CD, and electrochemical impedance spectroscopy (EIS) using a potentiostat–galvanostat (SP-300, BioLogic) instrument. The working electrode was prepared by mixing CoS nanoparticles, activated carbon, and PVDF at a 75![[thin space (1/6-em)]](https://www.rsc.org/images/entities/char_2009.gif) :
:![[thin space (1/6-em)]](https://www.rsc.org/images/entities/char_2009.gif) 20
20![[thin space (1/6-em)]](https://www.rsc.org/images/entities/char_2009.gif) :
:![[thin space (1/6-em)]](https://www.rsc.org/images/entities/char_2009.gif) 5 weight ratio in N-methyl-2-pyrrolidone (NMP) as a solvent, respectively. The resulting slurry was coated over a graphite foil (2 × 2 cm) current collector and dried in a vacuum oven at 70 °C for 5 h. The active materials loading (∼2 mg) was calculated using the weight difference of the graphite foil before and after coating. The AC negative electrode was prepared by mixing 95% of AC and 5% PVDF in NMP, and the resulting slurry was coated on a graphite foil (2 × 2 cm) current collector and dried in a vacuum oven at 70 °C for 5 h. For the three-electrode configuration, electrode materials coated graphite foils, Hg/HgO (20% KOH), and a slice of Pt foil were used as a working electrode, reference electrode, and counter electrode, respectively. CV, CD, and EIS measurements were carried out using 3.5 M KOH electrolyte at different scan rates (5 to 50 mV s−1) and various current densities (5 to 50 A g−1). The specific capacitance values of CoS and AC were estimated from the discharge profile using the following equation:
5 weight ratio in N-methyl-2-pyrrolidone (NMP) as a solvent, respectively. The resulting slurry was coated over a graphite foil (2 × 2 cm) current collector and dried in a vacuum oven at 70 °C for 5 h. The active materials loading (∼2 mg) was calculated using the weight difference of the graphite foil before and after coating. The AC negative electrode was prepared by mixing 95% of AC and 5% PVDF in NMP, and the resulting slurry was coated on a graphite foil (2 × 2 cm) current collector and dried in a vacuum oven at 70 °C for 5 h. For the three-electrode configuration, electrode materials coated graphite foils, Hg/HgO (20% KOH), and a slice of Pt foil were used as a working electrode, reference electrode, and counter electrode, respectively. CV, CD, and EIS measurements were carried out using 3.5 M KOH electrolyte at different scan rates (5 to 50 mV s−1) and various current densities (5 to 50 A g−1). The specific capacitance values of CoS and AC were estimated from the discharge profile using the following equation:
 | (1) |
 | (2) |
| Csp = 4Ct | (3) |
| E = ½CtΔV2 | (4) |
 | (5) |
2.5. Preparation of the PVA/KOH all-solid-state gel electrolyte
The alkaline PVA/KOH polymer electrolyte was prepared by a solution-casting method similar to that reported in the literature.37,38 Initially, 1.0 g of PVA was dissolved in 25 ml of water with continuous stirring for about 4 h at 80 °C. After complete dissolution of the PVA polymer, 1.0 g of KOH (dissolved in 25 ml water by continuous stirring for 5 h at 95 °C) was added and the resulting solution was continuously stirred until the formation of a homogeneous viscous solution. The abovementioned viscous solution was poured into Petri dishes and allowed to slowly dry at room temperature to form a thin film, and the average thickness of the thin film was ∼0.3 mm (Fig. S1†).3. Results and discussion
Decomposition of the CoHCF complex by an alkali results in the formation of Co(OH)2 precipitate that gets oxidized further to Co3O4 without any heat treatment.39 Herein, the CoHCF complex was solvothermally (180 °C for 24 h) converted into cobalt sulfide in presence of Na2S and ascorbic acid as the sulfide source and mild reducing agent, respectively. Fig. 1 represents the schematic of the CoS nanoparticles preparation by solvothermal decomposition of CoHCF in the presence of ascorbic acid and a sulfide source. Note that ultra-fine crystalline CoS nanoparticles were formed without any high temperature calcination process.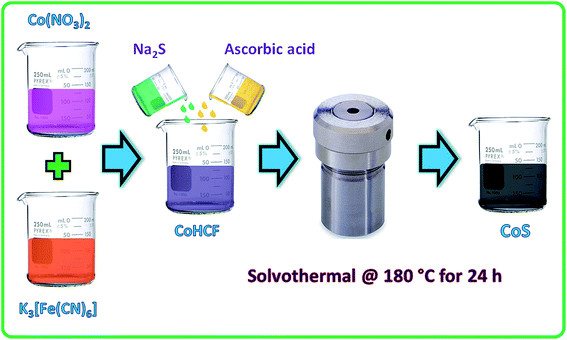 | ||
| Fig. 1 Schematic of the CoHCF complex preparation and solvothermal decomposition of CoHCF into CoS nanoparticles. | ||
Powder X-ray diffraction pattern (PXRD) is a primary analytical tool to identify the crystalline nature of the materials. Fig. 2a shows the XRD patterns of the CoHCF complex, CoS nanoparticles and their respective ICDD reference patterns. All the diffraction peaks of the CoHCF complex were indexed with the standard cubic CoHCF phase, which is in good agreement with the ICDD card number 01-075-0038. The observed diffraction peaks at 17.9, 25.4, 36.2, 40.5, 44.7, 52.2, and 58.9° were assigned to the (200), (220), (400), (200), (422), (440), and (620) reflection lines of the CoHCF complex, respectively. Moreover, the highly intense reflection line indicates the good crystallinity of the synthesized CoHCF complex. The average crystalline size of the particles was calculated from the XRD pattern using the Debye–Scherrer40 equation as follows:
 | (6) |
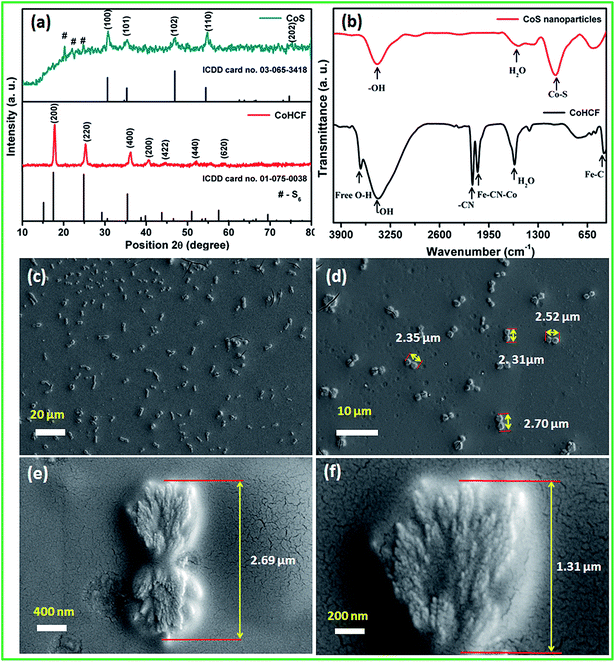 | ||
| Fig. 2 (a) XRD pattern, (b) FT-IR spectra of the CoHCF complex and CoS nanoparticles, and (c–f) FE-SEM images of the as-synthesized CoS at different magnifications. | ||
The presence of various functional groups in the synthesized materials was examined using FT-IR spectroscopy between 4000 to 400 cm−1 and the results are shown in Fig. 2b. The two broad νCN absorption bands of PB-structured materials (between 2000 and 2200 cm−1) is the diagnostic of the C-bound metal ion and its oxidation state.41 In this region, the CoHCF showed two peaks: one strong peak at 2162 cm−1 and a weak peak at 2099 cm−1. The absorption band at 2099 cm−1 might be attributed to the CN stretching in the cobalt–iron cyanide (Fe2+–CN–Co3+) of PB analogue CoHCF.42 The vibration peaks corresponding to OH bonding on the surface of CoS nanoparticles have been observed around 3430 cm−1 and reveals that the as-synthesized samples were highly hydrous in nature. The peaks at 1620 and 1100 cm−1 for CoS were due to the bending vibration of adsorbed H2O molecules and sulphonated groups in the pure CoS nanoparticles. The presence of the sulfur linkage was confirmed by the presence of a peak observed at 605 cm−1. The surface area and porous nature of the electrode materials are key parameters for determining the electrochemical performance. Fig. S2† reveals the Brunauer–Emmett–Teller (BET) N2 adsorption/desorption isotherms with a distinct hysteresis loop in the range from 0.45 to 1.0 (P/P0) that suggest a typical type-IV isotherm (for a mesoporous nature). The BET surface area of 28 m2 g−1 was obtained for the CoS nanoparticles. Based on the adsorption–desorption profile, fitted with the Barrett–Joyner–Halenda (BJH) model, a narrow pore size distribution between 6 and 8 nm with a total pore volume of 0.107 cm3 g−1 was observed (Fig. S2† (inset)).
The surface morphology and particle size of the as-synthesized CoS nanoparticles were analyzed using FE-SEM and HR-TEM, respectively. The FE-SEM images (Fig. 2c and d) reveal the dumb-bell-like morphology of the CoS nanoparticles at low magnification. It can be clearly seen that the dumb-bell-shaped particles are well dispersed in the entire sample. The length of the dumb-bell shaped CoS was in the range from 2.1 to 2.7 μm and each side of the dumb-bell had an average lateral size of ∼1.3 μm (Fig. 2e). The dumb-bell shape of CoS was formed by the assembly of 10–20 nm sized CoS nanoparticles (Fig. 2f). The dumb-bell-like CoS was further studied via HR-TEM analysis at different magnifications, as shown in Fig. 3. Fig. 3a and b clearly confirms the homogeneous dispersion of ultra-fine CoS nanoparticles on the dumb-bell-like assembly. Fig. 3c and d reveals the formation of ultra-fine CoS nanoparticles in the range of 5–10 nm in size. The calculated particles sizes were in good correspondence with the XRD observations. The observed lattice fringes, with d-spacings of 0.250 and 0.191 nm corresponding to (101) and (102) planes, respectively, confirmed the formation of crystalline spinal-type cubic CoS nanoparticles, as shown in Fig. 3d. The observed FFT pattern (Fig. 3d inset) confirms the existence of the poly-crystalline nature of the CoS nanoparticles. From the abovementioned electron microscopic analysis, it is clear that ultra-fine crystalline CoS nanoparticles of 5–10 nm in size were formed during the solvothermal decomposition of the CoHCF complex in the presence of ascorbic acid and sodium sulfide. Moreover, the resulting CoS nanoparticles self-assembled into an overall dumb-bell-like shapes.
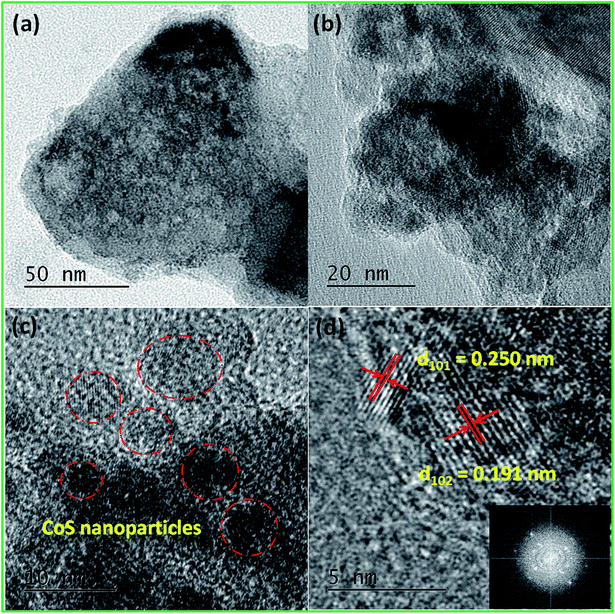 | ||
| Fig. 3 (a–d) High resolution transmission electron microscopy images of the CoS nanoparticles at different magnifications and the FFT image (inset). | ||
3.1. Electrochemical characterization
| CoS + OH− ⇌ CoSOH + e− | (7) |
| CoSOH + OH− ⇌ CoSO + H2O + e− | (8) |
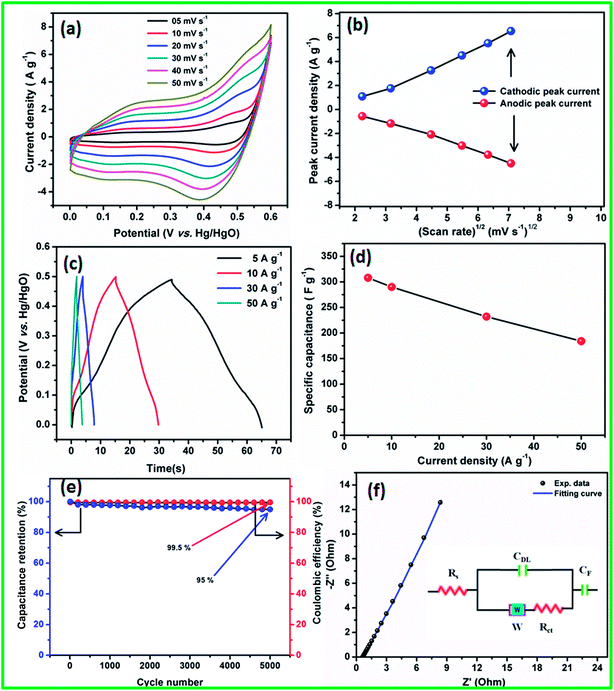
The linear relationship observed between the redox peak current and the square root of the scan rate (Randles–Sevcik43 plot) suggests that the electrode surface reactions at all scan rates were diffusion-controlled processes (Fig. 4b). The observed redox peaks involved OH− diffusion from the electrolyte to the electrode surface and from the electrode to the electrolyte during the reduction and oxidation processes, respectively.
The specific capacitances of the electrode materials were calculated using CD experiments from 0 to 0.5 V (vs. Hg/HgO) potential range at various current densities (Fig. 4c). The humps observed in the CD profiles at all current densities confirmed the pseudocapacitive behavior of the electrode materials, which were in good agreement with the CV studies. From the CD curve, very high specific capacitances of 310, 290, 232, and 184 F g−1 were obtained at 5, 10, 30, and 50 A g−1 current densities, respectively. The specific capacitance as a function of current density is shown in Fig. 4d, and it is clear from the plot that even at a high current density of 50 A g−1, the CoS electrode retains 60% of the initial capacitance. The observed excellent rate performance of CoS nanoparticles clearly confirms that they are the best materials for high power density applications. The long-term stability of the CoS nanoparticles electrode was studied using 5000 charge/discharge cycles at 50 A g−1 (Fig. 4e). 95% of the initial capacitance was retained after 5000 charge/discharge cycles with 99.5% coulombic efficiency, which is one of the best values among those reported in literature to date.
To understand the charge transfer process in the CoS nanoparticles electrode/electrolyte interface and the resistance, EIS was performed in the frequency range from 10 mHz to 100 kHz, with an alternating current amplitude of 5 mV, and the resulting Nyquist plot is shown in Fig. 4f. The EIS curves of the electrode materials show the presence of solution resistance or bulk resistance (Rs), semicircle at a high frequency region, and linear line greater than 45° to the real axis towards the imaginary axis at low frequency regions, which suggests the good capacitive behavior of the material. All the EIS curves were fitted with an equivalent circuit containing various R and C components (Fig. 4f inset). The CoS electrode material showed an Rs value of ∼0.31 Ω, which clearly indicates that the ionic resistance of the electrolyte was less and helped for better electron transport during charge/discharge cycling. The semicircle at the high frequency region corresponds to the combination of charge-transfer resistance (Rct ∼ 0.85 Ω) and double layer capacitance (Cdl) at the electrode/electrolyte interface.39 The intercepts of the semicircle with the real axis at Rs and (Rs + Rct) provides the Rct and Rs values, respectively. The straight line in the high frequency region was more vertical and had less imaginary parts, corresponding to the low diffusion resistance (Warburg impedance, W).36 CF denotes the pseudocapacitance component of the electrode materials, which was due to the electrochemical faradaic transition of CoS in an alkali medium.
| q+ = C+ × ΔE+ × m+ | (9) |
| q− = C− × ΔE− × m− | (10) |
 | (11) |
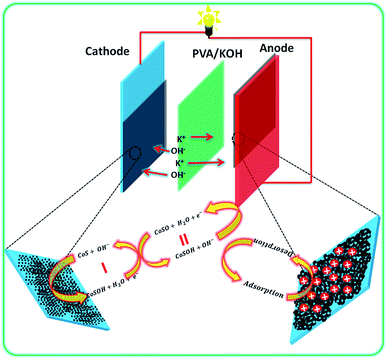 | ||
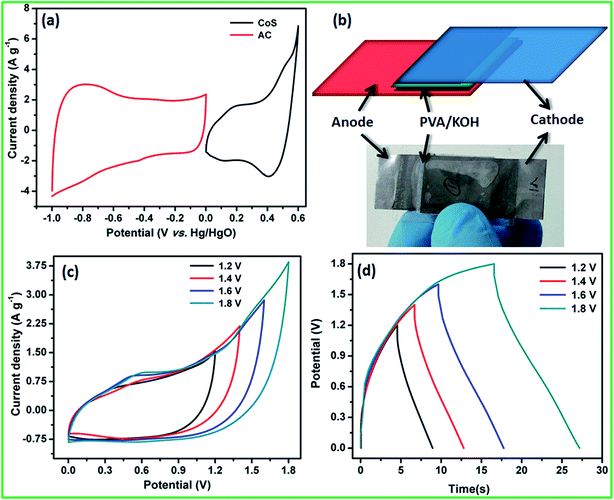
| Fig. 6 Schematic of the flexible asymmetric supercapacitor fabrication with PVA/KOH-based all-solid-state electrolyte and their energy storage mechanism. | ||
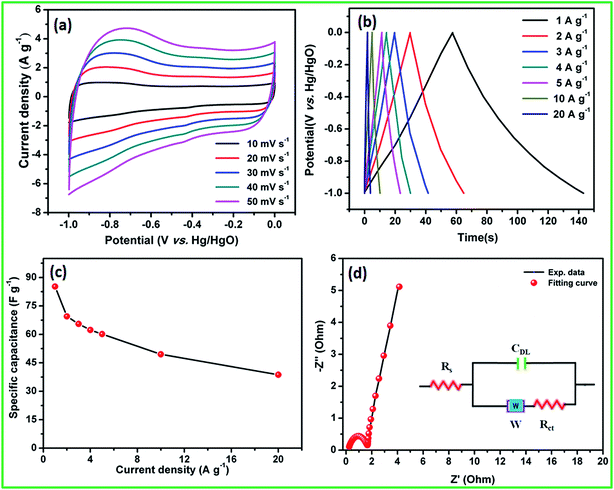
Based on the positive and negative electrode performance studies, the calculated optimal mass ratio of positive electrode (m+) and negative electrode (m−) was 0.387 for the best ASC performance.
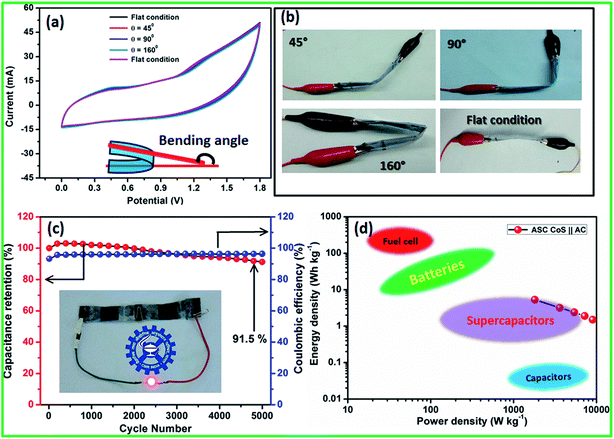
Electrochemical performance of the fabricated flexible ASC was evaluated using CV profiles at different working potential ranges at a scan rate of 50 mV s−1. At the cell voltage of 1.8 V, the ASC shows significant rectangular-shaped CV profiles with redox peaks indicating the synergistic effect of pseudocapacitance and EDLCs (Fig. 7c). A maximum specific capacitance of 47 F g−1 was obtained at 1.8 V and the specific capacitance decreased when the cell voltage decreased. At the cell voltage of 1.2 V, the ASC showed a specific capacitance of 29 F g−1. The CV profile of the ASC at different working cell voltages, such as 1.4, 1.6, and 1.8 V, with various scan rates, such as 5, 25, 50, 75, and 100 mV s−1, are shown in Fig. S3.† It could be clearly seen that the shape of the CV curve does not change with the increasing scan rate as well as increasing cell voltage, which indicates that there was no oxygen or hydrogen evolution occurring within the working cell voltage. All the CV curves clearly showed the surface redox peaks due to the presence of pseudocapacitive behavior. The CD profile of the ASC at different working cell voltages in the range of 1.4, 1.6 and 1.8 V with various current densities, such as 2, 4, 6, 8 and 10 A g−1, also showed a similar observation (Fig. S3†). The calculated specific capacitance at all cell voltages and all current densities are listed in Table S3 in ESI.† The specific capacitances of the fabricated flexible ASC cell as a function of current densities and cell voltage are shown in Fig. S4.† It could be clearly seen that at a high current density, 30% of the initial capacitance was retained. Moreover, at a low cell voltage of 1.4 V, 62% of the initial capacitance was retained as compared to that at high cell voltage of 1.8 V. To find the mechanical flexibility of the fabricated ASC device, the CV profile was measured at different bending angles. Fig. 8a and b reveals the CV profiles of the fabricated flexible ASC in the maximum cell voltage of 1.8 V at a scan rate of 100 mV s−1 at different bending angles such as 45, 90, and 160° (Fig. 8a and b). Even at a higher bending angle of 160°, the shape and current of the CV curve was the same as that of the device at the flat position, which confirms the mechanical flexibility of the electrode materials.
For viable applications, supercapacitors should have long term electrochemical stability. Moreover, the stability of the fabricated flexible ASC was evaluated for 5000 cycles at the high current density of 10 A g−1 (Fig. 8c). The specific capacitance as a function of cycle number shows an excellent electrochemical stability of >92% after 5000 cycles. To the best of our knowledge, this is one of the best values among those reported for flexible ASCs. For instance, Zhang et al.48 reported the CuS||AC asymmetric cell with 88% capacitance retention after 4000 cycles and Rakhi et al.34 reported the Co9S8 nanoflakes||AC asymmetric cell with 90% of the initial capacitance even after 5000 cycles. Similarly, Wu et al.47 demonstrated the cobalt chloride carbonate hydroxide nanowire arrays (CCCH NWAs)||AC asymmetric supercapacitor with 73.7% of the initial capacitance after 2000 cycles. Dai et al.49 demonstrated the asymmetric supercapacitor based on Ni3S2/MWCNT–NC||AC with 90% of the capacitance retention after 5000 cycles. Singh et al.50 reported the MWCNT/NiS//GNP-based asymmetric supercapacitor that exhibited a capacitance retention of 92% after 1000 cycles.
The typical Nyquist plot of the fabricated flexible ASC cell showed a Rs and Rct value of 4.2 and 1.04 Ω, respectively (Fig. S5†). The straight line in the high frequency region is more vertical and has less imaginary parts, which implies that the fabricated ASC cell has a low diffusion resistance (Warburg impedance, W). RL and CL are denoted as leakage resistance and mass capacitance, respectively. From the EIS studies, it was confirmed that the fabricated ASC cell has excellent electrical contact with minimum ionic resistance. The coulombic efficiency of the ASC cell was maintained at 96% for all 5000 cycles at the high current density of 10 A g−1. Thus, the optimization of the fabricated flexible ASC cell voltage is essential for commercial applications. To achieve higher cell voltages, two asymmetric cells were connected in a series configuration to obtain a cell voltage of 3.6 V. Fig. S6† reveals the CD profiles of the fabricated flexible ASC in a single cell and two cells connected in series configurations at 1 A g−1 current density. The CD profile shows an ideal pseudocapacitive behavior at the cell voltage from 0 to 3.6 V; this clearly indicates that the working cell voltage could be increased to 3.6 V by connecting two cells in series. Fig. S7† shows the CD profile of the fabricated flexible ASC with two cells connected in series configurations at different current densities.
The performance of a supercapacitor is rated in terms of energy density and power density. The typical Ragone plot of the fabricated flexible ASC cell at the cell voltage of 1.8 V clearly indicates that the fabricated device has a wide range of energy and power densities (Fig. 8d). It could be clearly seen from the plot that the fabricated ASC can provide a high energy density without sacrificing much power density. The fabricated CoS||AC-based flexible all-sold-state ASC cell exhibited a remarkably high energy density and a power density of 5.3 W h kg−1 and 1800 W kg−1 at 2 A g−1 current density, respectively. Even at a high current density (10 A g−1), the fabricated ASC cell delivered the energy density of 1.53 W h kg−1 with a high power density of 9000 W kg−1. These values were much closer to the recently reported values for all-solid-state asymmetric supercapacitor cells (Table S2†). The remarkable electrochemical performance of the fabricated all-solid-state flexible ASC can be attributed to the good combination of ultra-fine and highly crystalline CoS nanoparticles and activated carbon electrodes. To reduce the cost of the supercapacitor for viable applications, the cells were fabricated without affecting the cell performance using polymer gel electrolyte and the cells were flexible and bendable in nature. Note that this method is facile and scalable for the bulk preparation of CoS nanoparticles for large scale commercial applications. In addition, this methodology could be readily extended to the preparation of other metal sulfides.
4. Conclusions
The facile synthesis of crystalline hexagonal dumb-bell-shaped CoS nanoparticles was demonstrated using solvothermal decomposition of the CoHCF complex. Na2S and ascorbic acid acted as sulphur source and reducing agent to prevent oxide formation, respectively. The electron microscopy analysis revealed the formation of dumb-bell-shaped CoS by the self-assembly of nanocrystalline CoS particles of 10–20 nm in size. This shape of the nanoparticles enhanced the electrochemical active sites and easy permeability of electrolyte for enhanced redox reactions. Electrochemical studies showed the specific capacitance of 307 and 60 F g−1 at 5 A g−1 for CoS nanoparticles and the AC electrode, respectively, in the three-electrode configuration with low resistance. Moreover, the CoS nanoparticles and AC electrodes showed appropriate potential windows that could be used as negative and positive electrodes in the asymmetric supercapacitors. The fabricated flexible all-solid-state ASC cell delivered a maximum cell voltage of 1.8 V with high energy and power densities of 5.3 W h kg−1 and 1800 W kg−1, respectively, at the current density of 5 A g−1. In addition, the ASC cell exhibited an excellent electrochemical stability of 92% even after 5000 cycles at the current density of 10 A g−1. This solvothermal decomposition of metal hexacyanoferrate complex through the respective sulfide methodology could be readily extended for the preparation of other metal sulfides.Acknowledgements
K. S. would like to thank DST, India for the financial support through DST-INSPIRE fellowship (IF131153) and M. S. would like to thank CSIR-INDIA for the financial support through MULTIFUN (CSC0101) project.Notes and references
- B. E. Conway, Electrochemical Supercapacitors Scientific Fundamentals and Technological Applications, Springer, US, Boston, MA, 1999 Search PubMed.
- M. Winter and R. J. Brodd, Chem. Rev., 2004, 104, 4245–4270 CrossRef CAS PubMed.
- J. R. Miller and P. Simon, Science, 2008, 321, 651–652 CrossRef CAS PubMed.
- P. Simon and Y. Gogotsi, Nat. Mater., 2008, 7, 845–854 CrossRef CAS PubMed.
- L. L. Zhang and X. S. Zhao, Chem. Soc. Rev., 2009, 38, 2520–2531 RSC.
- P. Simon, Y. Gogotsi and B. Dunn, Science, 2014, 343, 1210–1211 CrossRef CAS PubMed.
- B. E. Conway and W. G. Pell, J. Solid State Electrochem., 2003, 7, 637–644 CrossRef CAS.
- Z. Yu, L. Tetard, L. Zhai and J. Thomas, Energy Environ. Sci., 2015, 8, 702–730 CAS.
- G. Wang, L. Zhang and J. Zhang, Chem. Soc. Rev., 2012, 41, 797–828 RSC.
- P. Yang and W. Mai, Nano Energy, 2014, 8, 274–290 CrossRef CAS.
- T. Lin, C. Dai and K. Hung, Sci. Rep., 2014, 4, 7274 CrossRef CAS PubMed.
- K. Subramani, D. Jeyakumar and M. Sathish, Phys. Chem. Chem. Phys., 2014, 16, 4952–4961 RSC.
- K. Subramani, N. Lakshminarasimhan, P. Kamaraj and M. Sathish, RSC Adv., 2016, 6, 15941–15951 RSC.
- M. Sathish, S. Mitani, T. Tomai and I. Honma, J. Mater. Chem., 2011, 21, 16216 RSC.
- B. Amutha and M. Sathish, J. Solid State Electrochem., 2015, 19, 2311–2320 CrossRef CAS.
- X. Meng, J. Deng, J. Zhu, H. Bi, E. Kan and X. Wang, Sci. Rep., 2016, 6, 21717 CrossRef CAS PubMed.
- M. Sathish, S. Mitani, T. Tomai and I. Honma, J. Phys. Chem. C, 2012, 116, 12475–12481 CAS.
- G.-C. Li, M. Liu, M.-K. Wu, P.-F. Liu, Z. Zhou, S.-R. Zhu, R. Liu and L. Han, RSC Adv., 2016, 6, 103517–103522 RSC.
- E. Zhang and Y. Ni, RSC Adv., 2016, 6, 106465–106472 RSC.
- X. Wang, H. Xia, X. Wang, B. Shi and Y. Fang, RSC Adv., 2016, 6, 97482–97490 RSC.
- J. Xu, Y. Yang, H. Chu, J. Tang, Y. Ge, J. Shen and M. Ye, RSC Adv., 2016, 6, 100504–100510 RSC.
- H. Chang and H. Wu, Energy Environ. Sci., 2013, 6, 3483 CAS.
- S. Bao, C. M. Li, C. Guo and Y. Qiao, J. Power Sources, 2008, 180, 676–681 CrossRef CAS.
- H. Wan, X. Ji, J. Jiang, J. Yu, L. Miao, L. Zhang, S. Bie, H. Chen and Y. Ruan, J. Power Sources, 2013, 243, 396–402 CrossRef CAS.
- Z. Yang, C. Y. Chen and H. T. Chang, J. Power Sources, 2011, 196, 7874–7877 CrossRef CAS.
- D. P. Dubal, G. S. Gund, C. D. Lokhande and R. Holze, Energy Technol., 2014, 2, 401–408 CrossRef CAS.
- Q. Wang, L. Jiao, H. Du, J. Yang, Q. Huan, W. Peng, Y. Si, Y. Wang and H. Yuan, CrystEngComm, 2011, 13, 6960 RSC.
- M. Sathish, S. Mitani, T. Tomai and I. Honma, J. Mater. Chem. A, 2014, 2, 4731 CAS.
- D. Jiang, Z. Jin, D. Henderson and J. Wu, J. Phys. Chem. Lett., 2012, 3, 1727–1731 CrossRef CAS PubMed.
- H. Yu, J. Wu, L. Fan, S. Hao, J. Lin and M. Huang, J. Power Sources, 2014, 248, 1123–1126 CrossRef CAS.
- J. Chen, J. Xu, S. Zhou, N. Zhao and C. Wong, Nano Energy, 2016, 21, 145–153 CrossRef CAS.
- R. Wang and X. Yan, Sci. Rep., 2014, 4, 3712 Search PubMed.
- Z. A. Yu, C. Li, D. Abbitt and J. Thomas, J. Mater. Chem. A, 2014, 2, 10923–10929 CAS.
- R. B. Rakhi, N. A. Alhebshi, D. H. Anjum and H. N. Alshareef, J. Mater. Chem. A, 2014, 2, 16190–16198 CAS.
- S. Liu, C. Mao, Y. Niu, F. Yi, J. Hou, S. Lu, J. Jiang, M. Xu and C. Li, ACS Appl. Mater. Interfaces, 2015, 7, 25568–25573 CAS.
- J. Shi, X. Li, G. He, L. Zhang and M. Li, J. Mater. Chem. A, 2015, 3, 20619–20626 CAS.
- C.-C. Yang, S.-T. Hsu and W.-C. Chien, J. Power Sources, 2005, 152, 303–310 CrossRef CAS.
- F. F. Hatta, M. Z. A. Yahya, A. M. M. Ali, R. H. Y. Subban, M. K. Harun and A. A. Mohamad, Ionics, 2005, 11, 418–422 CrossRef CAS.
- K. Subramani, S. Kowsik and M. Sathish, ChemistrySelect, 2016, 1, 3455–3467 CrossRef CAS.
- B. D. Cullity and S. R. Stock, Elements of X-Ray Diffraction, Addison-Wesley, 1956 Search PubMed.
- M. Berrettoni, M. Giorgetti, S. Zamponi, P. Conti, D. Ranganathan, A. Zanotto, M. L. Saladino and E. Caponetti, J. Phys. Chem. C, 2010, 114, 6401–6407 CAS.
- O. Sato, T. Iyoda, A. Fujishima and K. Hashimoto, Science, 1996, 272, 704–705 CAS.
- P. Zanello, Inorganic Electrochemistry, Royal Society of Chemistry, Cambridge, 2003 Search PubMed.
- F. Wang, S. Xiao, Y. Hou, C. Hu, L. Liu and Y. Wu, RSC Adv., 2013, 3, 13059 RSC.
- R. R. Salunkhe, J. Tang, Y. Kamachi, T. Nakato, J. H. Kim and Y. Yamauchi, ACS Nano, 2015, 9, 6288–6296 CrossRef CAS PubMed.
- W. Liu, X. Li, M. Zhu and X. He, J. Power Sources, 2015, 282, 179–186 CrossRef CAS.
- D. Wu, T. Xiao, X. Tan, P. Xiang, L. Jiang, Z. Kang and P. Tan, Electrochim. Acta, 2016, 198, 1–9 CrossRef CAS.
- J. Zhang, H. Feng, J. Yang, Q. Qin, H. Fan, C. Wei and W. Zheng, ACS Appl. Mater. Interfaces, 2015, 7, 21735–21744 CAS.
- C.-S. Dai, P.-Y. Chien, J.-Y. Lin, S.-W. Chou, W.-K. Wu, P.-H. Li, K.-Y. Wu and T.-W. Lin, ACS Appl. Mater. Interfaces, 2013, 5, 12168–12174 CAS.
- A. Singh, A. J. Roberts, R. C. T. Slade and A. Chandra, J. Mater. Chem. A, 2014, 2, 16723–16730 CAS.
Footnote |
| † Electronic supplementary information (ESI) available: Comparison table of recent cobalt sulfide based materials, PVA/KOH thin film all-solid-state electrolyte, CV and CD profile at different cell voltage, comparison table of electrochemical properties of metal oxide/sulfide based materials, specific capacitance as a function of current density and cell voltage, EIS Nyquist plots of the fabricated flexible all-solid-state ASC, CD profile of the two cells connected in series configuration at different current densities. See DOI: 10.1039/c6ra27331a |
| This journal is © The Royal Society of Chemistry 2017 |

