 Open Access Article
Creative Commons Attribution 3.0 Unported Licence
An unexpected behavior of H3PMo12O40 heteropolyacid catalyst on the biphasic hydrolysis of vegetable oils
M. J. Da Silva * and
M. G. Teixeira
Chemistry Department, Federal University of Viçosa, Avenida Peter Henry Rolfs, s/n, Viçosa, Minas Gerais, MG, Brazil 36570-900. E-mail: silvamj2003@ufv.br; Fax: +55-31-3899-3065; Tel: +55-31-3899-3210
First published on 25th January 2017
Abstract
Fatty acids (FA) are key ingredients in formulating numerous high-value chemicals. In general, catalytic routes for their production require drastic conditions of pressure and temperature or homogeneous catalysts and high water consumption. The novelty of this work is to discover a versatile catalyst for hydrolysis reactions able to migrate from the aqueous phase into the oil phase throughout the process and then back to the initial phase at the end of reaction: the H3PMo12O40 heteropolyacid catalyst. We have found that variation in the pH value during the reaction promoted the conversion of PMo12O403− heteropolyanion to a PMo11O397− lacunar anion which was partially soluble in the oil layer, favouring the reaction. H3PMo12O40 was compared with other heteropolyacids and also to sulfuric acid. The effects of the main reaction variables such as temperature, water![[thin space (1/6-em)]](https://www.rsc.org/images/entities/char_2009.gif) :
:![[thin space (1/6-em)]](https://www.rsc.org/images/entities/char_2009.gif) oil molar ratio, concentration and type of catalyst were assessed. 1H NMR spectroscopy analysis allowed monitoring the reactions and provided fatty acid yields.
oil molar ratio, concentration and type of catalyst were assessed. 1H NMR spectroscopy analysis allowed monitoring the reactions and provided fatty acid yields.
1. Introduction
Fatty acids (FA) are the main ingredients used in the synthesis of numerous chemicals with high added value, such as pharmaceuticals, cosmetics, surfactants, lubricants, plasticizers, paints, food additives, agricultural and personal care products.1,2 The catalytic hydrolysis of triglycerides (TG) present in animal fats or vegetable oils has been important in converting these renewable raw materials to FA.3,4Traditionally, the non-catalytic hydrolysis of TG has been performed using a fat splitting process, where superheated water reacts with oil under drastic reaction conditions (i.e., 373 to 533 K and 100 to 7000 kPa).5 Another industrial route utilized to produce FA is the Twitchell process carried out with stronger Brønsted acid at the boiling temperature of water.6 However, the main drawbacks are that homogenous catalysts are not reusable, the reaction time is great and is required a large amount of water.
Concurrent reactions at these conditions such as oxidation, degradation of FAs or interesterification of triglycerides, compromise the reaction selectivity.7,8 Enzymatic hydrolysis is more selective; however, it is a long-running operation, requiring 16 h to several days.9 Moreover, enzymatic catalysts are more expensive and unstable due to higher sensitivity reaction conditions such as pH variation, high temperature and type of solvent.9,10
Heteropolyacids (HPAs) are versatile solid acid catalysts which have been used on the development of clean technologies in replacement to the mineral acids homogeneous catalysts.11 HPAs are clusters belong to a special class of polyoxometalates, composed of several metals, non-metals and oxygen. Keggin HPAs such as silicotungstic (H4SiW12O40), phosphotungstic (H3PW12O40) and phosphomolybdic (H3PMo12O40) acids have been widely used as acid catalysts in various reactions to conversion processes of biomass to chemicals or fuels.12–15
Acrocomia aculeata (i.e., known as “macauba”) is a specie of native palm common in tropical and subtropical regions of the Americas.16,17 The macauba is considered one of the most conspicuous palm species abundant in the Brazil, it is easily adapted to the different ecosystems like degraded or intact areas.18–20 Macauba is nonedible crop, which cultivation is economically attractive due to its high oil yield (i.e., 6.2 tons of oil per ha, 16 times greater than soybean).21–23 This accredits the macauba oil as the major raw material to manufacturing biodiesel.
In this work, we have evaluated the catalytic activity of HPAs on the hydrolysis reaction of macauba oil under mild conditions of reaction (ca. 413 K temperature, autogenic pressure). The effects of main reaction variables such as temperature, oil![[thin space (1/6-em)]](https://www.rsc.org/images/entities/char_2009.gif) :
:![[thin space (1/6-em)]](https://www.rsc.org/images/entities/char_2009.gif) water molar ratio, nature and type of catalyst were assessed. Insights on the reaction mechanism to explain the different behavior of acid catalysts were proposed. 1H NMR spectroscopy was employed to determine the FA yields. The stability of HPAs throughout reaction was investigated.
water molar ratio, nature and type of catalyst were assessed. Insights on the reaction mechanism to explain the different behavior of acid catalysts were proposed. 1H NMR spectroscopy was employed to determine the FA yields. The stability of HPAs throughout reaction was investigated.
2. Experimental
2.1 Chemicals
All reagents and solvents were obtained from commercial sources and used without further purification. The crude macauba oil used in this work was provided by the company Agrotech Sementes Ltd. (Viçosa, Minas Gerais, Brazil). Sulfuric acid (98% wt) and methanol (99% wt) were Merck. Heteropolyacids H3PMo12O40, H3PW12O40 and H4SiW12O40 were purchased from Sigma-Aldrich (99.5% wt). Chloroform-d (998% wt) from Sigma Aldrich was used as a solvent for 1H NMR sample preparation.2.2 Characterization of vegetal oil
To obtain the chemical composition of macauba oil it was transesterified with methanol and converted to methyl fatty acid esters (FAMEs), which were analyzed in a gas chromatography with mass spectrometer detector (Shimadzu 2010 GC-MS equipment).Typically, macauba oil (ca. 1.0 g) reacted with CH3OH in presence of KOH catalyst (ca. 3% wt) for 2 h. At the end of the reaction, FAMEs were extracted with hexane, resulting in an organic phase that was dried with Na2SO4 and analyzed by GC-MS technique.
 | (1) |
| MW = [(3 × AMW) − 4] | (2) |
2.3 General procedure of HPA-catalyzed hydrolysis
Hydrolysis of vegetable oils was carried out adding an adequate acid catalyst (i.e., H2SO4, H3PW12O40, H3PMo12O40 or H4SiW12O40) in powdered form (ca. 15–35 mol% of H+) to a known quantity of vegetable oil (ca. 2.5 g) and water (molar ratio of oil![[thin space (1/6-em)]](https://www.rsc.org/images/entities/char_2009.gif) :
:![[thin space (1/6-em)]](https://www.rsc.org/images/entities/char_2009.gif) water = 1
water = 1![[thin space (1/6-em)]](https://www.rsc.org/images/entities/char_2009.gif) :
:![[thin space (1/6-em)]](https://www.rsc.org/images/entities/char_2009.gif) 30 to 1
30 to 1![[thin space (1/6-em)]](https://www.rsc.org/images/entities/char_2009.gif) :
:![[thin space (1/6-em)]](https://www.rsc.org/images/entities/char_2009.gif) 50) in a sealed tube (ca. 35 mL).
50) in a sealed tube (ca. 35 mL).
The mixture of reaction was heated to temperature ranging from 413 to 453 K during a period of 8 h. At the end of the reaction, the sealed tube was cooled to 298 K. The reaction produced two layers; an upper oily layer, consisting of free fatty acids, mono-, di and triglycerides, and an aqueous layer, containing water and glycerol. These layers were separated by decantation. A small amount of the upper phase was collected and analyzed by 1H NMR spectroscopy.
2.4 1H NMR analysis of samples resulting of acid-catalyzed hydrolysis reactions of macauba oil
Ratnasamy et al. have developed a methodology based on NMR spectroscopy to quantify FA and presence of TG.24 They have calculated the FA, the average molar weight (AMW) of methyl esters, and the molar weight (MW) of vegetal oil through eqn (1)–(3), respectively.
 | (3) |
To performing the measurements, an adequate amount of the sample collected at the end of the reaction (ca. 20–25 mg) was dissolved in CDCl3 (ca. 0.6 mL) and the 1H NMR spectrum was recorded at 298 K on a Mercury-300 MHz Varian Spectrometer; 30 scans for each sample were taken during the analysis. An acquisition time of 3.9 s, relaxation delay of 1 s, flip angle of 30°, and sweep width of 4.139 kHz were employed in the spectral measurements.
3. Results and discussion
3.1 1H NMR spectroscopy analysis of TG and FA
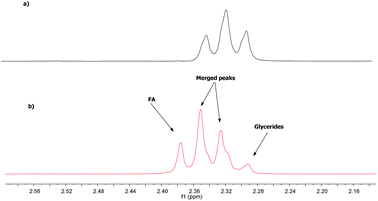
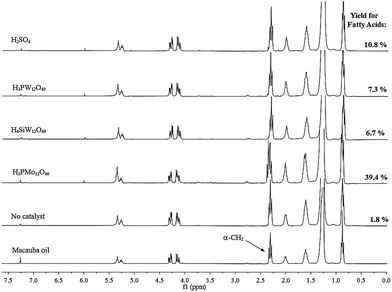
Quantification of the FA and glycerides in the vegetable oil through 1H NMR spectroscopy is based on the fact that α-CH2 peaks of FA appear at higher values than those of glycerides. This difference on the chemical shift is due to the lower shielding effect of the carboxylic acid group compared to the ester group.24Due to this shift, the most unshielded peak of the triplet referring to the hydrogen atoms of α-CH2 of the FA (2.38 ppm) lies outside the α-CH2 region of the ester, whereas the other two peaks (2.34 and 2.30 ppm, respectively) that are merged with those two of the glycerides at 2.35 and 2.31 ppm, respectively (Fig. 1).
The 1H NMR spectrum of a sample containing FA and glyceride reveals that in the α-CH2 region there is a signal with quartet pattern, with the intensity of the peaks depending on the relative concentrations of FA and glyceride (Fig. 1). The unmerged triplet peak of FA, appearing around 2.38 ppm (i.e., a triplet signal more outside than glycerides triplet signal); thus it can be used to determine the FA amount in the vegetable oil.
Therefore, it is necessary to multiply the area of glycerides triplet peak four times to having the total area corresponding to the triplet FA; this because the triplet peak appears with an intensity ratio of 1![[thin space (1/6-em)]](https://www.rsc.org/images/entities/char_2009.gif) :
:![[thin space (1/6-em)]](https://www.rsc.org/images/entities/char_2009.gif) 2
2![[thin space (1/6-em)]](https://www.rsc.org/images/entities/char_2009.gif) :
:![[thin space (1/6-em)]](https://www.rsc.org/images/entities/char_2009.gif) 1. The total area corresponding to α-CH2 of both FA and glyceride can be determined by integrating the spectral region from 2.27 to 2.40 ppm. The equation used for the calculation of the fatty acid content is described in Section 2.4.
1. The total area corresponding to α-CH2 of both FA and glyceride can be determined by integrating the spectral region from 2.27 to 2.40 ppm. The equation used for the calculation of the fatty acid content is described in Section 2.4.
3.2 FA profile of macauba oil
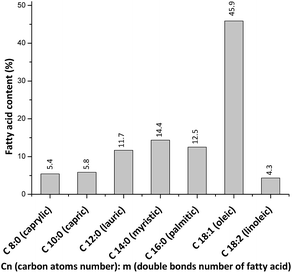
Fig. 2 shows the FA profile of macauba oil used in this work. Oleic acid predominates, followed by myristic, palmitic and lauric acids. These data are similar to the FA profiles of others macauba oils reported in the literature.16Using the chemical composition of macauba oil and eqn (1) and (2) (Section 2.2), it was possible calculate the average molar weight (AMW) of methyl esters (ca. 262 g mol−1) and molar weight (MW) of macauba oil (ca. 780 g mol−1).
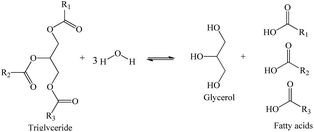
Hydrolysis of triglycerides is a reversible reaction that occurs in consecutive three-steps. In the first step, the triglyceride (TG) is converted into diglyceride (DG), which is then converted to a monoglyceride (MG). Thus, the stoichiometry between oil and water to convert one mole of triglyceride to 3 mol of FA and one of glycerol is 1![[thin space (1/6-em)]](https://www.rsc.org/images/entities/char_2009.gif) :
:![[thin space (1/6-em)]](https://www.rsc.org/images/entities/char_2009.gif) 3 (Scheme 1).
3 (Scheme 1).
3.3 Conventional mechanism for acid-catalyzed hydrolysis of triglycerides
Before considering yields of acid-catalyzed triglycerides hydrolysis reactions, seems profitable discuss the role of catalyst on these reactions. It is known that esters are slowly hydrolyzed because the water is a poor nucleophile. Moreover, esters are very basic leaving groups. Thus, the role of acid catalyst is protonating the oxygen atom of ester carbonyl group to promote this step. In the Scheme 2, we have described a mechanism involving steps commonly reported in literature.25 To simplify, only the formation of the first molecule of FA and the diglyceride are depict. We hope that this mechanism may be useful to rationalizing the results of reaction on the next sections. | ||
| Scheme 2 Mechanism proposed for the Brønsted acid-catalyzed ester hydrolysis (adapted from ref. 25). | ||
The first step (I) of the mechanism for acid-catalyzed ester hydrolysis is protonation of the carbonyl oxygen by the proton provided by the catalyst acid. In the step II of the mechanism, the nucleophile (H2O) attacks the protonated carbonyl group, which is more susceptible to this attack than non-protonated carbonyl groups. It can be explained because the positively charged oxygen atom is more electron withdrawing than a neutral oxygen atom.
The resulting protonated tetrahedral intermediate is in equilibrium with its non-protonated form (step III). In the step IV, the oxygen atom of ester group of TG is then protonated. The equilibriums showed in the steps III and IV describes an intermolecular rearrangement of proton (i.e., prototropism). On the last step, the tetrahedral intermediate collapses regenerating the H+ cation and resulting in the formation of the FA and diglyceride molecules.
Afterwards, the hydrolysis reaction proceeds through the same pathway; the diglyceride react with water resulting in the formation of FA and monoglyceride and, finally, this last one react with another water molecule generating the glycerol and FA molecules.
3.4 Assessing the acidity strength of catalysts
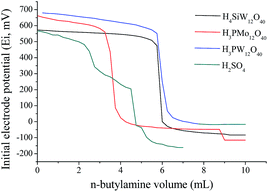
In almost of cases, the activity of acid catalysts is straight linked to acidic strength. Keggin heteropolyacids possess strong Brønsted acidity, higher than other solid acids such as zeolites, alumina or liquid mineral acids such as sulfuric acid.26,27 We have measured the acidity strength of catalysts in CH3CN through potentiometric titration with n-butylamine (Fig. 3).The initial electrode potential (Ei) allows to distinguish the acidity strength of protons as follow; Ei > 100 mV (very strong sites), 0 < Ei < 100 mV (strong sites), −100 < Ei < 0 (weak sites) and Ei < −100 mV (very weak sites).28 So, the values of (Ei) in Fig. 4 demonstrate that all the catalysts have very strong acidity. The measurement of the acid strength of catalysts in acetonitrile through titration with n-butylamine provided the following tendency: H3PW12O40 > H3PMo12O40 > H4SiW12O40 > H2SO4 (Fig. 3). This result is in agreement with literature.26,29
3.5 Effect of catalyst nature on the acid-catalyzed hydrolysis of macauba oil
The hydrolysis reactions of macauba oil were carried with or without catalyst with oil![[thin space (1/6-em)]](https://www.rsc.org/images/entities/char_2009.gif) :
:![[thin space (1/6-em)]](https://www.rsc.org/images/entities/char_2009.gif) water molar ratio of 1
water molar ratio of 1![[thin space (1/6-em)]](https://www.rsc.org/images/entities/char_2009.gif) :
:![[thin space (1/6-em)]](https://www.rsc.org/images/entities/char_2009.gif) 35, heating the reactor to 423 K temperature during 8 h of reaction. All the catalysts were used at ca. 25 mol% of H+ cations concentration. To calculating the FA yields, we performed 1H NMR spectroscopy analyses of samples collected at the end of reaction (Fig. 4).
35, heating the reactor to 423 K temperature during 8 h of reaction. All the catalysts were used at ca. 25 mol% of H+ cations concentration. To calculating the FA yields, we performed 1H NMR spectroscopy analyses of samples collected at the end of reaction (Fig. 4).
An excess of water could have shifted the reaction equilibrium toward products, however, this did not occurred because the catalyst-free reactions achieved only a poor FA yield (ca. 1.8%). When we analyzed the FA yields displayed in the Fig. 4, we realize that among catalysts assessed, the H3PMo12O40 have a remarkable activity, achieving highest FA yield (ca. 39.4%), while the others acidic catalysts had a behavior comparable reaching low FA yield; ca. 6.7% (H4SiW12O40) and 10.8%, (H3PMo12O40).
Based on the acidity strength of catalysts, we may hope that the activity of the catalysts on the hydrolysis reactions should follow a similar trend to that displayed in the Fig. 3 (i.e., H3PW12O40 > H3PMo12O40 > H4SiW12O40 > H2SO4). Nevertheless, since Ei values were not very different, it was expected only a little difference on the reaction yields.
Possibly, it could be true if the reactions happen in the oil phase. However, the hydrolysis occurs in a biphasic system (i.e. water/oil).
Therefore, there is another key aspect; the presence of the water results in a leveling effect on the acidic strength of catalysts. Indeed, in aqueous solutions all the protons of the HPAs catalysts and too the first one of sulfuric acid are completely dissociated and they should provide an equal H+ cations concentration.30 So, it is not guarantee that the catalysts performance will be too equal in a biphasic system.
As show in the Fig. 4, in the absence of acid the reaction virtually no occurs. On the other hand, the presence of catalyst the FA yield was greater, mainly for H3PMo12O40-catalyzed reaction. The highest catalytic activity of the H3PMo12O40 can be reasonably explained by visual observation done during the experiments. We found out that in the aqueous phase of the H3PMo12O40-catalyzed hydrolysis reaction of macauba oil, there was a noticeable change of coloration. The initial color of the solution changed of intense yellow at reaction beginning to a blue-green tonality. Moreover, the oil phase also assumed a dark green coloration. It is noteworthy that this apparent solubility of H3PMo12O40 on the oil phase only occurred at temperatures higher than 100 degrees.
The mechanism proposed in the Scheme 2, show that the role of catalyst consists in protonating the carbonyl group of TG, which is present on the non-polar layer. Therefore, seems reasonable to accept that the main steps of reaction should occur on the interface region between water and oil. Certainly, if the concentration of H3PMo12O40 or others acid species containing molybdenum is high throughout reaction on non-polar layer, as denoted by green coloration of oil phase, the hydrolysis reaction should be favored. So, the H3PMo12O40-catalyzed hydrolysis achieved the highest FA yield.
Although it may be inconvenient that the catalyst is soluble in the phase oil which contains the FA produced, we easily recovered the molybdenum HPA catalyst from oil phase when we cooled the system to room temperature. Immediately, it is precipitate in the bottom side of flask, or, if the aqueous layer is present, it migrates to the solution. This easy recovery of catalyst makes this biphasic reaction an environmentally friendly process.31
The high activity of H3PMo12O40 in the reactions performed in biphasic systems was previously reported by us, when we have investigated reactions of H3PMo12O40-catalyzed oxidative desulfurization in a biphasic system CH3CN/isooctane.32 On that system, we carried out the oxidation of thiophene to sulfoxide with hydrogen peroxide and verified that though in the absence of phase transfer catalyst, the H3PMo12O40 and its salt AlPMo12O40 were much more active than tungsten heteropolyacids.
3.6 Assessing the stability of H3PMo12O40 catalyst throughout the hydrolysis of macauba oil
It was known that many HPAs degrade to a mixture of polyoxometalates anions in aqueous solution when the pH value is increased. It was demonstrated that the hydrolytic stability of HPAs depends on the structure and composition of the anion, and of the pH values of the solution.33,34 To investigate if the acidity variation might is affecting the behavior of H3PMo12O40 during the reaction of hydrolysis, we measured the pH values of aqueous layer of reaction and their components before, during and after of the hydrolysis (Table 1).| Entry | Composition of the system | pH values of aqueous phaseb | Visual aspect of aqueous solution |
|---|---|---|---|
a Reaction conditions: macauba oil (ca. 1.27 g), oil![[thin space (1/6-em)]](https://www.rsc.org/images/entities/char_2009.gif) : :![[thin space (1/6-em)]](https://www.rsc.org/images/entities/char_2009.gif) water molar ratio (ca. 1 water molar ratio (ca. 1![[thin space (1/6-em)]](https://www.rsc.org/images/entities/char_2009.gif) : :![[thin space (1/6-em)]](https://www.rsc.org/images/entities/char_2009.gif) 35), catalyst concentration (ca. 25 mol% of H+ cations), temperature (ca. 423 K).b The measurements of pH values were done at room temperature. 35), catalyst concentration (ca. 25 mol% of H+ cations), temperature (ca. 423 K).b The measurements of pH values were done at room temperature. |
|||
| 1 | H3PMo12O40(aq) | 0.56 | Intense yellow |
| 2 | H3PMo12O40(aq) after heating to 423 K/30 min | 0.57 | Light green and formation of white solid |
| 3 | Macauba oil + H3PMo12O40(aq) before reaction | 0.56 | Intense yellow |
| 4 | Macauba oil + H3PMo12O40(aq) after the reaction/30 min | 0.74 | Dark green |
| 5 | Macauba oil + H3PMo12O40(aq) after the reaction/8 h | 1.1 | Dark green |
| 6 | Macauba oil + H3PW12O40(aq) before/and after the 8 h reaction | 0.8/0.7 | Colorless |
| 7 | Macauba oil + H4SiW12O40(aq) before/and after the 8 h reaction | 0.8/0.9 | Colorless |
We have found that heating the aqueous solution of H3PMo12O40 to 423 K resulted in the formation of white solid. The FT-IR spectrum of this solid displayed characteristic stretching band of ion phosphate (ca. 900 cm−1) and molybdate (ca. 600 and 1000 cm−1) anions suggesting that part or all the heteropolyanion was decomposed (Fig. 5a).35
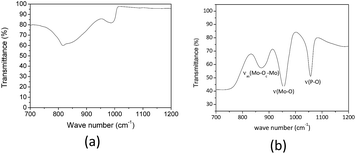 | ||
| Fig. 5 FT-IR of white solid obtained after heating the H3PMo12O40 aqueous solution to 423 K by 8 h and FT-IR of solid H3PMo12O40. | ||
Indeed, a comparison of finger print region of Keggin anion FT-IR spectrum (Fig. 5b) confirm that the main bands are absent (Fig. 5a).
It is noteworthy that the thermal stability of the Keggin heteropolyacids is very higher when they are solid than in the solution. The literature have demonstrated that the Keggin heteropolyanions begin to be decomposed at 673 K.27,29
The pH values of aqueous solutions of others HPAs catalysts were measured and revealed that no significance change was observed. Indeed, the literature describe that even that pH values had changed, H3PW12O40 and H4SiW12O40 are stable until values of pH equal to 5.36
Conversely, the change of coloration was an indicative that the H3PMo12O40 was being decomposed throughout the macauba oil hydrolysis reaction. This phenomenon may have been triggered by high reaction temperature of reaction, as demonstrated by comparison of entries 1 and 2, Table 2. Nonetheless, the variation on the pH values could also initiate the hydrolysis and the consequent decomposition of heteropolyanion.37
| Entry | Temperature (K) | Yield for fatty acidsb (%) | |
|---|---|---|---|
| 4 h | 8 h | ||
a Reaction conditions: macauba oil (ca. 1.27 g), oil![[thin space (1/6-em)]](https://www.rsc.org/images/entities/char_2009.gif) : :![[thin space (1/6-em)]](https://www.rsc.org/images/entities/char_2009.gif) water molar ratio (ca. 1 water molar ratio (ca. 1![[thin space (1/6-em)]](https://www.rsc.org/images/entities/char_2009.gif) : :![[thin space (1/6-em)]](https://www.rsc.org/images/entities/char_2009.gif) 35), catalyst concentration (ca. 25 mol% of H+ cations).b Determined by 1H NMR spectroscopy analysis. 35), catalyst concentration (ca. 25 mol% of H+ cations).b Determined by 1H NMR spectroscopy analysis. |
|||
| 1 | 413 | 11.0 | 35.2 |
| 2 | 423 | 12.0 | 39.4 |
| 3 | 433 | 39.0 | 54.2 |
| 4 | 443 | 49.0 | 68.2 |
| 5 | 453 | 43.0 | 63.5 |
Holclajtner-Antunovi et al. studied the stability of silicotungstic and phosphomolybdic acids in water at different pH values.36 They concluded that different of H4SiW12O40, that was stable between pH values of 1 to 7, the H3PMo12O40 underwent decomposition at pH values higher than 1.0. Those authors visually followed the change of the color of the H3PMo12O40 solutions, i.e., from the intense yellow through green to light blue at pH > 5.0. They have attributed the change of color to the hydrolytic decomposition of molybdenum. FT-IR, UV-Vis and 31P NMR spectroscopy analyses allowed identify all the species formed at different pH values.36
Thus, we suppose that the H3PMo12O40 catalyst was being converted into lacunar specie throughout the reaction, because the pH value measured was 1.1 after the end of reaction (Table 2).
The high hydrolytic trend of PMo12O403− compared to the others Keggin anion may be attributed the magnitude of charge on terminal oxygen atoms, which is higher when tungsten is the metal atom, and the lower binding energy between terminal oxygen atoms and molybdenum atom.38
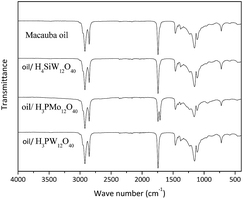
To verify if the Keggin anion of the HPAs are present in the oil phase, we carried out FT-IR spectroscopy analyses of samples collected at the end of the reactions, aiming identify the characteristics stretching bands of anions. The spectra are displayed in Fig. 6.
In general, the FT-IR spectra of type-Keggin HPAs have noticeable absorption bands at region of wavenumber between 700 and 1200 cm−1. For instance, the more stronger stretching bands of H3PMo12O40 are as follow: (νas(P–O) = 1055 cm−1, νas(Mo![[double bond, length as m-dash]](https://www.rsc.org/images/entities/char_e001.gif) O) = 955 cm−1, νas(Mo–O–Mo) = 890 cm−1, νas(Mo–O–Mo) = 760 cm−1) (Fig. 5b).36,37
O) = 955 cm−1, νas(Mo–O–Mo) = 890 cm−1, νas(Mo–O–Mo) = 760 cm−1) (Fig. 5b).36,37
The Fig. 6 shows that finger print region of HPAs infrared spectra did not provided any information about the presence of Keggin anion. The FT-IR spectra of the mixture containing macauba oil after reaction with all the H3PW12O40 or H4SiW12O40 displayed only one band at region of wavenumber 1750 cm−1, corresponding to asymmetric stretching of carbonyl group belonging to TG. Obviously, this band also was present in the pure oil layer.
On the other hand, the spectrum of the sample collected from H3PMo12O40-catalyzed hydrolysis reaction of macauba oil has two bands at this region; the same band present in the others spectra (i.e., νas(C![[double bond, length as m-dash]](https://www.rsc.org/images/entities/char_e001.gif) O) = 1750 cm−1) and a strong and well defined band around 1720 cm−1 due to asymmetric stretching of double bond of the carbonyl group of FA.
O) = 1750 cm−1) and a strong and well defined band around 1720 cm−1 due to asymmetric stretching of double bond of the carbonyl group of FA.
The macauba oil infrared spectrum display stronger absorption band at region of 1500 to 1000 cm−1 wave number, and another at 1750 cm−1, which might has overlapped the possible absorption bands of HPAs. Nonetheless, a thorough analysis of spectra reveals the absence of the bands at region around of 955 and 890 cm−1, which are typical stretching bands of Keggin anion. Therefore, their absence suggests that there are no Keggin anions in the oil phase after the reaction end. It was confirmed by change on the coloration of oil at the end of reaction, which return from green (i.e., during the reaction) to the initial color typical of oil (i.e., yellow). This change of color may be an indicative that molybdenum is being partially reduced.36–39
We believe that the formation of lacunar Keggin anion, which has a higher charge than anion Keggin present at the reaction beginning (i.e., conversion of PMo12O403− to lacunar anion PMo11O397−) (Fig. 7), could explain the partial solubility of molybdenum catalyst in the oil layer, evidenced by the change of color of oil phase during reaction (i.e., yellow to green, Table 1).
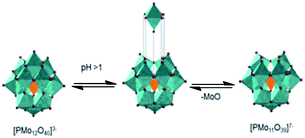 | ||
| Fig. 7 Hydrolytic decomposition of Keggin anion of PMo12O403− to lacunar anion PMo11O397− (adapted from ref. 40). | ||
So, these molybdenum heteropolyanion species with high negative charge may be more soluble in the interface oil/water, favoring the reaction of hydrolysis. Several reports have described that an increasing on the charge of Keggin anion may contribute to higher stabilization of positively charged intermediates due to increase on softness of anionic species.26,30,41 As depicted in the mechanism proposed in Scheme 2, in the course of the hydrolysis reaction there is the formation of various protonated intermediates, which could then react be stabilized by Keggin lacunar anion.
3.7 Effects of temperature on the acid-catalyzed hydrolysis of macauba oil
The hydrolysis of vegetable oils has been mainly difficult by the low solubility of oils in water. Thus, an alternative to minimize this limitation is to conduct such reaction at elevated temperatures. Nonetheless, it is always important that the catalyst should be stable and active at these temperatures. An increasing on reaction temperature might improve the water solubility in the oil layer and also favor the kinetics of the process. To assess this effect, we have performed the reactions with temperatures ranging of 413 to 443 K (Table 2).The FA yield improved with an increasing on the reaction temperature from 413 to 443 K. Notwithstanding, for temperatures higher than 443 K, no enhancement was observed. Contrariwise, there was a decrease on the FA yield on hydrolysis reactions carried out at 453 K temperature (entry 5, Table 2). This decreasing may be attributed the reverse esterification reaction of FA with glycerol could be too more significant at this temperature.
In general, in almost of TG hydrolysis reactions the FAs are the major goal and solid acids have been widely used. For instance, Satyarthi et al. assessed the hydrolysis of edible and nonedible vegetable oils over solid Fe–Zn double-metal cyanide complexes catalysts, and the yield of FAs were 9% wt, at temperature of 433 K and soybean oil![[thin space (1/6-em)]](https://www.rsc.org/images/entities/char_2009.gif) :
:![[thin space (1/6-em)]](https://www.rsc.org/images/entities/char_2009.gif) water molar ratio equal to 1
water molar ratio equal to 1![[thin space (1/6-em)]](https://www.rsc.org/images/entities/char_2009.gif) :
:![[thin space (1/6-em)]](https://www.rsc.org/images/entities/char_2009.gif) 30.42 Those authors achieved high FA yield (ca. 60–90%) only when worked at temperatures 463 K.
30.42 Those authors achieved high FA yield (ca. 60–90%) only when worked at temperatures 463 K.
In homogeneous phase, Meneghetti et al. have assessed the activity of tin(IV)-based compounds on hydrolysis of different vegetal oils.43 They found out that by using of reactions conditions conversions of ca. 97% to FA were obtained at 453 K, 4 h at oil![[thin space (1/6-em)]](https://www.rsc.org/images/entities/char_2009.gif) :
:![[thin space (1/6-em)]](https://www.rsc.org/images/entities/char_2009.gif) water
water![[thin space (1/6-em)]](https://www.rsc.org/images/entities/char_2009.gif) :
:![[thin space (1/6-em)]](https://www.rsc.org/images/entities/char_2009.gif) Sn(IV) catalyst a molar ratio of 1
Sn(IV) catalyst a molar ratio of 1![[thin space (1/6-em)]](https://www.rsc.org/images/entities/char_2009.gif) :
:![[thin space (1/6-em)]](https://www.rsc.org/images/entities/char_2009.gif) 24
24![[thin space (1/6-em)]](https://www.rsc.org/images/entities/char_2009.gif) :
:![[thin space (1/6-em)]](https://www.rsc.org/images/entities/char_2009.gif) 0.01 and, using soybean oil.
0.01 and, using soybean oil.
3.8 Effects of water![[thin space (1/6-em)]](https://www.rsc.org/images/entities/h3_char_2009.gif) :
:![[thin space (1/6-em)]](https://www.rsc.org/images/entities/h3_char_2009.gif) oil molar ratio on the acid-catalyzed hydrolysis of macauba oil
oil molar ratio on the acid-catalyzed hydrolysis of macauba oil
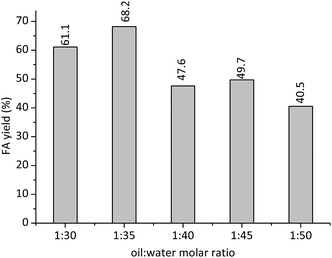
Another essential parameter for the hydrolysis of oils is the stoichiometric proportion between reactants (i.e., oil and water). Probably, the main reaction steps might occur in the interface between the water and oil. The greatest problem is that an increasing on water amount may be insufficient to shift the reaction equilibrium toward products. Therefore, the FA yield may be not proportional to the increasing on the water![[thin space (1/6-em)]](https://www.rsc.org/images/entities/char_2009.gif) :
:![[thin space (1/6-em)]](https://www.rsc.org/images/entities/char_2009.gif) oil molar ratio. The Fig. 8 presents the FA yields obtained in the H3PMo12O40-catalyzed reaction of macauba oil at different oil
oil molar ratio. The Fig. 8 presents the FA yields obtained in the H3PMo12O40-catalyzed reaction of macauba oil at different oil![[thin space (1/6-em)]](https://www.rsc.org/images/entities/char_2009.gif) :
:![[thin space (1/6-em)]](https://www.rsc.org/images/entities/char_2009.gif) water stoichiometric proportions.
water stoichiometric proportions.
For proportions of water![[thin space (1/6-em)]](https://www.rsc.org/images/entities/char_2009.gif) :
:![[thin space (1/6-em)]](https://www.rsc.org/images/entities/char_2009.gif) oil higher than 1
oil higher than 1![[thin space (1/6-em)]](https://www.rsc.org/images/entities/char_2009.gif) :
:![[thin space (1/6-em)]](https://www.rsc.org/images/entities/char_2009.gif) 35, the water excess may have reduced the efficiency of H+ cations in the protonation steps of TG. Consequently, the FA yields were lower at these reaction conditions.
35, the water excess may have reduced the efficiency of H+ cations in the protonation steps of TG. Consequently, the FA yields were lower at these reaction conditions.
Reactions of hydrolysis carried out over solid Fe–Zn complexes catalysts (10 mol%) achieved a FA yield of 67% wt, with soybean oil![[thin space (1/6-em)]](https://www.rsc.org/images/entities/char_2009.gif) :
:![[thin space (1/6-em)]](https://www.rsc.org/images/entities/char_2009.gif) water molar ratio equal to 1
water molar ratio equal to 1![[thin space (1/6-em)]](https://www.rsc.org/images/entities/char_2009.gif) :
:![[thin space (1/6-em)]](https://www.rsc.org/images/entities/char_2009.gif) 20. However, those authors carried out the reaction to 463 K.42
20. However, those authors carried out the reaction to 463 K.42
3.9 Effects of catalyst concentration on the H3PMo12O40-catalyzed hydrolysis of macauba oil
Although reactions yield that reach equilibrium are not affected by the variation on the catalyst concentration, it always important know what the lowest catalyst concentration provide the highest conversion at the shortest reaction time.The highest FA yield was reached at the 8 h of reaction when the H3PMo12O40 catalyst was used at H+ cation concentration equal or higher than to 25 mol%. So, no increasing on FA yield was achieved when the reaction was carried with higher catalysts loads within this period (Fig. 9).
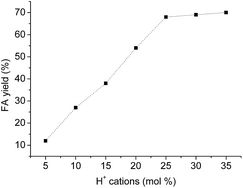 | ||
| Fig. 9 Effect of H3PMo12O40 concentration on the acid-catalyzed hydrolysis of macauba oil.a aReaction conditions: macauba oil (ca. 1.27 g), temperature (ca. 423 K), time (8 h). | ||
Satyarthi performed the hydrolysis of soybean oil (1![[thin space (1/6-em)]](https://www.rsc.org/images/entities/char_2009.gif) :
:![[thin space (1/6-em)]](https://www.rsc.org/images/entities/char_2009.gif) 20 molar ratio) in presence of sulfuric acid 100 mol%, and found that 92% of FA yields after 8 h of reaction to 463 K temperature.42 It is an evidence that superior performance of H3PMo12O40 catalyst over mineral acids.
20 molar ratio) in presence of sulfuric acid 100 mol%, and found that 92% of FA yields after 8 h of reaction to 463 K temperature.42 It is an evidence that superior performance of H3PMo12O40 catalyst over mineral acids.
4. Conclusions
Hydrolysis of macauba oil has been investigated over different heteropolyacid catalysts, in addition to the sulfuric acid. H3PMo12O40-catalyzed hydrolysis reactions exhibited the highest fatty acid yield. The largest novelty of this work is that we have finding that H3PMo12O40 heteropolyacid is a versatile catalyst able to migrating from the aqueous phase to the oil phase throughout the hydrolysis and then back to the initial phase at the end of reaction. Measurements of pH performed during the reaction showed that the pH achieve values able to hydrolyze the H3PMo12O40, converting it to a lacunar specie (i.e. PMo11O397−). This specie is this way more soluble that H3PMo12O40 itself, a fact seen by changes of coloration of oil phase. So, the interaction between protonate TG intermediate formed during the reaction and lacunar anion favor the FA yield. The same was not found to the other HPAs, which are more stable at reaction conditions studied.Acknowledgements
We are grateful to FAPEMIG, CNPq, and CAPES for financial support.References
- K. Ngaosuwan, E. Lotero, K. Suwannakaru, J. G. Goodwin Jr and P. Praserthdam, Ind. Eng. Chem. Res., 2009, 48, 4757 CrossRef CAS.
- F. D. Gustone and R. J. Hamilton, Oleochemical manufacture and applications, Sheffield Academic Press, Canada, 2001 Search PubMed.
- S. Al-Zuhair, M. Hasan and K. B. Ramachandran, Process Biochem., 2003, 38, 1155 CrossRef CAS.
- K. Wilson and A. F. Lee, Catal. Sci. Technol., 2012, 2, 884 CAS.
- T. A. Patil, D. N. Butala, T. S. Raghunathan and H. S. Shankar, Ind. Eng. Chem. Res., 1988, 27, 727 CrossRef CAS.
- L. Lascaray, J. Am. Chem. Soc., 1952, 29, 362 CAS.
- D. Rooney and L. R. Weatherley, Process Biochem., 2001, 36, 947 CrossRef CAS.
- S. Al-Zuhair, M. Hasan and K. B. Ramachandran, Process Biochem., 2003, 38, 1155 CrossRef CAS.
- S. Sharma, S. Gangal and A. Rauf, Ind. Crops Prod., 2009, 30, 325 CrossRef CAS.
- N. A. Serri, A. H. Kamarudin and S. N. A. Rahaman, J. Phys. Sci., 2008, 19, 79 CAS.
- L. Liu, B. Wang, Y. Du and A. Borgna, Appl. Catal., A, 2015, 489, 32 CrossRef CAS.
- A. Martin, U. Armbruster and H. Atia, Eur. J. Lipid Sci. Technol., 2012, 114, 10 CrossRef CAS.
- A. V. Inanov, E. Zausa, Y. Ben Taârit and N. Essayem, Appl. Catal., A, 2003, 256, 225 CrossRef.
- D. Varisli, T. Dogu and G. Dogu, Chem. Eng. Sci., 2007, 62, 5349 CrossRef CAS.
- J. Macht, R. T. Carr and E. Iglesia, J. Am. Chem. Soc., 2009, 131, 6554 CrossRef CAS PubMed.
- A. Henderson, G. Galeano and R. Bernal, Field Guide to the Palms of the Americas, Princeton University Press, Princeton, New Jersey, 1995 Search PubMed.
- G. Ciconinia, S. P. Favaroa, R. Roscoeb, C. H. B. Mirandac, C. F. Tapetia, M. A. M. Miyahiraa, L. Beararia, F. Galvanid, A. V. Borsatod, L. A. Colnagoe and M. H. Nakaa, Ind. Crops Prod., 2013, 45, 208 CrossRef.
- J. K. Satyarthi, T. Chiranjeevi, D. T. Gokak and P. S. Viswanathan, Catal. Sci. Technol., 2013, 3, 70 CAS.
- L. N. Silva, C. C. Cardoso and V. M. D. Pasa, Fuel, 2016, 166, 453 CrossRef CAS.
- A. O. Scariot, E. Lleras and J. D. Hay, Biotropica, 1995, 27, 168–173 CrossRef.
- E. C. M. Lanes, P. M. A. Costa and S. Y. Motoike, Nature, 2014, 511, 31 CrossRef PubMed.
- T. P. Pires, E. S. Souza, K. N. Kuki and S. Y. Motoike, Ind. Crops Prod., 2013, 44, 200 CrossRef CAS.
- C. Perego and M. Ricci, Catal. Sci. Technol., 2012, 2, 1776 CAS.
- J. K. Satyarthi, D. Srinivas and P. Ratnasamy, Energy Fuels, 2009, 23, 2273 CrossRef CAS.
- A. Vega-Rios, H. Villalobos and J. Mata-Segreda, Int. J. Chem. Kinet., 1992, 24, 887 CrossRef CAS.
- I. V. Kozhevnikov, Chem. Rev., 1998, 98, 171 CrossRef CAS PubMed.
- T. Okuhara, N. Mizuno and M. Misono, Adv. Catal., 1996, 41, 113 CAS.
- M. J. Da Silva, N. A. Liberto, L. C. A. Leles and U. A. Pereira, J. Mol. Catal. A: Chem., 2016, 422, 69 CrossRef.
- I. V. Kozhevnikov and K. I. Matveev, Appl. Catal., 1983, 5, 135 CrossRef CAS.
- M. N. Timofeeva, Appl. Catal., A, 2003, 256, 19–35 CrossRef CAS.
- Z. Hou and T. Okuhara, J. Chem. Soc., Chem. Commun., 2001, 1686 RSC.
- M. J. Silva and L. F. Santos, J. Appl. Chem., 2013, 1–7 CrossRef CAS.
- L.-K. Ren, H.-Q. Yang and C.-W. Hu, Catal. Sci. Technol., 2016, 6, 3776 CAS.
- J. Toufaily, M. Soulard, J. L. Guth, T. Hamieh and M. B. Fadlallah, J. Phys. IV, 2004, 113, 155 CAS.
- F. A. Miller and C. H. Wilkins, Anal. Chem., 1952, 24, 1253 CrossRef CAS.
- D. Bajuk-Bogdanovi, I. Holclajtner-Antunovi, M. Todorovi, U. B. Mio and J. Zakrzewska, J. Serb. Chem. Soc., 2008, 73, 197 CrossRef.
- G. B. McGarvey and J. B. Moffat, J. Mol. Catal., 1991, 69, 137 CrossRef CAS.
- Studies in Surface Catalysis, Keynotes in Energy-Related Catalysis, ed. S. Kaliaguine, Elsevier, Amsterdam, 1988, vol. 38 Search PubMed.
- B. Hamad, R. O. L. de Souza, G. Sapaly, M. G. C. Rocha, P. G. P. de Oliveira, W. A. Gonzalez, E. A. Sales and N. Essayem, Catal. Commun., 2008, 10, 92 CrossRef CAS.
- N. Narkhede, S. Singh and A. Patel, Green Chem., 2015, 17, 89 RSC.
- A. Jurgensen and J. Moffat, Catal. Lett., 1995, 34, 237 CrossRef.
- J. K. Satyarthi, D. Srinivas and P. Ratnasamy, Appl. Catal., A, 2011, 391, 427 CrossRef CAS.
- E. C. da Silva, P. R. Mendes, Y. C. Brito, M. R. Meneghetti and S. M. P. Meneghetti, Catal. Commun., 2016, 78, 7 CrossRef CAS.
| This journal is © The Royal Society of Chemistry 2017 |

