DOI:
10.1039/C6RA27219C
(Paper)
RSC Adv., 2017,
7, 16513-16523
Preparation of magnetic porous NiFe2O4/SiO2 composite xerogels for potential application in adsorption of Ce(IV) ions from aqueous solution
Received
23rd November 2016
, Accepted 5th March 2017
First published on 15th March 2017
Abstract
In this work, a novel magnetic porous adsorbent was prepared via a sol–gel method for the removal of Ce(IV) from aqueous solution. The NiFe2O4/SiO2 composite xerogels were characterized using SEM, BET, FT-IR, XPS, TEM, VSM and XRD. In addition, the effects of initial concentration, amounts of adsorbents, contact time, solution pH and temperature on the adsorption of Ce(IV) were investigated via batch adsorption studies. The results verify the formation of hierarchically porous structures with a specific surface area of 1085.3 m2 g−1. The adsorption capacity for Ce(IV) at 25 °C is 114.56 mg g−1 (91.65%), the adsorption of Ce(IV) onto the composite xerogels was better described by the pseudo-second-order kinetic model, and the data fit well with the Langmuir isotherm model. Thermodynamic parameters such as standard enthalpy (ΔH0), standard entropy (ΔS0) and standard free energy (ΔG0) indicated that the adsorption of Ce(IV) onto composite xerogels was spontaneous and endothermic within the temperature range of 278–338 K. Moreover, the adsorbents showed good performance and recycling ability and could be separated by applying a magnetic field.
1 Introduction
A large amount of spent fuel has been produced during the development and utilization of nuclear energy; the high-level liquid waste (HLLW) in this spent fuel contains diverse radionuclides with strong radioactivity and toxicity, such as Pu, Np, Tc, Sr and Cs. 239-Pu in the HLLW is one of the typical key species which has a long life (T1/2 = 241![[thin space (1/6-em)]](https://www.rsc.org/images/entities/char_2009.gif) 000 years), high toxicity (the maximum tolerance in human body is 0.65 × 10⁻⁶ g).1 Therefore, full, permanent isolation is needed, and how to carry on the safety disposal of high-level radioactive waste has become a worldwide problem.
000 years), high toxicity (the maximum tolerance in human body is 0.65 × 10⁻⁶ g).1 Therefore, full, permanent isolation is needed, and how to carry on the safety disposal of high-level radioactive waste has become a worldwide problem.
Some techniques such as solvent extraction,2,3 membrane separation,4,5 adsorption,6–10 and ion exchange11–13 have been reported for the separation of radionuclides. In contrast to other methods, adsorption has shown great promise for selective separation of Pu from HLLW, and finding an effective material to dispose of radioactive waste has become the research focus. There are varieties of adsorbents such as active carbon,14–16 carbon nano-tubes,17–19 zeolites,20–22 molecular sieves,23–25 ion-exchange membranes,26–28 and bio-adsorbents.29 Among all of these kinds of materials, silica xerogels with high specific surface area (500–1500 m2 g−1), pore volume (0.03–0.35 g cm−3), high porosity (80–99%) and plenty of silanol groups (Si–OH) distributed on the surface could be promising materials to use as effective adsorbents for radionuclides.30,31
In spite of the excellent performance of silica xerogels when used as adsorbents, there are also some drawbacks. First, the powdered silica xerogels with low density and light weight are hard to settle down, which brings difficulty of recycling and limits their applications as effective adsorbents.32 Second, the block ones show large mass transfer resistance that hinder the adsorbates from diffusing into adsorbents. In recent years, many researchers have synthesized magnetic composite silica xerogels and successfully solve these problems due to their unique advantage of easy separation under external magnetic field.33–36
Based on the above research, a novel composite porous xerogel via a simple sol–gel method has been fabricated. Combined with in situ synthesis of NiFe2O4 nanoparticles in SiO2 matrix, the magnetic NiFe2O4 nanoparticles facilitate the rapid separation of the adsorbent from aqueous solution by applying a magnetic field, and the hierarchical porous structures of SiO2 enhance the adsorption capacity by reducing the mass transfer resistance.37,38 Furthermore, the effects of parameters like temperature, reaction time, pH and initial concentration on the adsorption behavior of the composite magnetic xerogels were systematically studied, adsorption isotherms and kinetics models were investigated to explore the possible adsorption mechanism. Ce is used as the substitute for Pu and minor actinides, due to their similar charge, size and chemical property.39
2 Experiment
2.1 Reagents
The used chemicals in the experiments including nickel nitrate hexahydrate (Ni(NO3)2·6H2O), iron nitrate nonahydrate (Fe(NO3)3·9H2O), glycolic acid, aqueous solution of ammonia (25–28%), nitric acid aqueous solution (HNO3, 0.1 mol L−1) as catalyst and regeneration solution, tetraethoxysilane (TEOS), ethanol (C2H5OH) and deionized water. The solution of Ce(IV) ions used was prepared using deionized water, with ceric ammonium nitrate ((NH4)2Ce(NO3)6) as the source of Ce(IV). Analytical grade nitric acid (HNO3, 0.1 mol L−1) and sodium hydroxide (NaOH, 0.1 mol L−1) were used to adjust pH of the aqueous phases. All reagents were of analytical grade and were used without further purification.
2.2 Preparation of NiFe2O4/SiO2 composite xerogels
Certain amount of analytical grade PEG was dissolved in deionized water, then add 0.1 mol L−1 HNO3 until PEG completely dissolved and the solution was mixed with TEOS, after hydrolysis and condensation reaction of TEOS under stirring for 1 hour, the sol was formed.
Meanwhile, stoichiometric amounts of Ni(NO3)2·6H2O and Fe(NO3)3·9H2O were mixed in deionized water, the amounts of metal salts were taken according to the formula NiFe2O4. After that, appropriate amount of glycolic acid was added into the above prepared solution, the molar ratio of glycolic acid and metal ion was 2.5:1. At last, aqueous solution of ammonia was slowly added to the solution while stirring until the pH was between 7.5 and 8.5. The resultant solution was evaporated at 75 °C to remove redundant water. After evaporation for four hours, the sol was evaporated once again at 85 °C with stirring to gelatin.
After that, prepared metal ion gel was added into the SiO2 sol to get composite gel. Keep the composite gel aging under 40 °C for 1 day and the gel was solvent exchanged with anhydrous ethanol for 3 days before dried under 40 °C. At last, the dry gel was heat treated under 450 °C to obtain the magnetic composite xerogels.
2.3 Characterization
The micrograph and EDS elemental map was recorded by the scanning electron microscopy (SU-70) with an accelerating voltage of 3.0 kV. Fourier transform infrared spectra (FT-IR) were recorded in KBr pellets with a Nicolet 5700 spectrometer. X-ray photoelectron spectra (XPS) was performed using an electron spectrometer (ESCALAB-250Xi) with a monochromatized Al Kα radiation (hν = 1486.6 eV). The transmission electron microscopy (TEM) and high-resolution TEM (HRTEM) images for the micro-particles were obtained on Tecnai G2 F20 S-Twin. The X-ray diffraction (XRD) patterns of composite xerogels were obtained using a D-max RA diffractometer with Cu Kα radiation. The Brunauer–Emmet–Teller surface area (BET) was analyzed in an Autosorb-1-C nitrogen adsorption and desorption analyzer. Magnetization curves were measured by using a vibrating sample magnetometer (VSM 7407) at room temperature. The concentration of Ce(IV) ion was measured via Lambda 20 Spectrophotometer by obtaining the absorption spectra from 200 to 500 nm and inductively coupled plasma mass spectrometry (ICP-MS XSERIES).
2.4 Adsorption/desorption experiments
Batch adsorption experiments were carried out in a constant temperature shaker (SHA-C), 200 rpm. Aqueous solutions of Ce(IV) was prepared by dissolving (NH4)2Ce(NO3)6 in distilled water. Appropriate temperature (25–55 °C), Ce(IV) concentration (20–140 mg L−1, 25–200 ppb), adsorption time (0–80 h), pH (2–9) and adsorbent dosage (0.4–3 g L−1) were chosen to study the adsorption capacity. The pH of the solution was adjusted with HNO3 or NaOH solution to the desired values. For kinetic studies, the experiments were conducted by taking samples at desired time intervals with 100 mg L−1 Ce(IV) solution at different temperatures. For adsorption isotherm study, experiments were conducted with adsorbents dosage of 0.8 g L−1 under different initial concentration of Ce(IV). For thermodynamic study, adsorption experiments were carried out with the initial Ce(IV) concentration of 100 mg L−1 at different temperatures. The absorbance of standard Ce(IV) solutions with different concentration was examined to obtain the standard curve of Ce(IV) solution. And the concentration of the Ce(IV) solutions was calculated according to the standard curve.
The adsorption capacity and removal efficiency of the magnetic porous composite xerogels for Ce(IV) can be calculated from eqn (1) and (2), respectively:40
| |
 | (1) |
| |
 | (2) |
where
q is adsorption capacity (mg g
−1);
C0 and
C are the concentration of Ce(
IV) solution at original and a certain time (mg L
−1), respectively;
m is the weight of the adsorbents (g);
V is the volume of the solution (mL).
To evaluate the reversibility of Ce(IV) adsorption onto composite xerogels, 0.04 g composite xerogels were added into 50 mL of regeneration solution (0.1 mol L−1 HNO3). Desorption experiments were conducted at 35 °C and 200 rpm for 12 h to ensure the achievement of desorption equilibrium. After that, the composite xerogels were washed with distilled water for about 3 times until the pH reached neutral. Then dry the composite xerogels before next round of adsorption experiment. The adsorption/desorption process was repeated for 4 times.
3 Results and discussion
3.1 Structure and morphology of magnetic porous NiFe2O4/SiO2 composite xerogels
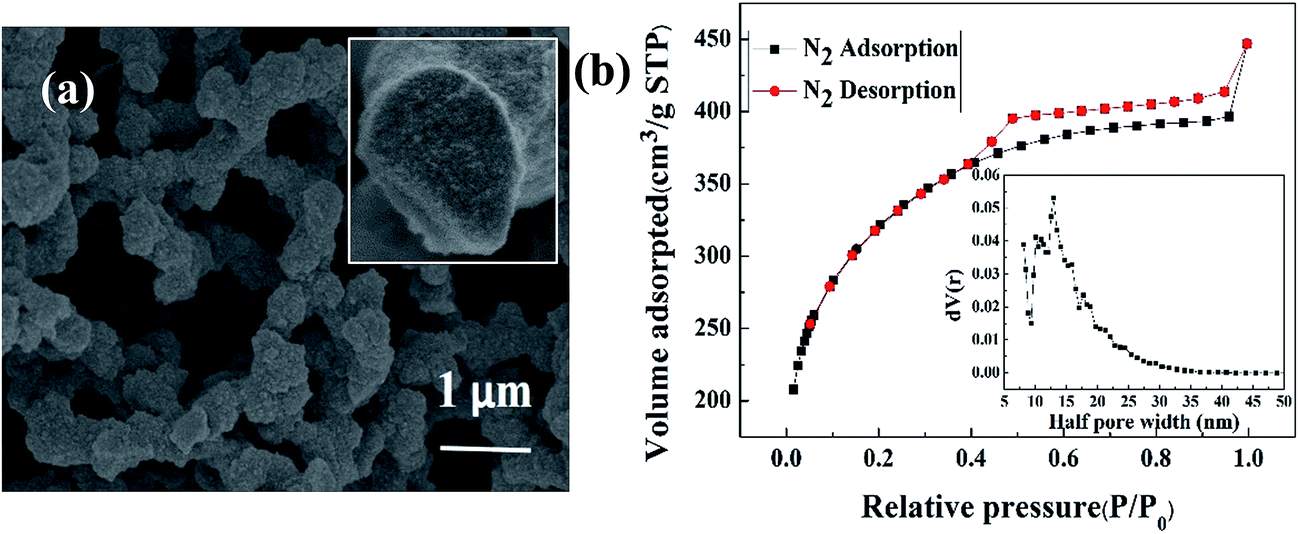
Fig. 1(a) shows the SEM image of magnetic porous NiFe2O4/SiO2 composite xerogels with heat treated at 450 °C. The composite xerogels were composed of particles aggregated into a three-dimensional cross-linked skeleton, aggregation of nanoparticles formed the mesoporous structure, and the three dimensional connected skeleton formed the double continuous pore structure with a pore size of about 1 μm. Brunauer–Emmett–Teller (BET) measurements were performed to inspect the specific surface, and nonlocal density functional theory (NLDFT) model was used to study the pore size distribution of the sample. Fig. 1(b) shows the nitrogen adsorption–desorption isotherm of heat-treated silica xerogels and the pore size distribution curve calculated from the isotherm. BET analysis indicates that the specific surface area of the sample is 1085.3 m2 g−1, the NLDFT pore size distribution curve shows that most pores in this sample are sized at about 25.84 nm, and the isotherm exhibits a type IV adsorption–desorption curve, the hysteresis loop of the isotherm in Fig. 2(b) belongs to type H2 attributes to mesopores due to the aggregation of nanoparticles with ill-defined shape and pore size distribution.41,42 And the adsorption curve shows the trend of going up at high relative pressure (P/P0 > 0.9), confirms the existence of macropore structures. The above results suggest that there are both double continuous macropores (∼1 μm) and mesopores (∼25.84 nm) in the skeleton, verify the formation of hierarchically porous structures, which contribute to the high specific surface area, facilitate the diffusion of Ce(IV) and improve the adsorption ability of the sample.
 |
| | Fig. 1 (a) SEM image and (b) N2 adsorption–desorption isotherm and pore size distribution of NiFe2O4/SiO2 composite xerogels with heat treatment at 450 °C. | |
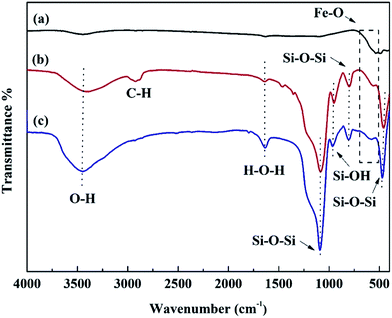 |
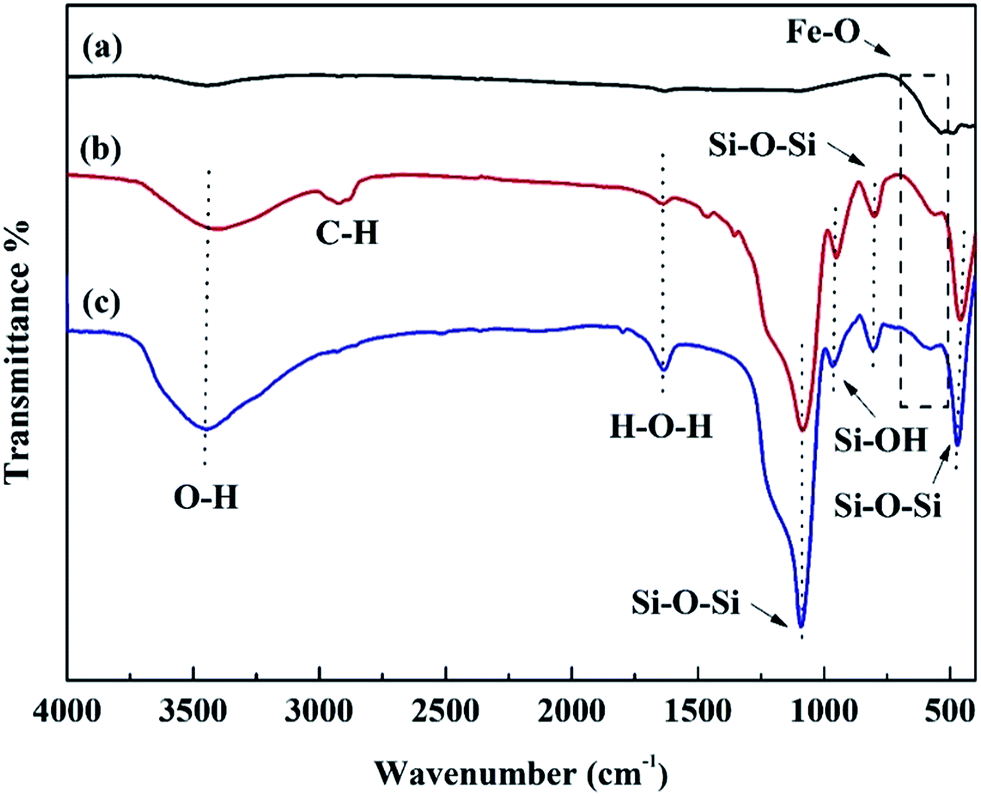
| | Fig. 2 FT-IR spectra of NiFe2O4 (a), SiO2 (b), NiFe2O4/SiO2 composite xerogels (c). | |
The FT-IR spectrum of NiFe2O4, SiO2 and NiFe2O4/SiO2 composite xerogels are displayed in Fig. 2. FT-IR spectra of NiFe2O4 show two absorption bands at ∼400 and ∼600 cm−1, which correspond to the octahedral and tetrahedral sites of positive ions (Fe3+, Ni2+) for spinel-type structure.42 For the pure SiO2, the adsorption peaks at 467, 807, 1090, and 956 cm−1 correspond to the symmetric and anti-symmetric stretching vibration of the Si–O–Si bond and the bending vibration of Si–OH bond, respectively. The bands at ∼2918 and 1640, 3400 cm−1 represent the C–H stretching vibration (due to the residual organic matter such as PEG in the pore structure) and hydroxyl group vibration. Furthermore, for the spectra of NiFe2O4/SiO2 composite xerogels, C–H band disappears due to heating decomposition under 450 °C, the intensity of the Si–OH adsorption peak at 956 cm−1 decreases after the formation of NiFe2O4/SiO2 composite xerogels, and the absorption band at ∼580 cm−1 increases compared with that of SiO2, which confirms that the Si–OH groups react with Fe–OH groups because of –OH condensation.33
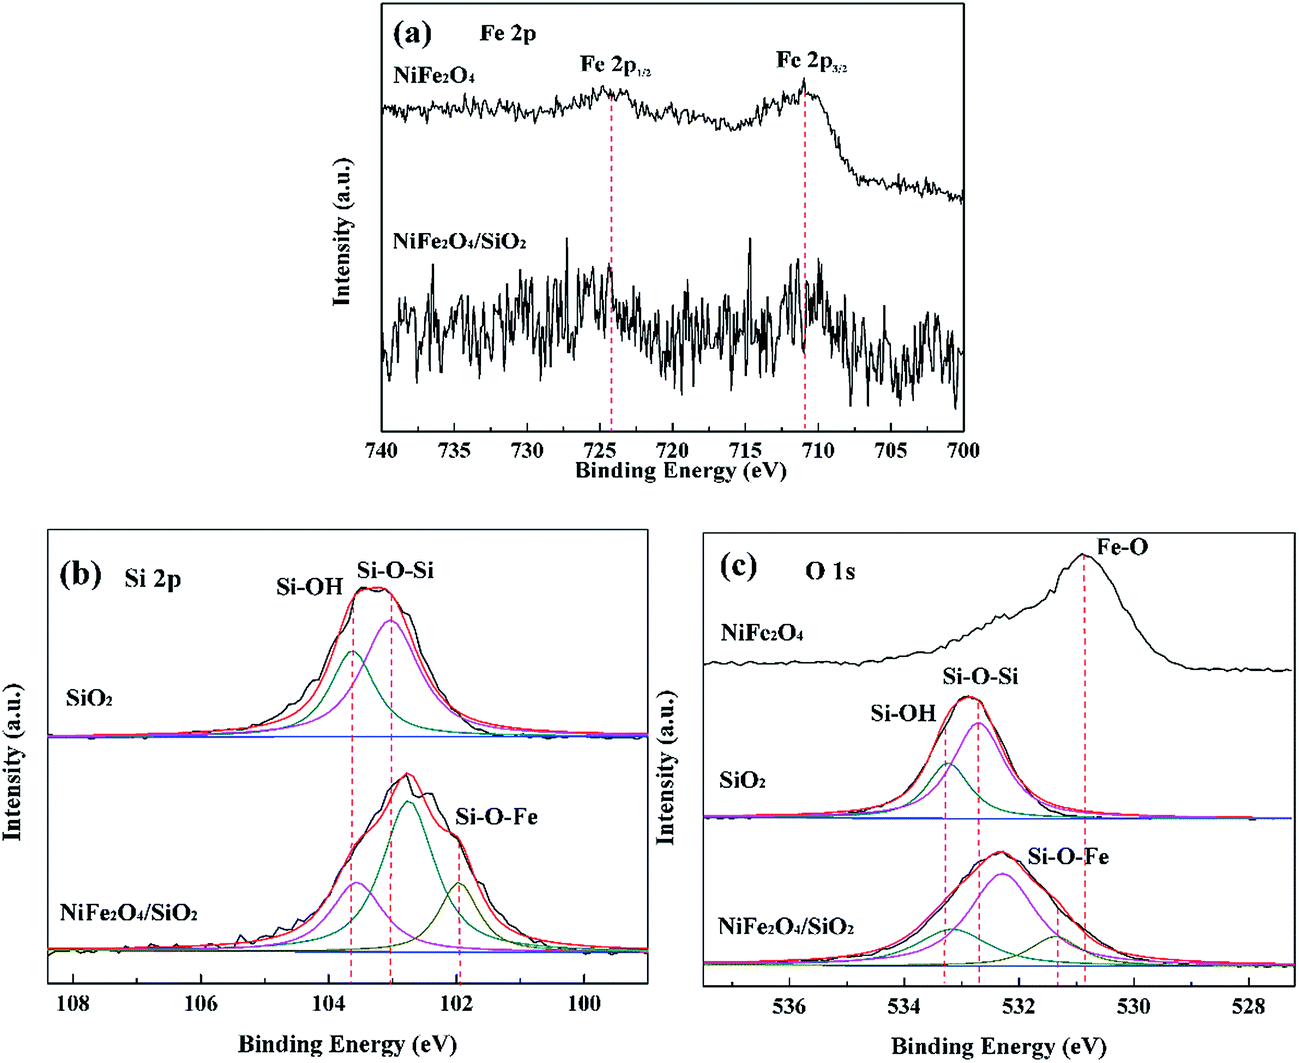
The existing interactions of SiO2 and NiFe2O4 can be further confirmed by high-resolution XPS analysis. As shown in Fig. 3(a), the determined binding energies of Fe 2p1/2 and Fe 2p3/2 are 724.2 and 711.1 eV, respectively, which indicates the inverse cubic spinel phase of NiFe2O4, while the observed XPS peaks originated from Fe 2p atomic orbit decrease a lot in NiFe2O4/SiO2 composite xerogels since the NiFe2O4 spinels were embedded in silica skeleton. As shown in Fig. 3(b), the Si 2p peaks at 103.1 and 103.6 eV are typically assigned to the O–Si–O and S–OH groups in SiO2. After the formation of the NiFe2O4/SiO2 composite xerogels, the peak originating from the Si–OH group is weakened, and the peak attributes to the Si–O–Fe group appears, the peak attributed to the Si–OH group shifts to a lower banding energy direction because of –OH condensation and the pull electronic effect of Fe atoms. Which indicates that the Fe–OH groups of NiFe2O4 precursor gels interacted with Si–OH groups within SiO2 to form Fe–O–Si covalent bonds in their interface. For Fig. 3(c), the O 1s peaks centered at 533.3, 532.7 and 531.3 eV are assigned to the Si–OH, Si–O–Si, and Fe–O groups, respectively, the formation of Fe–O–Si covalent bonds decreased the O 1s peak that corresponds to Si–OH. The Fe–O–Si covalent bonds between SiO2 and NiFe2O4 spinels increase the intensity of skeleton, and ensure the stability of composite xerogels in the recycling process.
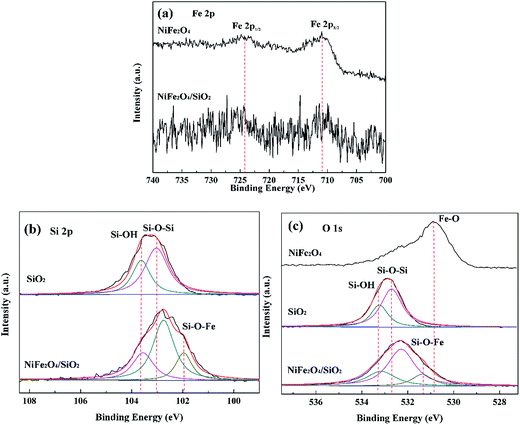 |
| | Fig. 3 High-resolution XPS of NiFe2O4, SiO2, NiFe2O4/SiO2 composite xerogels in the Fe 2p (a), Si 2p, (b), O 1s and (c), binding energy regions. | |
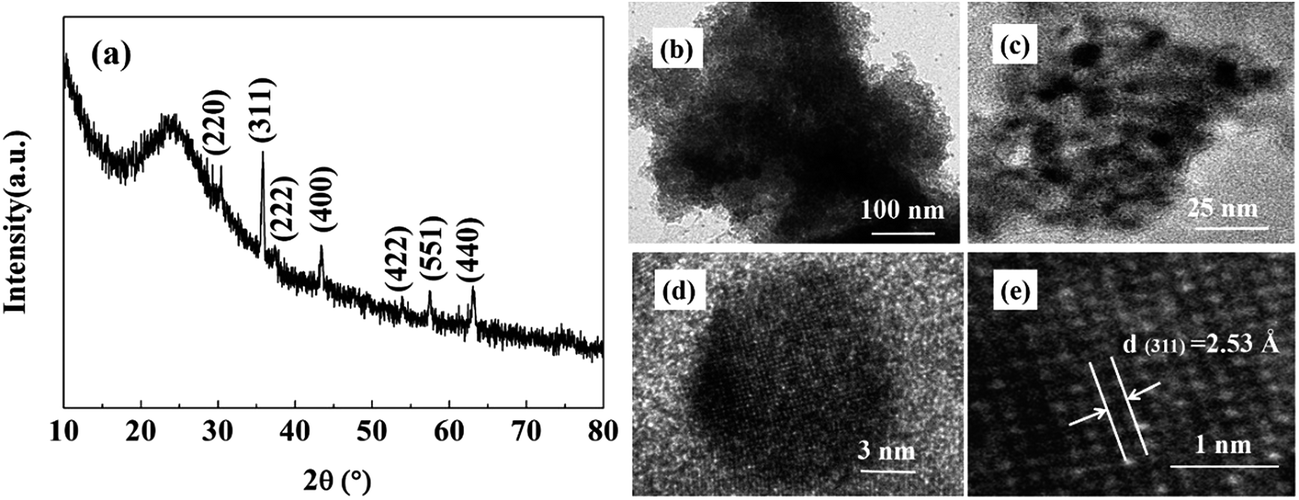
XRD pattern of magnetic porous NiFe2O4/SiO2 composite xerogels is shown in Fig. 4(a), which confirms the formation of NiFe2O4 with heat treatment at 450 °C for 2 hours. As illustrated in the image, all the diffraction peaks can be indexed to be the spinel phase NiFe2O443 and no peaks corresponding to the SiO2 phase are detected, indicated that the silicon oxide is amorphous. The porous nature of sample can be further confirmed by the TEM image. As is shown in Fig. 4(b), the matrix is formed with mesoporous SiO2, with a pore size of about a few nanometers. It can be seen in Fig. 4(b) that the NiFe2O4 nanoparticles are uniformly distributed in the SiO2 matrix, and with a particle size of about 10 nm. Fig. 4(c) is a typical HRTEM image of sample, showing a crystalline particle of about 10 nm in diameter embedded in the amorphous SiO2. And Fig. 4(e) is the local amplification picture with clear lattice fringe, the lattice spacing is determined to be 2.53 Å which corresponds to the lattice distance of the (311) plane.
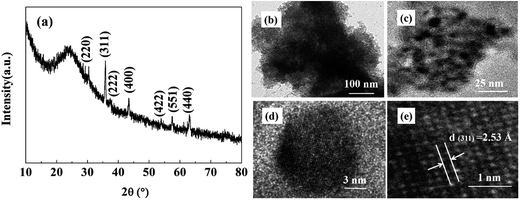 |
| | Fig. 4 (a) X-ray diffraction pattern of composite xerogels with heat treatment at 450 °C; (b and c) TEM images and (d and e) HRTEM images of composite xerogels with heat treatment at 450 °C. | |
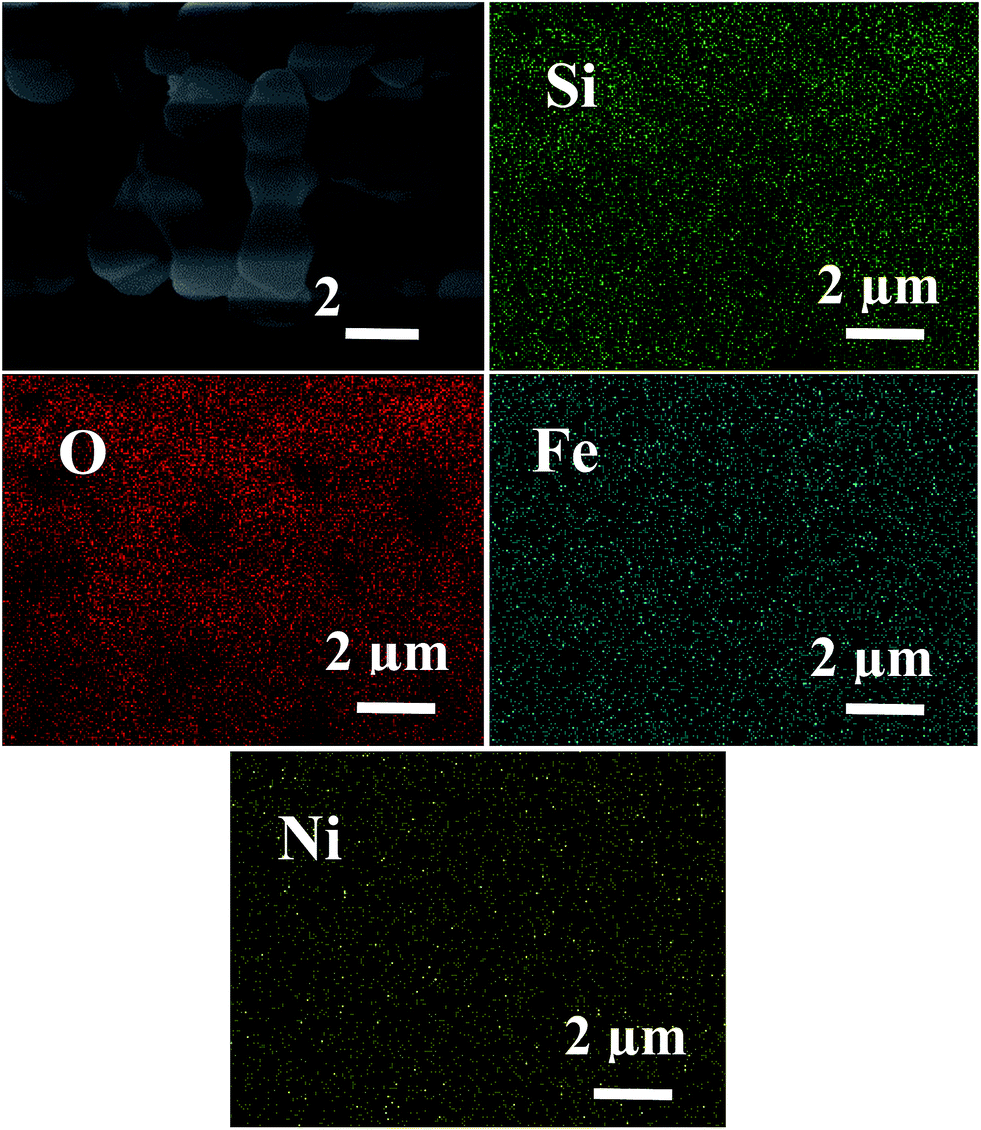
A representative SEM image of composite xerogels and EDS mapping images corresponding to the elemental distribution of Si, O, Fe and Ni are shown in Fig. 5. All the elements of Si, O, Fe and Ni are detected and mapping images show that content of Si and O are relatively high, which form the SiO2 skeleton of composite xerogels, and Fe, Ni evenly disperse in the mapping area. It can be concluded that the NiFe2O4 particles distribute uniformly in silica matrix.
 |
| | Fig. 5 SEM and corresponding EDS mapping results of composite xerogels. | |
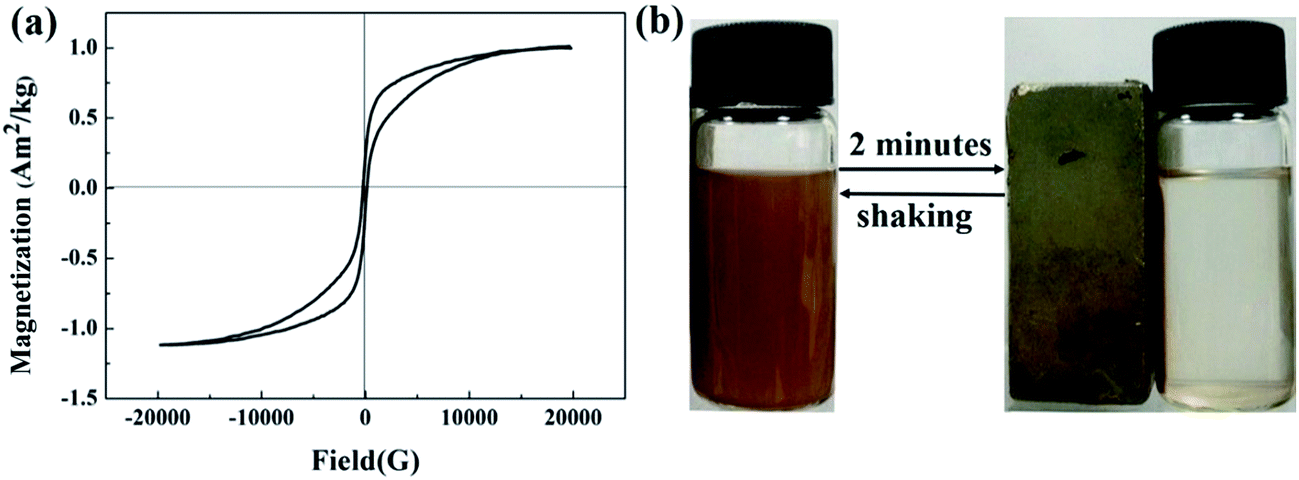
The room-temperature magnetization curve recorded with the magnetic field sweeping from −20000 to 20000 G. Fig. 6(a) shows that the saturation magnetization value of composite xerogels is 1.06 A m2 kg, which can be adjusted by controlling the synthesis parameters. It can be seen in Fig. 6(b) that the as-prepared composite xerogels can be separated from water by application of an external magnetic field in about 2 minutes.
 |
| | Fig. 6 Magnetic properties of composite xerogels: (a) room temperature magnetization curve, and (b) separation from solution under an external magnetic field. | |
3.2 Formation mechanism of NiFe2O4/SiO2 composite xerogels
The formation mechanism of NiFe2O4/SiO2 composite xerogels is shown in Scheme 1. According to the above analyses, the preparation process can be described as follow: first, the glycolic acid reacts with Ni2+, Fe3+ ions to form the precursor gel through hydrolysis and condensation (Scheme 1b). Then the precursor gel is mixed with the silica sol (Scheme 1a) hydrolyzed from TEOS (Scheme 1c), and the gelation happens after stirring the mixture (Scheme 1d), the Si–OH reacts with Fe–OH to form Si–O–Fe due to –OH condensation during this period. After that, the pore structure is formed after water (product of condensation reaction) in the skeleton being evaporated through drying. Finally, the spinel structure of magnetic nanoparticles formed in the silica skeleton after heat treatment.
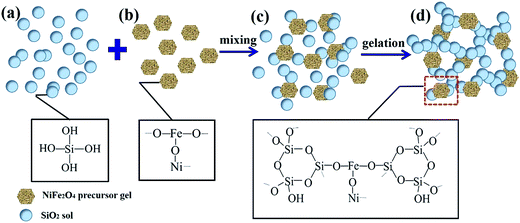 |
| | Scheme 1 Formation mechanism of NiFe2O4/SiO2 composite xerogels. | |
3.3 Effect factors of Ce(IV) adsorption
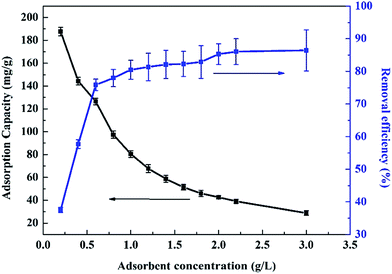
3.3.1 Effect of composite magnetic xerogels dosage. Effect of adsorbent dosage for the removal of Ce(IV) from water is shown in Fig. 7. Experimental results indicate that the removal percentage of Ce(IV) increases from 39.10% to 86.03% when the adsorbent dosage rises from 0.02 g to 0.15 g in 50 mL of Ce(IV) solution, which attributes to the increasing of active sites on the surface of adsorbents, so that Ce(IV) ions can easily penetrate into the adsorption sites. In contrast to the adsorption efficiency, adsorption capacity decreases significantly with increasing the adsorbent dosage, which is due to the active adsorption sites on the surface of adsorbents cannot be used efficiently and leads to the waste of adsorbents.
 |
| | Fig. 7 Effect of composite magnetic xerogels dosage on the equilibrium adsorption efficiency. | |
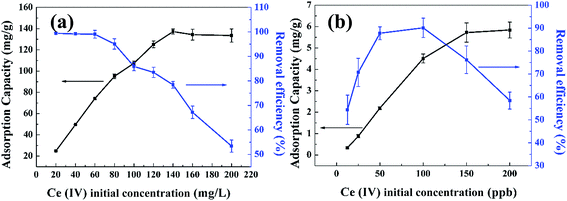
3.3.2 Effect of initial concentration. To investigate the effect of initial Ce(IV) concentration on the adsorption process, experiments were conducted with adsorbent dosage of 0.04 g and contact time of 72 h, the results are presented in Fig. 8(a). It is clear that the adsorption capacity increases when the initial concentration rises from 20 to 140 mg L−1, and the adsorption capacity slightly decreases when the initial Ce(IV) concentration is over 140 mg L−1. While the removal efficiency decreases with the increasing of initial Ce(IV) concentration, this may due to the active adsorption sites approach saturation at higher Ce(IV) concentration.
 |
| | Fig. 8 Effect of initial concentration on removal efficiency and adsorption capacity of Ce(IV). | |
The concentration of radionuclide in HLLW sometimes is actually very low, usually about one to several hundred ppb, it's necessary to investigate the Ce(IV) adsorption of composite xerogels under very low concentration. Experiments were conducted with adsorbent dosage of 0.001 g and contact time of 72 h, the initial concentration of Ce(IV) ranges from 25 to 200 ppb, the concentration of Ce(IV) ion was measured via inductively coupled plasma mass spectrometry (ICP). Results are shown in Fig. 8(b), the adsorption capacity of Ce(IV) onto composite xerogels increases as the initial concentration increases from 25–200 ppb, the removal efficiency rises as the concentration of Ce(IV) increases, and then falls down after reaching the peak (90.12%, 100 ppb), which indicates that the composite xerogels show the best adsorption performance when the initial concentration of Ce(IV) is 100 ppb.
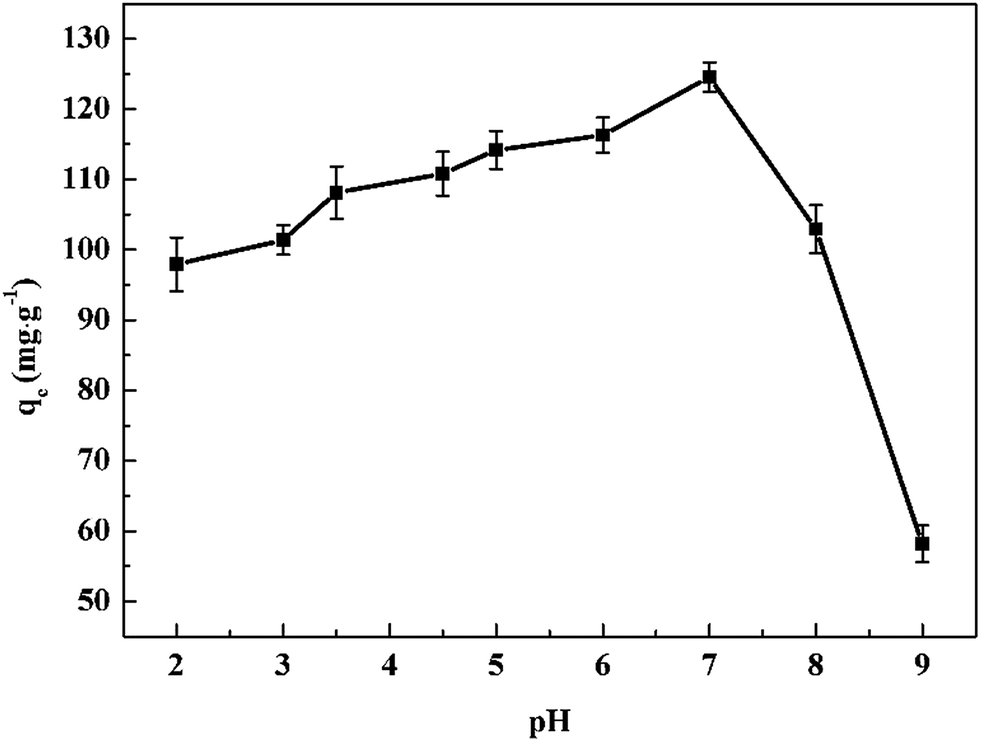
3.3.3 Effect of pH. The initial pH of the solution is an important factor which greatly affects the adsorption capacity of adsorbents.44 In this work, HNO3 (0.1 mol L−1) and NaOH (0.1 mol L−1) were used to adjust the pH of Ce(IV) solution. The influence of pH on the adsorption capacity of composite xerogels is shown in Fig. 9, which demonstrates that the adsorption capacity of composite xerogels is strongly affected by pH values. The adsorption curve of Ce(IV) onto composite xerogels can be divided into two regions. In the first region (pH = 2–7), the adsorption capacity of Ce(IV) increases when the pH increases, in the second region (pH = 7–9), the adsorption capacity decreases sharply along with the increasing of pH. This is due to the surface of composite xerogels and the Ce(IV) ions are positive charged when the pH is low, so that an electrostatic repulsion force exists between the Ce(IV) and composite xerogels under this situation, which prevents the Ce(IV) from contacting with adsorbent.45 And large amounts of H+ in solution may contribute to the competitive adsorption against Ce(IV).46 This can be improved by increasing the pH of solution to make composite xerogels less positive charged and decrease the amounts of H+, which will facilitate the adsorption of Ce(IV) onto composite xerogels. The adsorption capacity of composite xerogels reaches maximum under neutral condition. Keeping increase the pH until the solution alkaline, the surface of composite xerogels and Ce(IV) are both negative charged,47 thus, an electrostatic repulsion appears again to stop composite xerogels from adsorbing Ce(IV).
 |
| | Fig. 9 Effect of solution pH on the adsorption capacity of composite xerogels. | |
3.4 Adsorption kinetics
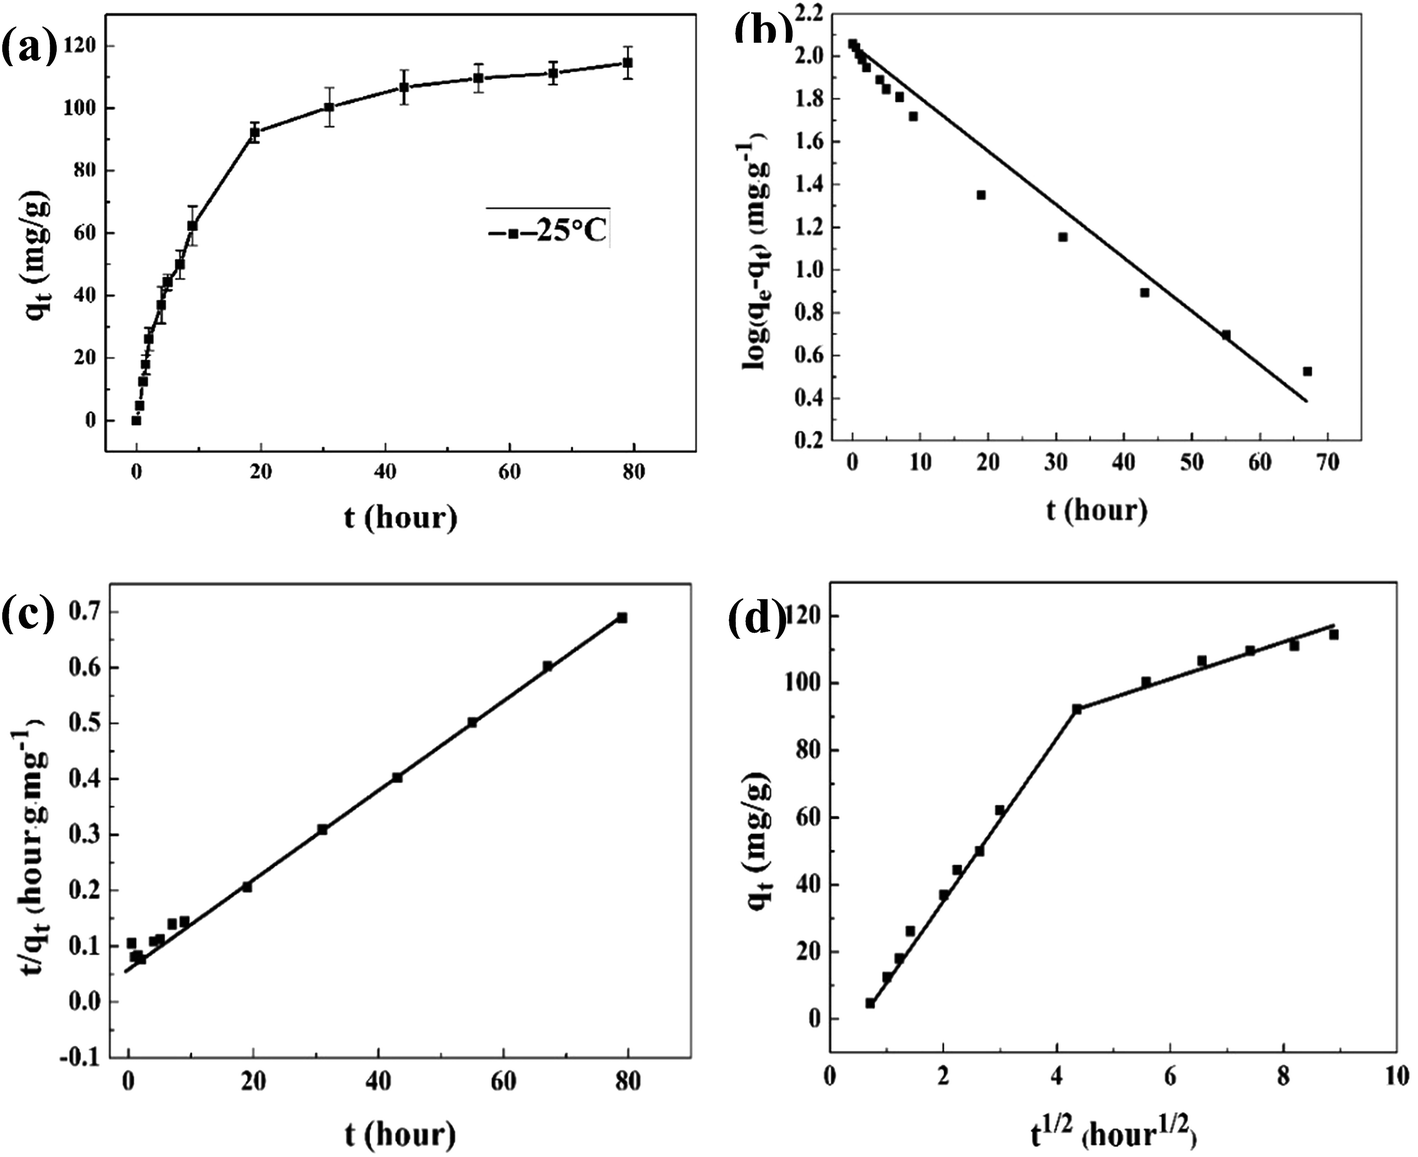
Adsorption kinetic study is important in the treatment of HLLW as it provides valuable information on the mechanism of adsorption reactions.48 As shown in Fig. 10(a), the maximum adsorption capacity (adsorption efficiency) of composite xerogels for Ce(IV) reaches 114.56 mg g−1 (91.65%), the Ce(IV) uptake increases rapidly in the first 20 hours, and almost 73.6% of Ce(IV) can be removed. Then the adsorption curve reaches equilibrium stage. The faster initial adsorption rate due to the existence of active sites available for Ce(IV) ions binding. The adsorption rate slows down with the increasing of contact time, this is because of the vacant active sites are occupied and formation of repulsive forces between Ce(IV) ions in the liquid phase and the adsorbent surface.49
 |
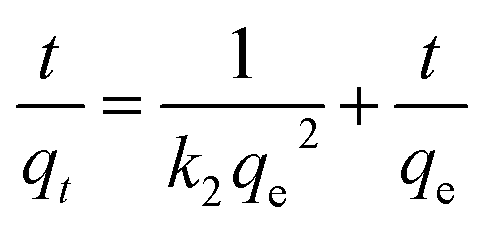
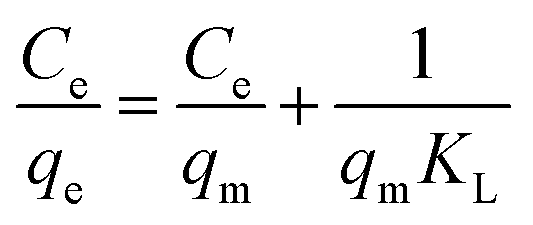
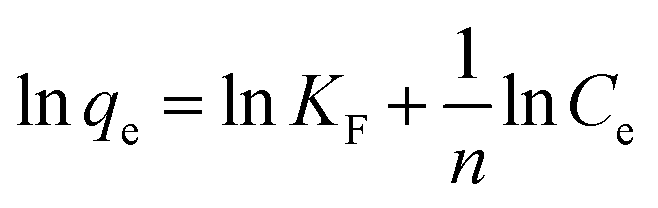
| | Fig. 10 (a) Adsorption of Ce(IV) onto composite xerogels as a function of time. T = 298.15 K, pH = 6.0; (b) plot of log(qe − qt) versus t for adsorption of Ce(IV) onto composite xerogels by using the pseudo-first-order kinetic model; (c) plot of t/qt versus t for adsorption of Ce(IV) onto composite xerogels by using the pseudo-second-order kinetic model; (d) plot of qt versus t1/2 for adsorption of Ce(IV) onto composite xerogels. | |
Pseudo-first-order and pseudo-second-order are used to the experimental data to investigate the controlling mechanism of Ce(IV) adsorption onto composite xerogels, and the linear form of their rate equations are represented as follows:50
Pseudo-first-order:
| | |
ln(qe − q) = −k1t + lnCe
| (3) |
Pseudo-second-order:
| |
 | (4) |
where
qe (mg g
−1) and
qt (mg g
−1) are the metal ion uptake per unit weight of adsorbent (mg g
−1) at equilibrium and metal ion uptake per unit weight of adsorbent (mg g
−1) at time
t (hour), respectively.
k1 (hour) and
k2 (g per mg per hour) are the rate constant of pseudo first order and second order respectively. The obtained value of slope and intercept were utilized for determination of
k1, and
k2.
Fig. 10(b) shows the plot of log(qe − qt) versus t, the correlation coefficient, calculated by pseudo-first-order model is relatively poor (R2 = 0.976), and Fig. 8(c) shows the plot of t/qt versus t at 25 °C, the obtained value for the correlation coefficient (R2) is 0.997, which indicates that adsorption kinetics of Ce(IV) agrees with the pseudo second-order equation. The pseudo-second-order kinetic model is generally applied to heterogeneous systems,51 and the adsorption is attributed to chemical adsorption involving valence forces through the sharing or exchange of electrons between the adsorbent (mainly Si–OH groups on the surface of adsorbent) and the adsorbate (Ce(IV) ions). The equation for the ion exchange reaction was considered might be expressed as:52
| |
![[triple bond, length as m-dash]](https://www.rsc.org/images/entities/char_e002.gif) Si–OH + Ce(H2O)y4+ ⇌ Si–O–Ce(H2O)(y−n)(4−q)+ + qH+ + nH2O Si–OH + Ce(H2O)y4+ ⇌ Si–O–Ce(H2O)(y−n)(4−q)+ + qH+ + nH2O
| (5) |
To explore the adsorption diffusion mechanism, the adsorption process is analyzed using the intra-particle diffusion model:53
where
ki is the intra-particle diffusion rate constant and
C is a constant. As shown in
Fig. 10(d), the whole adsorption process is composed of two stages, the initial linear portion is a surface diffusion adsorption stage, and the second corresponds to an intra-particle diffusion of Ce(
IV) through the pore of adsorbent, none of these two stages pass through the origin, which indicates that both surface diffusion adsorption and intra-particle diffusion involved in the adsorption process, and the whole diffusion rate is controlled with intra-particle diffusion which is slower than that of surface diffusion.
3.5 Adsorption isotherms
Isotherms studies can provide deep information on how the adsorbents interact with adsorbates. In this work, Langmuir and Freundlich adsorption isotherms are used to linear fitting with the experimental data. These two isotherms can be expressed respectively as:54
Langmuir adsorption isotherm:
| |
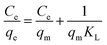 | (7) |
Freundlich adsorption isotherm:
| |
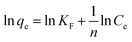 | (8) |
where
qmax (mg g
−1) is the maximal metal adsorption capacity,
KL (L mg
−1) is the Langmuir constant relating to the energy of adsorption,
KF and
n are Freundlich constants relating to the adsorption amount and adsorption intensity of the adsorbent, respectively.
Ce is the residual equilibrium concentration (mg L
−1), and
qe denotes the metal ion uptake per unit weight of adsorbent (mg g
−1) at equilibrium.
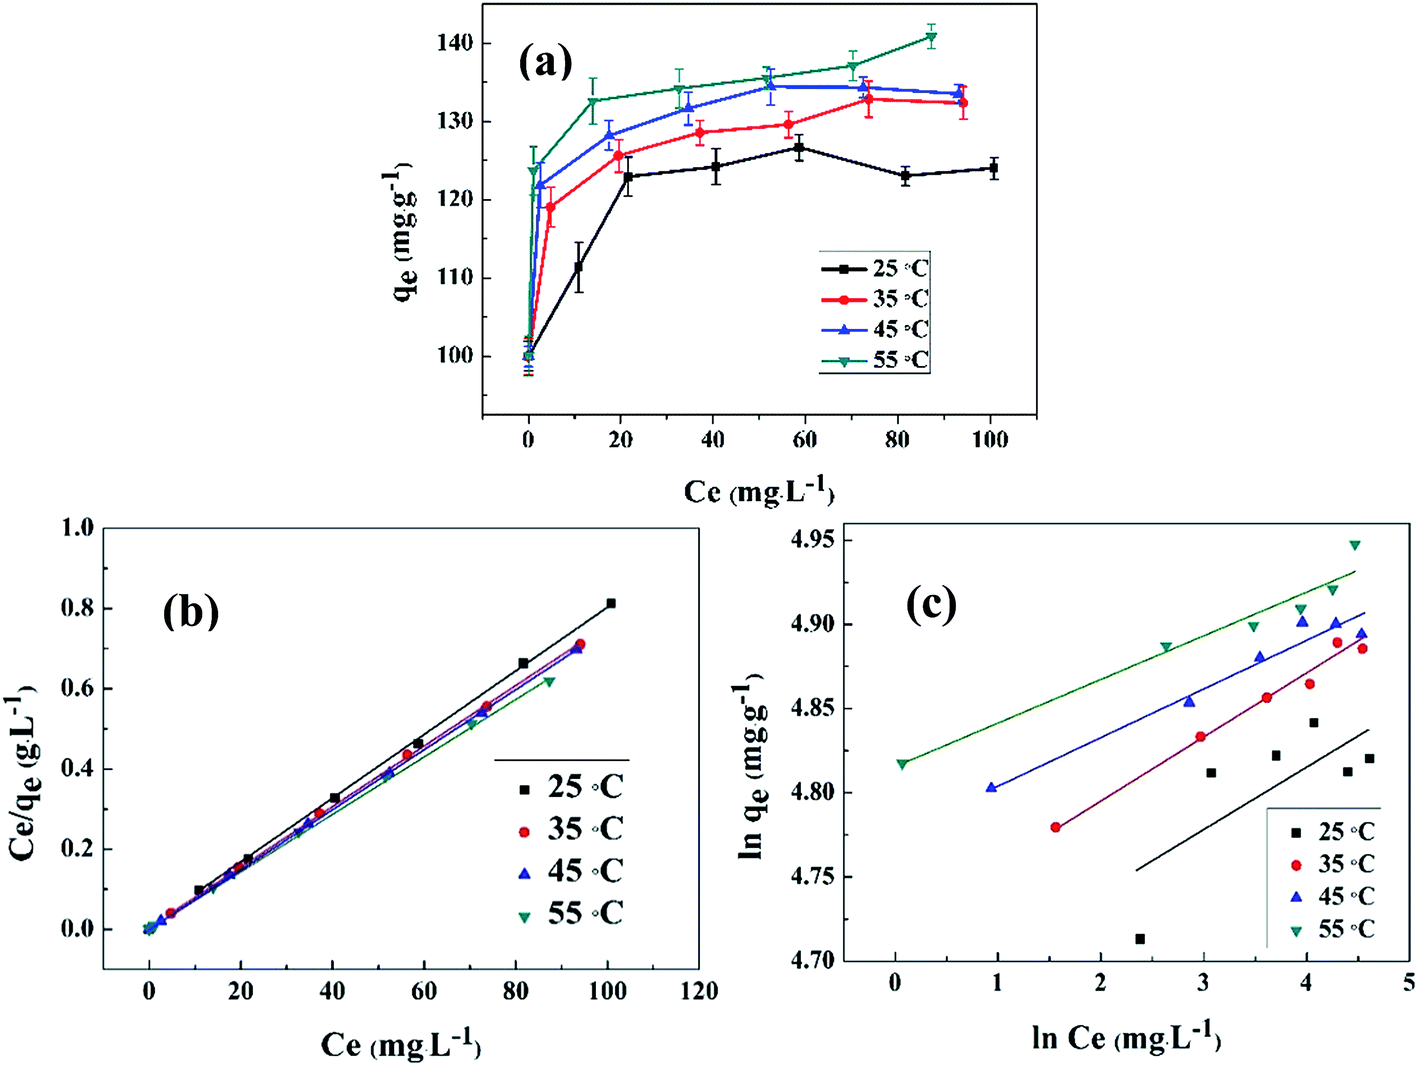
The adsorption of Ce(IV) was conducted at different initial concentrations ranging from 80–200 mg L−1. Fig. 11(a) shows the relationship of the equilibrium adsorption capacity of composite xerogels and the equilibrium concentration of Ce(IV) at different temperatures. The adsorption capacity increases with the increasing of temperatures, which indicates that the adsorption of Ce(IV) onto composite xerogels is an endothermic process. The experimental datas are modeled according to Langmuir and Freundlich isotherms, and the evaluated values are given in Table 1. It is clear that Langmuir isotherm describes better with a higher correlation coefficient (R2 = 0.9993–0.9997) in comparison with that of Freundlich (R2 = 0.5015–0.9804). The Langmuir isotherm is often applicable to a homogeneous adsorption surface with all the adsorption sites having equal adsorbate affinity, while Freundlich isotherm assumed that the concentration of adsorbate on the adsorbent surface increases as the adsorbate concentration increases.55 The match of the Langmuir isotherm equation for adsorption data indicates that the binding sites on the whole surface of composite xerogels are uniform, and Ce(IV) ions were adsorbed by forming a monolayer coverage of the aerogel skeleton.
 |
| | Fig. 11 (a) Adsorption isotherm of Ce(IV) on composite xerogels at different temperatures; (b) linear plots of Langmuir model of Ce(IV) on composite xerogels at different temperatures; (c) linear plots of Freundlich model of Ce(IV) on composite xerogels at different temperatures. | |
Table 1 Isotherm parameters of absorbing Ce(IV) onto composite xerogels at different temperatures
| T (K) |
Freundlich |
Langmuir |
| KF (L g−1) |
1/n |
R2 |
qmax (mg g−1) |
KL (L mg−1) |
R2 |
| 298 |
104.4428 |
23.9464 |
0.5015 |
124.5330 |
3.1004 |
0.9999 |
| 308 |
112.4951 |
27.2777 |
0.9804 |
132.9787 |
1.4082 |
0.9997 |
| 318 |
118.7060 |
35.1741 |
0.9485 |
134.4086 |
3.0000 |
0.9999 |
| 328 |
123.2839 |
38.0662 |
0.9462 |
139.6648 |
1.6460 |
0.9993 |
Furthermore, a dimensionless constant called separation factor (RL, also called equilibrium parameter) is commonly used to predict whether an adsorption system is favorable or unfavorable:56
| |
 | (9) |
The value of RL indicates the adsorption process to irreversible (RL = 0), favorable (0 < RL < 1), linear (RL = 1) or unfavorable (RL > 1). The RL is found to be in the range from 0–0.01, implies that the composite xerogels are quite a favorable absorbent for Ce(IV) ions.
In order to evaluate the potential improvements on the adsorption of Ce(IV), the comparison in maximum capacity of the Ce(IV) between the as-synthesized NiFe2O4/SiO2 magnetic porous composite xerogels and other reported adsorbents is shown in Table 2. The adsorption capacity for the Ce(IV) calculated by the Langmuir equation is up to 132.98 mg g−1 at 308 K. Compared with other adsorbent, it is clearly shown that the composite xerogels used in this work had a moderate adsorption capacity for the removal of Ce(IV), and there are no investigations on the adsorption of Ce(IV) radionuclides by magnetic adsorbents we can find. For the silica and silica based adsorbents,52,57 the adsorption can be attributed to the Si–OH groups on the surface of adsorbents, which is the similar way as the composite xerogels in this work, while the adsorption capacity of NiFe2O4/SiO2 composite xerogels is lower than the above two kinds of adsorbents, this may due to the heat treatment process to form the magnetic NiFe2O4 spinels, which caused the decrease of Si–OH groups. For montmorillonite,58 the adsorption capacity is up to 210 mg g−1, the high adsorption capacity may be attributed to the strong ion exchange ability of montmorillonite. There are also functionalized adsorbents have been reported,59–62 the adsorption capacity of monosodium glutamate functionalized chitosan beads is significantly larger than the corresponding value of composite xerogels this work, mainly due to the large amount of –NH2 and –OH groups graft on the surface. While the adsorption capacities of N-methylimidazolium functionalized anion exchange resin and Surfactant-impregnated activated carbon are smaller than the corresponding value of composite xerogels in this work, this may because of the different experimental conditions.
Table 2 Comparison of adsorption capacity (mg g−1) for Ce(IV) onto NiFe2O4/SiO2 magnetic porous composite xerogels with other absorbents
| Adsorbent sample |
Adsorption capacity (mg g−1) |
Reference |
| SiO2/TiO2 composite aerogels |
233.04 |
57 |
| SiO2 |
206.61 |
52 |
| Montmorillonite |
210 |
58 |
| PPy and PAn coated sawdust |
112 |
59 |
| Monosodium glutamate functionalized chitosan beads |
343 |
60 |
| N-Methylimidazolium functionalized anion exchange resin |
75.6 |
61 |
| Surfactant-impregnated activated carbon |
9.66 |
62 |
| NiFe2O4/SiO2 magnetic porous composite xerogels |
114.56 |
Present study |
3.6 Adsorption thermodynamics
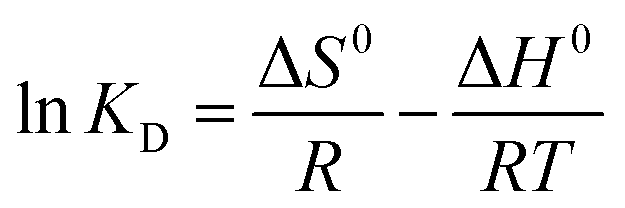
To examine the effect of temperature, adsorption experiments were carried out for the initial concentration of 100 mg L−1 at different temperatures. The values of ΔH0 (enthalpy changes) and ΔS0 (entropy changes) can be calculated from the slope and intercept of the plot of lnKd vs. 1/T (Fig. 12) by using the following equation:63| |
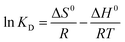 | (10) |
where KD (=qe/Ce) is the equilibrium adsorption constant at various temperatures (L g−1), ΔH0 and ΔS0 are the changes in the standard enthalpy (kJ mol−1) and the standard entropy (kJ mol−1 K) of adsorption, respectively, R is the perfect gas constant (8.314 kJ mol−1 K) and T is the absolute temperature (K).
 |
| | Fig. 12 Plot of lnKD versus 1/T for the adsorption of Ce(IV) onto composite magnetic xerogels. | |
The standard Gibbs free energies ΔG0 was calculated using
the calculated values for Δ
G0, Δ
H0 and Δ
S0 are listed in
Table 3. The value of Gibbs free energy change (Δ
G0) for the Ce(
IV) adsorption is negative, which demonstrates that the adsorption process is spontaneous. Furthermore, the decrease in the value of Δ
G0 with increasing temperature indicates that the adsorption is more favorable at high temperatures.
Table 3 Thermodynamic parameters calculated from the adsorption data of Ce(IV) onto composite magnetic xerogels
| ΔH0 (kJ mol−1) |
ΔS0 (J mol−1 K−1) |
ΔG0 (kJ mol−1) |
| 298 K |
308 K |
318 K |
328 K |
| 64.99 |
237.20 |
−5.64 |
−8.01 |
−10.38 |
−12.75 |
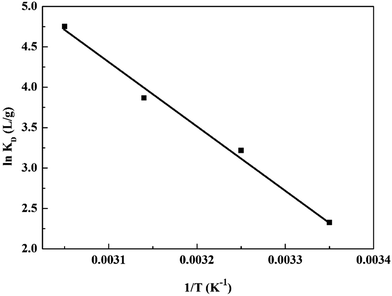
3.7 Regeneration and cycle analysis
Desorption is another important process due to its economical and practical application value. In this work, regeneration of the adsorbents was investigated by using 0.1 mol L−1 HNO3. After desorption, the adsorbents were treated with deionized water to wash away the residual HNO3 and explored for Ce(IV) adsorption in the succeeding cycles. As shown in Fig. 13, the adsorption capacity of the composite magnetic xerogels decreases gradually with the increasing number of cycles, and only decreased 13.7% after successive adsorption–desorption cycles. The result shows that the adsorbent exhibits a considerable high stability and maintain a similar level of adsorption capacity after four times of adsorption cycles, which suggests that the magnetic composite xerogels may be a promising adsorbent for the adsorption of Ce(IV) using magnetic separation.
 |
| | Fig. 13 Recycling experiments of removal of Ce(IV) from water over magnetic NiFe2O4/SiO2 composite xerogels. | |
4 Conclusion
A novel magnetic separable porous NiFe2O4/SiO2 composite xerogel adsorbent has been prepared via a sol–gel method for the removal of Ce(IV) from aqueous solution. The hierarchically porous structures with a specific surface area of 1085.25 m2 g−1 improve the adsorption ability by facilitating the diffusion of Ce(IV). Combined with in situ synthesis of NiFe2O4 nanoparticles in the SiO2 matrix, the magnetic NiFe2O4 nanoparticles facilitate the rapid separation of the adsorbent from waste water by applying a magnetic field. The effects of initial concentration, amounts of adsorbents, contact time, solution pH and temperature on the adsorption process of Ce(IV) were studied. The adsorption kinetics were better described by a pseudo-second-order kinetic model, and the absorption capacity of the absorbent for Ce(IV) was fitted well with the Langmuir model. Thermodynamic parameters obtained from the absorption process revealed that adsorption process was found to be endothermic. The values of ΔH0 (64.99 kJ mol−1), ΔS0 (237.20 J mol−1 K−1) and ΔG0 (−5.64 to −12.75 kJ mol−1) show that the adsorption of Ce(IV) on magnetic porous NiFe2O4/SiO2 composite xerogels was spontaneous in nature within the experiment temperatures. Moreover, the magnetic composite xerogels can be recycled about four times with feasible adsorption capacities, and could be used as a highly effective adsorbent to remove Ce(IV).
Acknowledgements
This work was supported by the National High-Tech Research and Development Program of China (863 Program) (No. 2015AA034701) and the Fundamental Research Funds for the Central Universities (No. 2008QNA4008).
References
- G. Zakrzewska-Trznadel, Desalination, 2013, 321, 119–130 CrossRef CAS.
- M. Ozawa, Y. Koma and K. Nomura, J. Alloys Compd., 1998, 271–273, 538–543 CrossRef CAS.
- S. Kumar, V. C. Srivastava, S. M. Nanoti, B. R. Nautiyal and Siyaram, RSC Adv., 2014, 4, 38830–38838 CAS.
- S. Deokattey, K. Bhanumurthy and P. K. Wattal, Prog. Nucl. Energy, 2013, 62, 37–45 CrossRef.
- R. D. Ambashta and M. E. T. Sillanpää, J. Environ. Radioact., 2011, 105(25), 76–84 Search PubMed.
- C. R. Ren, X. G. Ding, H. Q. Fu, C. Meng, W. Q. Li and H. Yang, RSC Adv., 2016, 6(76), 72479–72486 RSC.
- M. Q. Liu, Z. G. Tao, H. C. Wang, F. Zhao and Q. Sun, RSC Adv., 2016, 6(88), 84573–84586 RSC.
- J. Li, H. Cui, X. Song, G. S. Zhang, X. Z. Wang, Q. Song, N. Wei and J. Tian, RSC Adv., 2016, 6, 92402–92410 RSC.
- W. S. W. Ngah, L. C. Teong and M. A. K. M. Hanafiah, Carbohydr. Polym., 2011, 83(4), 1446–1456 CrossRef.
- C. Ding, W. Cheng, Y. Sun and X. Wang, J. Hazard. Mater., 2015, 295, 127–137 CrossRef CAS PubMed.
- M. J. Manos and M. G. Kanatzidis, Chem. Sci., 2016, 7, 4804–4824 RSC.
- D. Sarma, C. D. Malliakas, K. S. Subrahmanyam, S. M. Islam and M. G. Kanatzidis, Chem. Sci., 2015, 7(2), 1121–1132 RSC.
- M. Hadadian, M. H. Mallah, M. A. Moosavian, J. Safdari and M. Davoudi, Prog. Nucl. Energy, 2016, 90, 212–218 CrossRef CAS.
- H. Zhan, S. Wu, R. Bao, K. Zhao, L. Z. Xiao, L. N. Ge and H. J. Shi, RSC Adv., 2015, 5(19), 14389–14392 RSC.
- S. Abbaszadeh, S. R. W. Alwi, C. Webb, N. Ghasemi and I. I. Muhamad, J. Cleaner Prod., 2016, 118, 210–222 CrossRef CAS.
- M. R. Mahmoud, G. E. S. El-Deen and M. A. Soliman, Ann. Nucl. Energy, 2014, 72(5), 134–144 CrossRef CAS.
- M. Zhang, Y. P. Wu, X. Z. Feng, X. W. He, L. X. Chen and Y. K. Zhang, J. Mater. Chem., 2010, 20, 5835–5842 RSC.
- H. M. Al-Saidi, M. A. Abdel-Fadeel, A. Z. El-Sonbati and A. A. El-Bindary, J. Mol. Liq., 2016, 216, 693–698 CrossRef CAS.
- E. Zakharchenko, O. Mokhodoeva, D. Malikov, N. Molochnikova, Y. Kulyako and G. Myasoedova, Procedia Chem., 2012, 7(1), 268–274 CrossRef CAS.
- H. Wang, X. Wang, J. Chen, P. Xia and J. F. Zhao, RSC Adv., 2016, 6(61), 55809–55818 RSC.
- S. Rasamimanana, S. Mignard and I. Batonneau-Gener, Microporous Mesoporous Mater., 2016, 226, 153–161 CrossRef CAS.
- X. Wang, D. Shao, G. Hou, X. Wang, A. Alsaedi and B. Ahmad, J. Mol. Liq., 2015, 207, 338–342 CrossRef CAS.
- L. Wei, H. Zhang, Y. Dong, W. N. Song, X. X. Liu and Z. F. Zhao, RSC Adv., 2016, 6, 71375–71383 RSC.
- M. Moritz and M. Geszke-Moritz, Appl. Surf. Sci., 2015, 331, 415–426 CrossRef CAS.
- H. Chang, Z. X. Wu, M. S. Yao and S. Y. Guo, Energy Procedia, 2013, 39, 208–226 CrossRef CAS.
- M. F. He, C. Z. Wang and Y. M. Wei, RSC Adv., 2016, 6(8), 6415–6422 RSC.
- S. Caprarescu, A. L. Radu, V. Purcar, R. Ianchis, A. Sarbu, M. Ghiurea, C. Nicolae, C. Modrogan, D. L. Vaireanu, A. Périchaud and D. I. Ebrasu, Appl. Surf. Sci., 2015, 329, 65–75 CrossRef CAS.
- C. A. Kozlowski, J. Kozlowska, W. Pellowski and W. Walkowiak, Desalination, 2006, 198(1), 141–148 CrossRef CAS.
- H. Eroglu, E. Varoglu, S. Yapici and A. Sahin, Chem. Eng. J., 2010, 165(2), 563–572 CrossRef CAS.
- S. He, D. Huang, H. Bi, Z. Li, H. Yang and X. Cheng, J. Non-Cryst. Solids, 2015, 410, 58–64 CrossRef CAS.
- J. Zhao, X. Ding, C. Meng, C. Ren, H. Fu and H. Yang, Prog. Nucl. Energy, 2015, 85, 713–718 CrossRef CAS.
- K. Li, Z. Zeng, J. Xiong, L. Yan, H. Guo, S. Liu, Y. H. Dai and T. Chen, Colloids Surf., A, 2014, 465, 113–123 CrossRef.
- C. L. Wu, G. F. Zhu, J. Fan and J. J. Wang, RSC Adv., 2016, 6, 86428 RSC.
- F. Luo, Z. Shao, Y. Zhang and X. Cheng, Mater. Chem. Phys., 2013, 142(1), 113–118 CrossRef CAS.
- Y. Yao, S. Miao, S. Yu, M. Li, H. Sun and S. Wang, J. Colloid Interface Sci., 2012, 379(1), 20–26 CrossRef CAS PubMed.
- W. R. Zhao, J. L. Gu, L. X. Zhang, H. R. Chen and J. L. Shi, J. Am. Chem. Soc., 2005, 127(25), 8916–8917 CrossRef CAS PubMed.
- P. Hartmann, T. Brezesinski, J. Sann, A. Lotnyk, J. P. Eufinger, L. Kienle and J. Janek, ACS Nano, 2013, 7(4), 2999–3013 CrossRef CAS PubMed.
- S. Wang, Q. F. Zhao, H. M. Wei, J. Q. Wang, M. Cho, H. S. Cho, O. Terasaki and Y. Wan, J. Am. Chem. Soc., 2013, 135(32), 11849–11860 CrossRef CAS PubMed.
- Y. D. Huang, X. D. Gao, Z. Y. Gu and X. M. Li, J. Non-Cryst. Solids, 2016, 443, 39–46 CrossRef CAS.
- Y. C. Chen and C. Lu, J. Ind. Eng. Chem., 2014, 20(4), 2521–2527 CrossRef CAS.
- E. G. Deze, S. K. Papageorgiou, E. P. Favvas and F. K. Katsaros, Chem. Eng. J., 2012, 209(20), 537–546 CrossRef CAS.
- K. S. W. Sing, Pure Appl. Chem., 1985, 57(4), 603–619 CrossRef CAS.
- M. Srivastava, S. Chaubey and A. K. Ojha, Mater. Chem. Phys., 2009, 118(1), 174–180 CrossRef CAS.
- W. Liu, P. Yin, X. Liu, X. Dong, J. Zhang and Q. Xu, Chem. Eng. Res. Des., 2013, 91(12), 2748–2758 CrossRef CAS.
- B. H. Hameed, A. A. Ahmad and N. Aziz, Chem. Eng. J., 2007, 133(1–3), 195–203 CrossRef CAS.
- S. K. Yang, N. Tan, M. Yan, F. Chen, W. Long and Y. C. Lin, Mar. Pollut. Bull., 2013, 74(1), 213–219 CrossRef CAS PubMed.
- S. Duan, R. Tang, Z. Xue, X. X. Zhang, Y. Zhao, W. Zhang, J. H. Zhang, B. Q. Wang, S. Y. Zeng and D. Z. Sun, Colloids Surf., A, 2015, 469, 211–223 CrossRef CAS.
- L. Zhou, S. Pan., X. Chen, Y. Zhao, B. Zou and M. Jin, Chem. Eng. J., 2014, 257(6), 10–19 CrossRef CAS.
- I. A. Tan, A. L. Ahmad and B. H. Hameed, J. Hazard. Mater., 2009, 164(2–3), 473–482 CrossRef CAS PubMed.
- Z. Wang, J. Xu, Y. Hu, H. Zhao, J. Zhou, Y. Liu, Z. M. Lou and X. H. Xu, J. Taiwan Inst. Chem. Eng., 2016, 60, 394–402 CrossRef CAS.
- Y. S. Ho and G. Mckay, Process Biochem., 1999, 34(5), 451–465 CrossRef CAS.
- J. W. Tan, W. Su, T. J. Dou and X. P. Fan, Sep. Sci. Technol., 2012, 47(8), 1149–1155 CrossRef CAS.
- Y. Chen, J. Hu and J. Wang, Environ. Technol., 2012, 33(19–21), 2345–2351 CAS.
- T. S. Anirudhan and P. G. Radhakrishnan, J. Chem. Thermodyn., 2008, 40(4), 702–709 CrossRef CAS.
- O. Hamdaoui and E. Naffrechoux, J. Hazard. Mater., 2007, 147(1–2), 381–394 CrossRef CAS PubMed.
- Y. M. Hao, M. Chen and Z. B. Hu, J. Hazard. Mater., 2012, 184(184), 392–399 Search PubMed.
- Y. Y. Fu, X. G. Ding, C. Meng, T. J. Dou and H. Yang, J. Chin. Ceram. Soc., 2014, 1(1), 28–35 Search PubMed.
- Z. Klika, J. Seidlerová, M. Valášková, C. Kliková and I. Kolomazník, Appl. Clay Sci., 2016, 132(13), 41–49 CrossRef.
- A. Pornahad, Sep. Sci. Technol., 2010, 45(16), 2376–2382 CrossRef.
- M. A. K. M. Hanafiah, Z. M. Hussin, N. F. M. Ariff, W. S. W. Ngah and S. C. Ibrahim, Adv. Mater. Res., 2014, 970, 198–203 CrossRef.
- L. Z. Zhu and J. Cheng, J. Rare Earths, 2011, 29(10), 969–973 CrossRef CAS.
- M. R. Mahmoud, G. E. S. El-Deen and M. A. Soliman, Ann. Nucl. Energy, 2014, 72(5), 134–144 CrossRef CAS.
- C. Lu, H. Chiu and C. Liu, Ind. Eng. Chem. Res., 2006, 45(8), 2850–2855 CrossRef CAS.
|
| This journal is © The Royal Society of Chemistry 2017 |
Click here to see how this site uses Cookies. View our privacy policy here. 
 Open Access Article
 This Open Access Article is licensed under a Creative Commons Attribution-Non Commercial 3.0 Unported Licence
 *ab,
Chunrong Rena,
Wenqi Lia,
Huating Wua and
Hui Yangab
*ab,
Chunrong Rena,
Wenqi Lia,
Huating Wua and
Hui Yangab