 Open Access Article
Creative Commons Attribution 3.0 Unported Licence
A low molecular mass organogelator electrolyte with TiO2 nanoparticles for stable and efficient quasi-solid-state dye sensitized solar cells†
Wubshet Mekonnen Girma‡
 a,
Chia-Hung Chen‡a,
Cheng-Hsien Yangb,
Po-I. Wanga,
Keng-Liang Ou*cdefg,
Der-Jang Liaw*a and
Jia-Yaw Chang*a
aDepartment of Chemical Engineering, National Taiwan University of Science and Technology, 43, Section 4, Keelung Road, Taipei 10607, Taiwan, Republic of China. E-mail: jychang@mail.ntust.edu.tw; liawdj@mail.ntust.edu.tw; Fax: +886-2-27376644; Tel: +886-2-27303636
bShiFeng Technology Co., Tainan, 70955, Taiwan, Republic of China
cSchool of Dentistry, College of Oral Medicine, Taipei Medical University, Taipei 110, Taiwan, Republic of China. E-mail: klou@tmu.edu.tw
dBiomedical Engineering Research and Development Center, China Medical University Hospital, Taichung 404, Taiwan, Republic of China
eDepartment of Dentistry, Taipei Medical University-Shuang Ho Hospital, New Taipei City 235, Taiwan, Republic of China
f3D Global Biotechnology Inc., New Taipei City 221, Taiwan, Republic of China
gDepartment of Dentistry, Taipei Medical University Hospital, Taipei 110, Taiwan, Republic of China
First published on 23rd January 2017
Abstract
We report stable and efficient quasi-solid-state dye-sensitized solar cells (QS-DSSCs) fabricated using a combination of TiO2 nanoparticles and a low-molecular-mass organogelator (LMOG) as a nanoparticle–gel composite electrolyte. Three types of electrolyte, namely liquid, LMOG-based gel, and nanoparticle–gel composite, are used. The results of electrochemical impedance spectroscopy and intensity-modulated photocurrent/photovoltage spectroscopy measurements suggest that the presence of TiO2 nanoparticles in the nanoparticle–gel composite electrolyte could afford faster electron transport and a longer electron recombination time compared to the liquid and LMOG-based gel electrolytes. The QS-DSSC using the nanoparticle–gel composite electrolyte with the optimal TiO2 content exhibits a power conversion efficiency of 7.79%, which is significantly higher than that of devices using the liquid (7.22%) and LMOG-based gel (7.21%) electrolytes. Remarkably, the QS-DSSCs with the optimal nanoparticle–gel composite electrolyte exhibit long-term stability over 10 days, unlike the liquid electrolyte-based cells.
1. Introduction
Dye-sensitized solar cells (DSSCs) are considered to be one of the best options for the conversion of sunlight to electricity because they are made of nontoxic, inexpensive materials and have a high conversion efficiency of 13%.1 Much research has been done regarding the conversion efficiency of the dye in DSSCs. Electrolytes play an important role in the inner charge transport between the electrodes and continuously regenerate the dye itself during DSSC operation, determining the efficiency and long-term stability of the DSSC. Use of traditional organic liquid electrolytes containing the I−/I3− redox couple in such cells have practical problems such as leakage and evaporation, corrosion of the counter electrode, hermetic sealing of the cells, and lack of long-term stability of the cells.2,3 To overcome these problems, strong efforts have been made to replace the conventional liquid electrolyte with solid-state electrolytes. Room-temperature ionic liquids (ILs) are considered to be the best solvent alternatives to conventional organic liquid electrolytes in DSSCs owing to their physical properties such as ionic conductivity, thermal stability, and relatively low volatility.4,5 The use of IL electrolytes in DSSCs solves the leakage problem to a certain extent, but to further improve the mechanical stability and fully exploit the advantages of DSSCs, solid-state electrolytes have been regarded as a vital alternative.6,7 Various additives have been used in IL electrolytes to enhance the photocurrent and photovoltage. Among them, organic/inorganic semiconductors,8–13 polymer gel electrolytes,14 nanoparticles,15 and low-molecular-mass organogelators (LMOGs)16,17 have been considered as good candidates.LMOGs have the advantage of thermoreversibility; hot solutions of a low-viscosity electrolyte can efficiently fill the nanopores of a TiO2 photoelectrode, and upon cooling, they re-form its structure, yielding a mechanically stable quasi-solid electrolyte. The molecules of LMOGs are able to self-assemble into finely dispersed anisotropic aggregates within the organic solvent to form a three-dimensional network through interactions between LMOG molecules such as hydrogen bonding, hydrophobic interactions, π–π interactions, and electrostatic interactions.18 Many groups have made great efforts along these lines; for example, Tao et al.19 reported that N,N′-methylenebisdodecanamide could be used as an efficient LMOG to gelate 1-methyl-3-hexylimidazolium iodide containing an IL electrolyte, and they also used N,N′-1,5-pentanediylbis-dodecanamide to gelate 1,2-methyl-3-propylimidazoliumiodide (DMPII) containing an IL electrolyte.20,21
The incorporation of nanoparticles such as TiO2, SiO2, ZnO, or Al2O3 (ref. 22–24) into an IL electrolyte has been found to improve the long-term stability of DSSCs and to enhance the ionic conductivity, improving the charge transport dynamics.25–27 However, the effect of nanoparticles in LMOG-based gel electrolytes has received less attention.
In this work, we report the first attempt to add TiO2 nanoparticles to a LMOG-based gel electrolyte to increase the photovoltaic conversion efficiency (PCE) and long-term stability of DSSCs. DMPII and N,N′-1,3-propanediylbis-dodecanamide (denoted as an LMOG) were chosen as the liquid and gel electrolytes, respectively. The effects of liquid, gel, and nanoparticle–gel composite electrolytes on the interfacial charge transfer processes in DSSCs were investigated in detail using impedance analysis. The cell using the TiO2 nanoparticle–gel composite electrolyte with the optimal TiO2 concentration exhibited a PCE of 7.79%; this value is significantly higher than those of the cells using the liquid and gel electrolytes, which were ca. 7.22% and 7.21%, respectively.
2. Experimental methods
2.1 Preparation of the low molecular mass organogelator (LMOG)
N,N′-1,3-Propanediylbis-dodecanamide (an LMOG) was synthesized by the following procedure.18 Lauroylchloride (46.7 mmol) was added to NHCO3 (43.3 mmol) in a mixture of water (50 mL) and ether (50 mL) at 0 °C. Then 1,3-diaminopropane (14.7 mmol) was added dropwise to the above mixture over 20 min at 0 °C. The reaction was stirred for 8 hours at room temperature. The resulting reaction product was isolated by suction filtration and washed twice with ether and DI water. After recrystallization with ethanol, a white powder (6.1248 g, 95.13%) polymer was obtained. The polymer was characterized by proton nuclear magnetic resonance spectroscopy (1H NMR; AVIII-500 MHz FT-NMR, Bruker, USA; ESI, Fig. S1†).2.2 Synthesis of TiO2 nanoparticles
A mixture of 28.6 mmol titanium tetraisopropoxide (97%, Aldrich), 2.1 mL of isopropyl alcohol, and 50 mL of distilled water was prepared. Subsequently, the pH value of the reaction mixture was adjusted to 2.0 by dropwise addition of acetic acid. Then the solution was transferred to a Teflon autoclave and held at a reaction temperature of 230 °C for 12 h. After the reaction was complete, the solution was cooled to room temperature. A certain amount of ethanol was added to the solution, and the mixture was centrifuged at 6000 rpm. The precipitated TiO2 nanoparticles were then dried and weighed.2.3 Synthesis of different electrolytes
The liquid electrolyte consisted of 0.50 mmol I2 (99.99%, Across), 0.4 mmol LiI (99.99%, Aldrich), 4.50 mmol tert-butyl pyridine (96%, Aldrich), and 4.73 mmol DMPII in 4.33 mL of acetonitrile (99.9%, J-T Baker).The gel electrolyte was prepared by adding 3 wt% (see ESI, Fig. S2 and Table S1†) of the LMOG to the liquid electrolyte and heating the mixture under stirring until the gelator melted. The mixture was then cooled to room temperature, and the gel electrolyte was obtained.
To prepare the nanoparticle–gel composite electrolyte, the liquid electrolyte, N,N′-1,3-propanediylbis-dodecanamide (3 wt%) and various quantities of TiO2 nanoparticles (0.5–3.0 wt%) were mixed and heated under stirring until the gelator melted. Then the mixture was cooled to room temperature, and the nanoparticle–gel composite electrolyte was obtained.
2.4 Fabrication of DSSCs
The DSSCs were fabricated as follows: TiO2 paste was screen-printed on fluorine-doped tin oxide glass (Hartford Glass, 8 Ω per square) to obtain a nanocrystalline electrode having a transparent layer approximately 9.09 μm in thickness and a scattering layer approximately 1.41 μm in thickness. After heat treatment at 500 °C for 30 min, the nonporous TiO2 photoelectrode was immersed in 0.5 mM cis-dithiocyanate-N,N-bis-(4-carboxylate-4 tetrabutylammoniumcarboxylate-2,2-bipyridine) ruthenium(II) (N-719 dye, UR) in acetonitrile/t-butanol (1![[thin space (1/6-em)]](https://www.rsc.org/images/entities/char_2009.gif) :
:![[thin space (1/6-em)]](https://www.rsc.org/images/entities/char_2009.gif) 1, v/v) at room temperature for 24 h. The platinized counter electrode was obtained using DC sputtering equipment (Q150RS, Quorum, USA) at 20 mA and 2 × 10⁻³ Torr for 240 s. The DSSCs were assembled by sealing the dyed nanoporous TiO2 photoelectrode and counter electrode with thermal adhesive films using a 60 μm-thick Surlyn® sheet (Aubonne, Switzerland) as a spacer. The liquid electrolyte was injected through the holes in the counter electrode, which were later sealed by a hot-melt adhesive. The gel electrolyte was heated to 120 °C under stirring until the gel became completely liquid. Then the hot solution (electrolyte) was rapidly injected into the cell which was sealed using a method similar to that used for the liquid electrolyte. After the electrolyte cooled to room temperature, a gel layer exhibiting uniform motion was formed within the cell. Similarly, the nanoparticle–gel composite electrolyte was heated to 120 °C under stirring until the composite gel became liquid and the liquid gel was immediately injected through the holes into the cell. Then the cell was sealed with a hot-melt adhesive. After cooling, a uniform motionless gel was formed in the cell.
1, v/v) at room temperature for 24 h. The platinized counter electrode was obtained using DC sputtering equipment (Q150RS, Quorum, USA) at 20 mA and 2 × 10⁻³ Torr for 240 s. The DSSCs were assembled by sealing the dyed nanoporous TiO2 photoelectrode and counter electrode with thermal adhesive films using a 60 μm-thick Surlyn® sheet (Aubonne, Switzerland) as a spacer. The liquid electrolyte was injected through the holes in the counter electrode, which were later sealed by a hot-melt adhesive. The gel electrolyte was heated to 120 °C under stirring until the gel became completely liquid. Then the hot solution (electrolyte) was rapidly injected into the cell which was sealed using a method similar to that used for the liquid electrolyte. After the electrolyte cooled to room temperature, a gel layer exhibiting uniform motion was formed within the cell. Similarly, the nanoparticle–gel composite electrolyte was heated to 120 °C under stirring until the composite gel became liquid and the liquid gel was immediately injected through the holes into the cell. Then the cell was sealed with a hot-melt adhesive. After cooling, a uniform motionless gel was formed in the cell.
2.5 Characterization
The morphologies of the gels and nanoparticles were obtained by field emission scanning electron microscopy (SEM; JSM-6500F, JEOL, Japan). A two-electrode system was used for cyclic voltammetry (CV) which was recorded on an electrochemical workstation (Zennium, Germany) with a platinum ultra-microelectrode as the working electrode and a platinum disk electrode as the counter and reference electrodes. Electrochemical impedance spectroscopy (EIS) was measured with an electrochemical analyzer (Zennium, Germany). Z-View software (Zennium, Germany) was used to fit the EIS spectra. The intensity modulated photocurrent/photovoltage spectroscopy (IMPS/IMVS) measurements were performed using an electrochemical workstation (Zennium, Germany) under a modulated light emitting diode (λ = 479 nm), as described elsewhere.28–30 The incident photon-to-current conversion efficiency (IPCE) was recorded under the illumination of a 300 W xenon lamp (69911, Newport, USA) and monochromator (74125, Oriel cornerstone 260, Newport, USA). The current–voltage curves of solar cells with active areas of 0.16 cm2 were measured using a Keithley Model 2420 source meter and irradiation with a 450 W xenon lamp solar simulator (Oriel, USA) at 100% sunlight (AM 1.5G, 100 mW cm−2).3. Results and discussion
3.1 Preparation and characterization of liquid, gel, and nanoparticle–gel composite electrolytes
The liquid, gel, and nanoparticle–gel composite electrolytes were used in DSSCs to investigate their photovoltaic performances. A liquid electrolyte was synthesized as a control electrolyte. The gel electrolyte was prepared by adding the LMOG to the liquid electrolyte. TiO2 nanoparticles (0.5–3.0 wt%) were incorporated into the gel electrolyte to obtain the nanoparticle–gel composite electrolyte. TiO2 nanoparticles with an average size of ∼12.0 nm (Fig. 1a) were synthesized using a hydrothermal method. Fig. 1b displays the powder X-ray diffraction (XRD) patterns of the TiO2 nanoparticles. Three diffraction peaks can clearly be assigned to the (101), (004), and (200) lattice planes, in good agreement with the TiO2 anatase structure (JCPDS card no. 78-2486).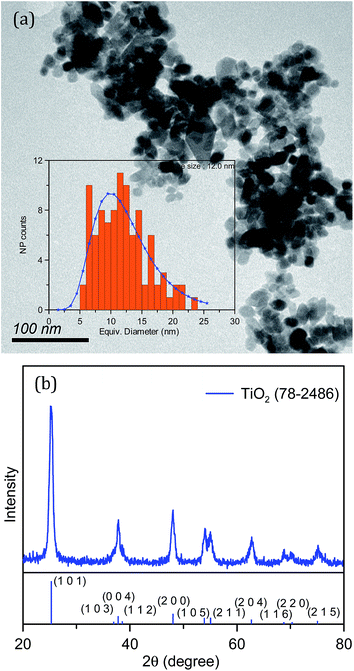 | ||
| Fig. 1 (a) TEM image and (b) XRD pattern of TiO2 nanoparticles. The inset in panel (a) shows the size distribution of the TiO2 nanoparticles. | ||
To reveal the microstructures of the gel and nanoparticle–gel composite electrolytes, a freeze-drying method was employed; Fig. 2 shows SEM images of the freeze-dried samples. The gel electrolyte shows a highly wrinkled and tightly stacked framework due to the formation of hydrogen bonds between –NH and C![[double bond, length as m-dash]](https://www.rsc.org/images/entities/char_e001.gif) O, as well as van der Waals forces among the long hydrocarbon chains of the LMOG molecules (Fig. 2a). After 1.0 wt% of TiO2 was added to the gel electrolyte, the morphology of the nanoparticle–gel composite exhibits a porous layer and voids due to the insertion of TiO2 nanoparticles inside the gel framework, which facilitates the formation of a microporous framework, as shown in Fig. 2b.
O, as well as van der Waals forces among the long hydrocarbon chains of the LMOG molecules (Fig. 2a). After 1.0 wt% of TiO2 was added to the gel electrolyte, the morphology of the nanoparticle–gel composite exhibits a porous layer and voids due to the insertion of TiO2 nanoparticles inside the gel framework, which facilitates the formation of a microporous framework, as shown in Fig. 2b.
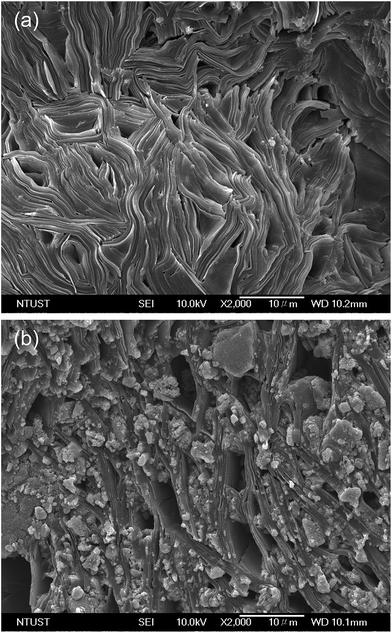 | ||
| Fig. 2 SEM images of (a) gel and (b) NPgel electrolytes. The NPgel electrolyte was prepared by mixing 3 wt% of the LMOG and 1 wt% of TiO2 nanoparticles with the liquid electrolyte. | ||
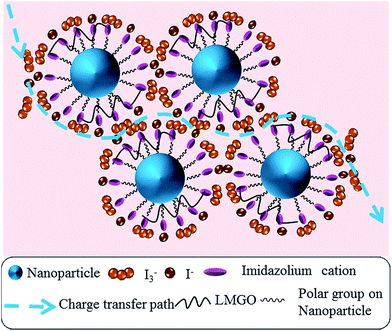
Scheme 1 illustrates the interactions in the gel and nanoparticle–gel composite electrolytes. In the gel electrolyte, self-assembly of a stacked framework of LMOG chains is generated by hydrogen bonding. After TiO2 nanoparticles are incorporated, the LMOG chains are separated by the nanoparticles, yielding a free volume, which supports diffusion of the I−/I3− redox couple in the electrolyte and enhances the ionic conductivity. Moreover, the presence of TiO2 nanoparticles in the electrolyte enhances the cation exchange reaction. The imidazolium (Im+) cations in the electrolyte are effectively adsorbed onto the TiO2 nanoparticle surfaces, and I− and I3− accumulate around the Im+ owing to coulombic attraction. Consequently, the diffusion of the redox couple increases in the nanoparticle–gel composite electrolyte (Scheme 2).
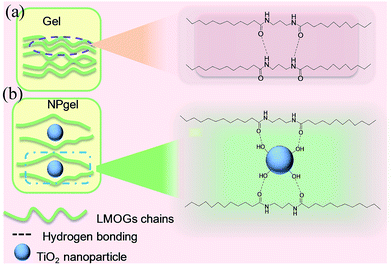 | ||
| Scheme 1 Schematic representations of (a) the interaction of LMOG chains in the gel electrolyte and (b) the interaction between the LMOG chain and TiO2 nanoparticles in the NPgel electrolyte. | ||
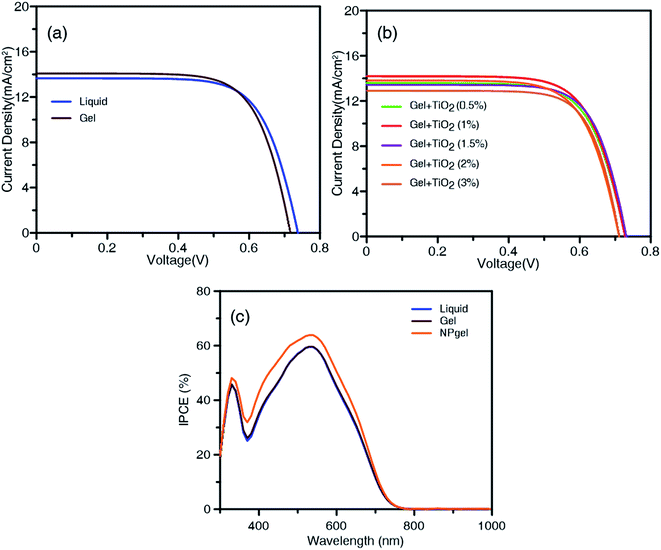
3.2 Photovoltaic performance of DSSCs with different electrolytes
Fig. 3a and b show the current–voltage (J–V) curves of DSSCs with different electrolytes under AM 1.5G irradiation (100 mW cm−2). Table 1 lists the photocurrent–voltage parameters: the short-circuit photocurrent density (JSC), open-circuit potential (VOC), fill factor (FF), and PCE. The best DSSC with the liquid electrolyte exhibited an efficiency of 7.22% (average efficiency of 7.19 ± 0.03%), a JSC value of 13.8 mA cm−2, a VOC value of 738 mV, and an FF of 71.1%. When the gel electrolyte was used in the DSSC, the JSC value, VOC value, and FF of the DSSC were 13.9 mA cm−2, 722 mV, and 71.6%, respectively, corresponding to a PCE of 7.21% (average efficiency of 7.11 ± 0.10%). When 0.5 wt% of TiO2 nanoparticles were added to the gel electrolyte, the resulting solar cells showed an efficiency of 7.11%. The best DSSC overall was that with 1.0 wt% of TiO2 in the gel electrolyte; it displayed an improved JSC value and FF, realizing the highest conversion efficiency (7.79%) among all the cells with different electrolyte types, with an average efficiency of 7.66 ± 0.13%. This optimal nanoparticle–gel composite electrolyte is denoted as the “NPgel electrolyte” for convenience. However, the photovoltaic efficiency of the gel electrolyte with more TiO2 nanoparticles was degraded, as shown by the decreasing trend of JSC, VOC, and the PCE in Table 1. When the additive was increased to 3 wt% of TiO2 nanoparticles, the DSSC exhibited lower JSC and VOC values than the cells using the liquid electrolyte, resulting in a drop in the average conversion efficiency from 7.19 ± 0.03% to 6.47 ± 0.44%. The results could be attributed to the aggregation of TiO2 nanoparticles and hampered diffusion of I−/I3− ions, which increases the possibility of electron–hole pair recombination within the electrolyte. The effect of the TiO2 nanoparticle size on the PCE of the DSSCs was examined. As shown in Fig. S3,† DSSCs using TiO2 nanoparticles with average particle sizes of ∼28.3 and 35.5 nm, obtained using synthesis reaction times of 16 and 24 h, respectively, show a decreased PCE (Fig. S4 and Table S2†). As the TiO2 nanoparticle size increases, the adsorption of Im+ on the surface of the nanoparticles becomes ineffective, reducing the coulombic attraction between the Im+ and the redox couples. This result reveals that with increasing synthesis reaction time, the growth period of TiO2 nanoparticle increases, hindering the diffusion of the I−/I3− redox couple.| Electrolyte | JSC (mA cm−2) | VOC (mV) | FF (%) | PCEa (%) | PCEb (%) |
|---|---|---|---|---|---|
| a The performance of the champion cell.b Average efficiency and standard deviations from five independent cells. | |||||
| Liquid | 13.8 | 738 | 71.1 | 7.22 | 7.19 ± 0.03 |
| Gel | 13.9 | 722 | 71.6 | 7.21 | 7.11 ± 0.10 |
| Gel + TiO2 (0.5 wt%) | 13.8 | 728 | 70.9 | 7.11 | 7.07 ± 0.04 |
| Gel + TiO2 (1.0 wt%) | 14.3 | 736 | 74.2 | 7.79 | 7.66 ± 0.13 |
| Gel + TiO2 (1.5 wt%) | 13.6 | 732 | 72.6 | 7.23 | 7.20 ± 0.03 |
| Gel + TiO2 (2.0 wt%) | 13.5 | 712 | 72.5 | 6.96 | 6.85 ± 0.11 |
| Gel + TiO2 (3.0 wt%) | 13.1 | 710 | 74.6 | 6.91 | 6.47 ± 0.44 |
In Fig. 3b, the maximum IPCE values are 59.1%, 58.8%, and 63.7% at 540 nm for the DSSCs containing the liquid, gel, and NPgel electrolytes, respectively. The IPCE values are consistent with the above JSC values and PCEs obtained from cells using the three types of electrolyte.
3.3 Electrochemical impedance spectroscopy analyses
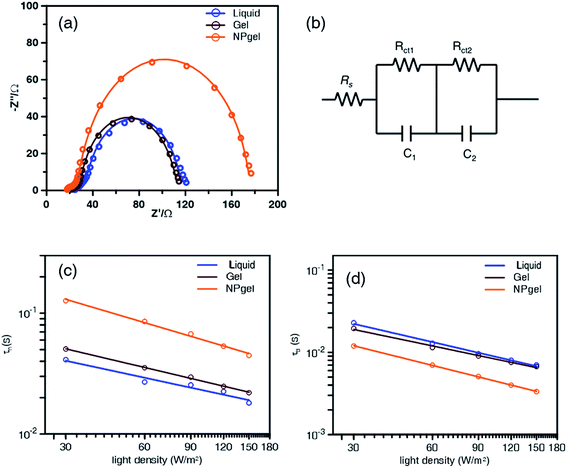
The interfacial charge transfer processes of DSSCs based on the liquid, gel, and NPgel electrolytes were further studied by EIS (Fig. 4a). The higher-frequency range in the small semicircle of the Nyquist plots represents the electrolyte in the counter electrode, and the larger semicircle in the low-frequency range corresponds to electron transfer at the TiO2/dye/electrolyte interface. In the equivalent circuit simulation, the sheet resistance (Rs) is related to the ohmic resistance of the substrate, Rct1 is the charge recombination resistance at the counter electrode/electrolyte interface, and Rct2 is the charge recombination resistance at the TiO2/dye/electrolyte interface (Fig. 4b). Compared with those of the liquid (Rct2 = 73.0 Ω) and gel (Rct2 = 73.7 Ω) electrolytes, the Rct2 value of the NPgel electrolyte (135 Ω) is significantly higher, indicating that more interfacial charge recombination occurs in the NPgel electrolyte than in the other electrolytes. By fitting the EIS curves, the electron lifetime (τn), which is determined by the transfer of electrons from the dye to TiO2, could be determined using the equation τn = Rct2 × C2, where C2 is the corresponding chemical capacitance. As shown in Table 2, the τn values are 56.0 and 60.6 ms for the solar cells with the liquid and gel electrolytes, respectively, and it increases to 83.2 ms when NPgel is used as the electrolyte. The results suggest that the TiO2 nanoparticles in the NPgel electrolyte decrease the interfacial rate constant for electron capture by I3− ions, which favors electron transport over a longer distance, enabling better photovoltaic performance.| Electrolytes | Rs (Ω) | Rct1 (Ω) | C1 (μF) | Rct2 (Ω) | C2 (μF) | τn (ms) |
|---|---|---|---|---|---|---|
| Liquid | 20.1 | 28.4 | 24.2 | 73.0 | 767 | 56.0 |
| Gel | 19.4 | 26.9 | 25.4 | 73.7 | 823 | 60.6 |
| NPgel | 18.6 | 26.7 | 25.3 | 135 | 616 | 83.2 |
To understand the electron transport and recombination at the TiO2/dye/electrolyte interface, IMPS/IMVS measurements were conducted to obtain the electron kinetics plots. The electron transport time (τt) and recombination lifetime (τr) were estimated using the equations τt = 1/(2πfIMPS) and τr = 1/(2πfIMVS), where fIMPS and fIMVS are the characteristic frequencies of the lowest imaginary components obtained by IMPS and IMVS, respectively. The logarithms of the electron transport time and recombination lifetime both decreased with increasing light density (Fig. 4c and d). At the same light density, IMPS shows that the τt value of the cell with the NPgel electrolyte is larger than those of the cells with the liquid and gel electrolytes, whereas IMVS shows that the cell with the NPgel electrolyte has a smaller τr value than those of the other cells. The results suggest that the NPgel electrolyte offers the possibility for faster electron transport and a longer electron recombination time, which would result in a higher photocurrent compared to those of the cells containing the liquid and gel electrolytes.
3.4 Diffusion coefficient of I−/I3− ions in different electrolytes
Typically, diffusion of the I−/I3− redox couple in electrolytes is the rate-determining step in the performance of DSSCs. Faster transport of the I−/I3− redox couple improves the cell performance. Linear sweep voltammetry was conducted to measure the diffusion coefficient of the I−/I3− redox couple using symmetric cells (Fig. 5). The apparent diffusion coefficient (D) of the redox couple was calculated using the following equation:31where JI is the limiting current density, n is the number of electrons transferred in the reaction (here n = 2), c is the molar concentration of the investigated species (I− or I3−), NA is the Avogadro constant, and L is the electrode distance.
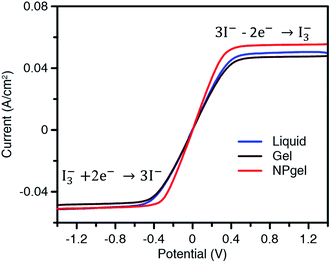 | ||
| Fig. 5 Linear sweep voltammograms of symmetric cells with different electrolytes. The scan rate was 10 mV s−1. | ||
The JI(I3−) and JI(I−) values were determined by the lower plateau and upper plateau steady-state currents of linear sweep voltammograms, respectively. As shown in Table 3 the calculated D values of I− and I3− in the liquid electrolyte are estimated to be 9.81 × 10⁻⁶ and 7.94 × 10⁻⁶ cm2 s−1, respectively, which are higher than those in the gel electrolyte (9.50 × 10⁻⁶ and 7.72 × 10⁻⁶ cm2 s−1 for I− and I3−, respectively) because of the lower viscosity. The D values of I− and I3− ions in the NPgel electrolyte were determined to be approximately 10.9 × 10⁻⁶ and 8.15 × 10⁻⁶ cm2 s−1, revealing that it has the largest electrolyte diffusion coefficient for the redox process among these electrolytes. The improved diffusion of I3− and I− ions in the NPgel electrolyte could be attributed to the more porous network resulting from the incorporation of TiO2 nanoparticles into the gel electrolyte, which provides a free volume for transport of I− and I3−, as discussed in detail in connection with Scheme 1 and Fig. 2.
| Electrolytes | JI(I3−) (10−2 A cm−2) | JI(I−) (10−2 A cm−2) | D(I3−) (10−6 cm2 s−1) | D(I−) (10−6 cm2 s−1) |
|---|---|---|---|---|
| Liquid | 5.11 | 5.05 | 7.94 | 9.81 |
| Gel | 4.96 | 4.89 | 7.72 | 9.50 |
| NPgel | 5.24 | 5.61 | 8.15 | 10.9 |
3.5 Durability tests of DSSCs with different electrolytes
The efficiencies of cells with different electrolytes were measured for 10 days and normalized to the values measured on the first day. As shown in Fig. 6, the efficiency of the DSSC with the liquid electrolyte decreased by 12% compared to its initial value after 5 days, whereas the PCEs of the DSSCs with the gel and NPgel electrolytes had maintained their initial values. After 10 days, the PCE of the DSSC using the liquid electrolyte had decreased to 50% of its initial value, possibly because of electrolyte leakage, whereas the efficiencies of the cells using the gel and NPgel electrolytes were maintained at more than 95% of the initial values. Although the cells using the gel and NPgel electrolytes exhibited the same stability, the cell containing the NPgel electrolyte exhibited a higher initial efficiency than the cell containing the gel electrolyte, as displayed in Fig. 3. The combined results suggest that the addition of TiO2 nanoparticles to the gel electrolyte improves its photovoltaic behavior, and the addition of the LMOG to the gel electrolyte provides long-term stability.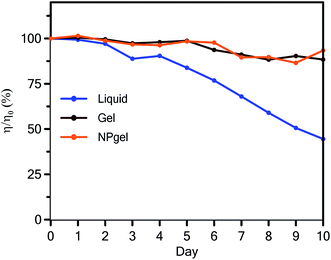 | ||
| Fig. 6 Variation in the normalized efficiency of the DSSCs based on the liquid, gel, and NPgel electrolytes measured for 10 days. | ||
4. Conclusions
In conclusion, TiO2 nanoparticle–gel composite electrolytes were prepared for use in efficient and stable quasi-solid-state DSSCs. To the best of our knowledge, this work is the first attempt to investigate the effect of inorganic nanoparticles in LMOG-based gel electrolytes. The DSSC with the NPgel electrolyte, which contained 1.0 wt% of TiO2 and 3 wt% of LMOG, exhibited the highest PCE, 7.79%, which is significantly higher than those of the devices using a liquid (7.22%) or an LMOG-based gel (7.21%) as electrolytes. Additionally, the DSSC with the NPgel electrolyte showed favorable stability with nearly constant efficiency, whereas the PCE of the DSSC using the liquid electrolyte decreased to 50% of its initial value after 10 days. Compared to the liquid and gel electrolytes, the NPgel electrolyte afforded more rapid diffusion of the I−/I3− redox couple, suppressing electron recombination and resulting in a higher photocurrent. Additionally, the electrochemical properties of the DSSCs with the liquid, gel, and NPgel electrolytes were investigated thoroughly by impedance spectroscopy and IMPS/IMVS.Conflict of interest
The authors declare no conflict of interest.Acknowledgements
This work was supported by the Ministry of Science and Technology of the Republic of China under Contract No. MOST 105-2119-M-011-002. This study is supported in part by Taiwan Ministry of Health and Welfare Clinical Trial Center (MOHW105-TDU-B-212-133019). 3D Global Biotechnology Inc. is acknowledged for funding.References
- S. Mathew, A. Yella, P. Gao, R. Humphry-Baker, B. F. Curchod, N. Ashari-Astani, I. Tavernelli, U. Rothlisberger, M. K. Nazeeruddin and M. Grätzel, Nat. Chem., 2014, 6, 242–247 CrossRef CAS PubMed.
- M. Wang, C. Gratzel, S. M. Zakeeruddin and M. Gratzel, Energy Environ. Sci., 2012, 5, 9394–9405 CAS.
- Z. Yu, N. Vlachopoulos, M. Gorlov and L. Kloo, Dalton Trans., 2011, 40, 10289–10303 RSC.
- P. Wang, S. M. Zakeeruddin, R. Humphry-Baker and M. Grätzel, Chem. Mater., 2004, 16, 2694–2696 CrossRef CAS.
- D. Kuang, P. Wang, S. Ito, S. M. Zakeeruddin and M. Grätzel, J. Am. Chem. Soc., 2006, 128, 7732–7733 CrossRef CAS PubMed.
- T. Stergiopoulos, I. M. Arabatzis, G. Katsaros and P. Falaras, Nano Lett., 2002, 2, 1259–1261 CrossRef CAS.
- P. Wang, S. M. Zakeeruddin, J. E. Moser, M. K. Nazeeruddin, T. Sekiguchi and M. Grätzel, Nat. Mater., 2003, 2, 402–407 CrossRef CAS PubMed.
- J. Burschka, F. Kessler, M. K. Nazeeruddin and M. Grätzel, Chem. Mater., 2013, 25, 2986–2990 CrossRef CAS.
- N. Mohmeyer, D. Kuang, P. Wang, H.-W. Schmidt, S. M. Zakeeruddin and M. Gratzel, J. Mater. Chem., 2006, 16, 2978–2983 RSC.
- L.-Y. Chang, C.-P. Lee, R. Vittal, J.-J. Lin and K.-C. Ho, J. Mater. Chem. A, 2013, 1, 3055–3060 CAS.
- H. J. Snaith, A. J. Moule, C. Klein, K. Meerholz, R. H. Friend and M. Grätzel, Nano Lett., 2007, 7, 3372–3376 CrossRef CAS PubMed.
- J. Wu, S. Hao, Z. Lan, J. Lin, M. Huang, Y. Huang, P. Li, S. Yin and T. Sato, J. Am. Chem. Soc., 2008, 130, 11568–11569 CrossRef CAS PubMed.
- F. Fabregat-Santiago, J. Bisquert, L. Cevey, P. Chen, M. Wang, S. M. Zakeeruddin and M. Grätzel, J. Am. Chem. Soc., 2008, 131, 558–562 CrossRef PubMed.
- P. Wang, S. M. Zakeeruddin and M. Grätzel, J. Fluorine Chem., 2004, 125, 1241–1245 CrossRef CAS.
- Z. Huo, S. Dai, K. Wang, F. Kong, C. Zhang, X. Pan and X. Fang, Sol. Energy Mater. Sol. Cells, 2007, 91, 1959–1965 CrossRef CAS.
- L. Tao, Z. Huo, S. Dai, J. Zhu, C. Zhang, Y. Huang, B. Zhang and J. Yao, J. Power Sources, 2014, 262, 444–450 CrossRef CAS.
- L. Wang, Z. Huo, L. Tao, J. Zhu, C. Zhang, S. Chen and S. Dai, J. Photochem. Photobiol., A, 2016, 329, 139–145 CrossRef CAS.
- L. Tao, Z. Huo, S. Dai, Y. Ding, J. Zhu, C. Zhang, B. Zhang, J. Yao, M. K. Nazeeruddin and M. Grätzel, J. Phys. Chem. C, 2014, 118, 16718–16726 CAS.
- L. Tao, Z. Huo, S. Dai, J. Zhu, C. Zhang, X. Pan, Y. Huang, S. Yang, B. Zhang and J. Yao, Mater. Chem. Phys., 2015, 152, 62–68 CrossRef CAS.
- L. Tao, Z. Huo, Y. Ding, Y. Li, S. Dai, L. Wang, J. Zhu, X. Pan, B. Zhang, J. Yao, M. K. Nazeeruddin and M. Gratzel, J. Mater. Chem. A, 2015, 3, 2344–2352 CAS.
- Z. Huo, L. Tao, S. Dai, J. Zhu, C. Zhang, S. Chen and B. Zhang, Sci. China Mater., 2015, 58, 447–454 CrossRef CAS.
- M. Khannam, S. Sharma, S. Dolui and S. K. Dolui, RSC Adv., 2016, 6, 55406–55414 RSC.
- S. J. Lim, Y. S. Kang and D.-W. Kim, Electrochim. Acta, 2011, 56, 2031–2035 CrossRef CAS.
- W.-C. Chang, S.-Y. Sie, W.-C. Yu, L.-Y. Lin and Y.-J. Yu, Electrochim. Acta, 2016, 212, 333–342 CrossRef CAS.
- J. Wu, Z. Lan, J. Lin, M. Huang, Y. Huang, L. Fan and G. Luo, Chem. Rev., 2015, 115, 2136–2173 CrossRef CAS PubMed.
- W. Kubo, K. Murakoshi, T. Kitamura, S. Yoshida, M. Haruki, K. Hanabusa, H. Shirai, Y. Wada and S. Yanagida, J. Phys. Chem. B, 2001, 105, 12809–12815 CrossRef CAS.
- S. Yanagida, C. R. Chim., 2006, 9, 597–604 CrossRef CAS.
- L. Peter and K. Wijayantha, Electrochim. Acta, 2000, 45, 4543–4551 CrossRef CAS.
- A. Fisher, L. Peter, E. Ponomarev, A. Walker and K. Wijayantha, J. Phys. Chem. B, 2000, 104, 949–958 CrossRef CAS.
- B. Liu, W. Li, B. Wang, X. Li, Q. Liu, Y. Naruta and W. Zhu, J. Power Sources, 2013, 234, 139–146 CrossRef CAS.
- M. Berginc, U. Opara Krašovec, M. Jankovec and M. Topič, Sol. Energy Mater. Sol. Cells, 2007, 91, 821–828 CrossRef CAS.
Footnotes |
| † Electronic supplementary information (ESI) available. See DOI: 10.1039/c6ra27203g |
| ‡ Wubshet Mekonnen Girma and Chia-Hung Chen contributed equally to this work. |
| This journal is © The Royal Society of Chemistry 2017 |

