 Open Access Article
Creative Commons Attribution 3.0 Unported Licence
Optimizing electroosmotic flow in an annulus from Debye Hückel approximation to Poisson–Boltzmann equation
Gan-Jun Cen ab,
Chien-Cheng Chang*ab and
Chang-Yi Wang*c
aCollege of Chemistry and Chemical Engineering and College of Civil Engineering and Architecture, Guangxi University, Nanning 530004, China
bInstitute of Applied Mechanics and Center for Advanced Study in Theoretical Sciences, National Taiwan University, Taipei 10764, Taiwan. E-mail: mechang@iam.ntu.edu.tw
cDepartments of Mathematics and Mechanical Engineering, Michigan State University, East Lansing, MI 48824, USA. E-mail: cywang@math.msu.edu
First published on 23rd January 2017
Abstract
In this study, we consider steady and starting electroosmotic (EO) flow in an annulus channel with different zeta potentials (denoted by α, β, respectively) developed on the inner and outer channel walls. An analytical solution is first obtained under the linearized Debye–Hückel approximation (DHA), and then extended to the non-linear Poisson–Boltzmann equation (PBE) by the method of homotopy. The steady-state EO pumping rate for any given pair of (α, β) is optimized with respect to the ratio b of inner to the outer radii, and the corresponding temporal developments of the optimal EO flow are given detailed investigation of the effects of the electric double layer (EDL). The optimal EO pumping rates QM(α,β) are presented on the α–β plane for several electrokinetic widths (K) to illustrate their general trends versus the corresponding b (denoted by bmax), which serves as a useful guide for practical applications. Investigation is also given to the shifts of bmax and QM(α,β) with varying the parameter λ, which measures the nonlinearity of the PBE.
1 Introduction
In recent years, electro-osmosis has been widely used as a powerful method to transport fluids in micro-tubes.1 The principle is to make use of the EDLs associated with the zeta potential in a micron- or nano-scale channel to transport, mix or separate electrolytes by externally applying a steady or time-varying voltage.2–4 For example, Jia et al. presented a novel microfluidic device using induced-charge electroosmosis (ICEO) flow to focus and collect microparticles in the suspending medium.5 Das et al. presented a microfluidic device for trapping and detection of oil droplets in water by using an alternating current (AC) electroosmotic.6 Sasaki et al. fabricated a micromixer to rapidly mix the fluids by using AC electroosmotic flow.7 Jellema et al. developed a new microfluidic approach for charge-based particle separation using combined hydrodynamic and electrokinetic effects.8 Witek et al. evaluated the electrokinetic transport properties of the cells in microdevices fabricated in pristine and ultraviolet-modified poly(methyl methacrylate) (PMMA) and polycarbonate (PC).9One out of the many important applications is the decontamination of porous media such as soils.10 It is a high-efficiency and quick method that decontaminate and repair saturated clay with low penetrability which has been polluted by heavy metal, and the heavy metal removal is over 90%.11 Annamalai et al. effectively decontaminated and repaired the textile dye-contaminated field soil12 and textile effluent-contaminated farming soil13 by using the electrokinetic remediation technology. On the theoretical side, Wu and Papadopoulos14 suggested that one model for porous media is the annular pore, and obtained an exact EO solution through the Debye–Hückel approximation. In 2000, the same solution was found independently by Tsao.15 The unsteady starting EO flow in an annulus was solved by Chang and Wang,16 and the oscillatory EO flow by Jian et al.17 Wu and Papadopoulos noted that under certain conditions altering the inner cylinder (core) radius may increase or decrease the EO flow. However, no details were supplied. On the other hand, the study of Chang and Wang16 is limited to annular tubes with the same zeta potentials on both inner and outer walls. In this study, we present a thorough investigation about how the core radius (with a different zeta potential) may influence the EO pumping rate.
Most solid surfaces are charged when in contact with a dissociating fluid. The surface charge varies greatly, and may assume different signs. Take proteins as an example, whose charge is of complicated nature. Many proteins such as the bacteriophage capsid have a transition from net-positive to net-negative charge depending on the solution pH, the salt concentration as well as the detailed distribution of amino acids.18,19 Annular tubes represent an interesting example with two channel walls which may develop different zeta potentials. The purpose of this study is to provide semi-analytical solutions and investigate physical significance for both steady and transient EO flows in annular tubes from the linear D–H approximation to the nonlinear P–B equation.
2 Basic equations
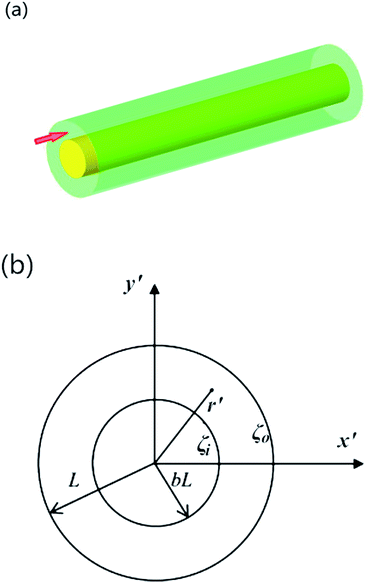
Fig. 1a and b shows a schematic diagram and the cross section of the annular channel for EO flow considered in this study.Assume that the electrolyte is a Newtonian fluid, and the fluid flow is solely caused by electro-osmosis. The fluid motion is governed by the Navier–Stokes (N–S) equation20
 | (1) |
 | (2) |
The Poisson–Boltzmann equation for a symmetric electrolyte is18,20
 | (3) |
The flow is started by applying an external electric field suddenly at t′ = 0,
In this study, we normalize the coordinates x′, y′ and radial distance r′ by setting x′ = Lx, y′ = Ly and r′ = Lr. Let ζM be the maximum zeta potential in the range of interest. The zeta potentials on the inner and outer walls are normalized to be α and β with α = ζi/ζM and β = ζo/ζM. Normalize all the variables in the N–S and P–B equations with appropriate reference scales: u = u′/(−E0εζ/μ), t = t′/(ρL2/μ), ∇2 = L2∇′2, ψ = ψ′/ζM and H(t) = E(t′)/E0. Eqn (2) and (3) can then be written in the non-dimensional form
N–S:
| ut = ∇2u + ∇2ψH(t) | (4) |
P–B:
 | (5) |
and
 | (6) |
It is noted that λ measures the strength of the zeta potential relative to the thermal potential, representing the degree of nonlinearity of the PB equation. K is the ratio of the radius L and Debye length λD, therefore also called the non-dimensional electro-kinetic width. It indicates a relatively thin EDL if K is large and a thick one if K is small. For example, the capillary electrophoresis applications usually have K at the orders of about 10–100 with the Debye lengths (λD) in the range of about 1–10 nm in a microfluidic channel (with characteristic width, say, 100 nm). However, a smaller K (with overlapped EDLs) can be produced by using a smaller microchannel (i.e., the radius L on the scale of nanometers) or decreasing the bulk concentration (low n0). In this study, we choose K > 3 in order that the result is not further complicated by the issues of overlapped EDLs. The range of λ values is of practical concern. Take, for example, T = 288 K (15 °C), kbT = 0.0248 eV (kb = 8.62 × 10⁻⁵ eV K−1). The value of ζ = 25 mV (either positive or negative), can be taken as a useful reference that separates low-charged surfaces from highly-charged surfaces. In CE (capillary electrophoresis) applications, the wall zeta potential ζ may vary in a wide range of values (say, from 0 to ±75 mV, i.e., λ = 0–3z), which requires solution of the nonlinear Poisson–Boltzmann equation.
Let Q be the flow rate Q′ normalized by −E0εζL2/μ, then we have
 | (7) |
3 Debye–Hückel approximation
For low zeta potentials (λ → 0), eqn (5) is reduced to the linear Debye–Hückel approximation| ∇2ψ = K2ψ | (8) |
3.1 Steady EO flow in an annulus
When the flow in the tube is steady (ut = 0), we denote the steady-state flow velocity by u0. Then we have from eqn (4)| ∇2u0 + ∇2ψ = 0 or ∇2(u0 + ψ) = 0 | (9) |
Since both u0 and ψ are radially symmetric, we can easily solve eqn (9)-Laplace equation for u0 + ψ to obtain
 | (10) |
| ψ = αψ1 + βψ2 | (11) |
| (A1) ψ1(b) = 1, ψ1(1) =0 | (12) |
| (A2) ψ2(b) = 0, ψ2(1) = 1 | (13) |
Note that ψ1 is higher on the inner wall and ψ2 is higher on the outer wall. Similarly we can decompose the velocity and the flow rate
| u0 = αu1 + βu2 | (14) |
| Q0 = αQ1 + βQ2 | (15) |
The solutions ψ1 and ψ2 are radially symmetric, and so we can recast eqn (8) in polar coordinates
 | (16) |
This is the modified Bessel equation of order 0 (see, e.g., ref. 22, p. 71).
(A1) The solution ψ1 to eqn (16) can be obtained in terms of the modified Bessel functions with the boundary condition (12)
 | (17) |
 | (18) |
From eqn (7), (17) and (18), we may derive the flow rate,
 | (19) |
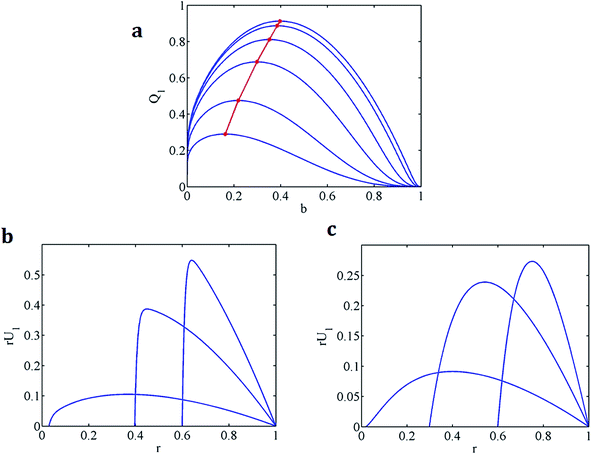
Since Q1 is zero at b = 0 and b = 1. There must be a maximum flow rate as the inner radius increases from zero. We see from eqn (19) that given K, Q1 is a function of b. Fig. 2a shows the EO flow rate Q1 versus b at different values of K. Note the logarithmic rise in flow as inner radius b increases from zero. Two velocity distributions (cf. eqn (18)) are presented in Fig. 2b and c. Fig. 2a shows that for all K values, the flow rate Q1 rapidly rises to the maximum as b increases from zero, then the flow rate decreases to zero with continuing increase of b. And the optimum inner radius b for maximizing Q1 obviously becomes larger at larger K. Fig. 2b shows that the maximal velocity occurs near the inner wall (i.e. the wall which has the higher zeta potential). Fig. 2b and c show that for larger K, the entire velocity profile is higher, and the location of the maximum velocity is closer to the inner wall. Note that in Fig. 2b and c, these plots are drawn for ru1 instead of u1 for easily seeing the contribution of the velocity to the EO pumping rate.
(A2) Next we study the case when the outer wall has unity zeta potential and the inner wall zeta potential is zero. The solution for ψ2 to eqn (16) with the boundary condition (13) is given by
 | (20) |
From eqn (10) and (13), we have
 | (21) |
From eqn (7), (20) and (21), we can obtain the flow rate,
 | (22) |
Fig. 3a shows the variations of the flow rate Q2 with respect to b for different K. The introduction of even a small core causes a logarithmic decrease of the flow rate. Fig. 3b shows the corresponding velocity distribution that the larger K, the larger velocity and closer the location of the maximum velocity to the outer wall (i.e. b = 1, the wall which has the higher zeta potential).
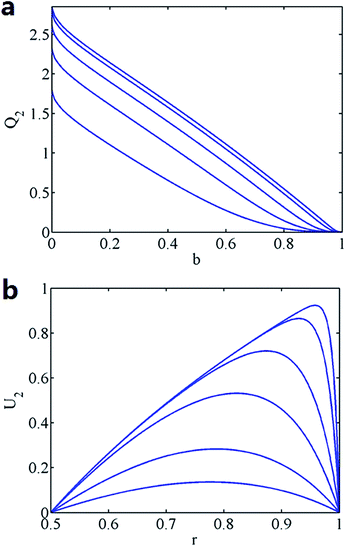 | ||
| Fig. 3 (a) Q2 versus b (from top: K = 100, 50, 20, 10, 5). (b) The velocity distribution in the tube for b = 0.5 (from top: K = 100, 50, 20, 10, 5, 3). | ||
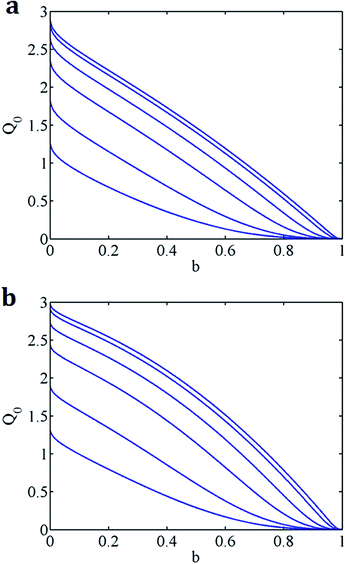 | ||
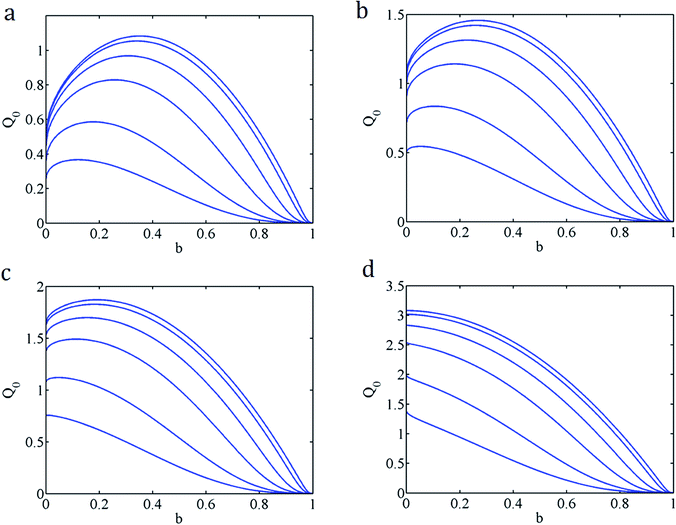
| Fig. 4 (a) Q0 versus b for α = 0.1, β = 1 (from top: K = 100, 50, 20, 10, 5, 3). (b) Q0 versus b for α = 0.5, β = 1 (from top: K = 100, 50, 20, 10, 5, 3). | ||
Fig. 5a–d shows the flow rate Q0 with varying b for different K, α = 1 and β ≤ 1. From the results, we find that if the zeta potential on the outer wall is equal or larger than that on the inner wall, the maximum flow always occurs when b = 0, or without the inner cylinder. If the zeta potential on the inner wall is larger than that on the outer wall, adding an interior core may increase the flow rate, but only if the value of K is large enough. It is noted that if both walls have the same zeta potential (α = β = 1), a core only hinders the flow. If α = 1, β < 0.3, then adding a core is beneficial for the values of K ≥ 3.
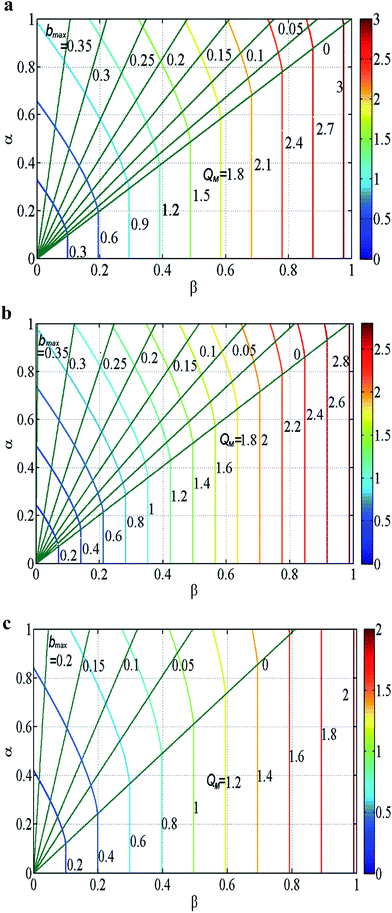
Fig. 6a–c presents selected maps for the maximal EO flow rate QM(α,β)-specified by the level curves, and its corresponding optimal radius bmax for K = 100, 20, 5. The level of QM increases toward the right upper corner as both α and β are increased. It is noted that in the upper left of b = 0 of these maps, adding a core would effectively increase the flow rate. Conversely, in the bottom right of b = 0, a core would absolutely hinder the EO flow. If α < β, we always have the maximal EO flow rate when there is no inner core (b = 0). However, if α > β, we may optimize the EO pumping rate with respect to b. The most interesting finding is that for large K (=100) the bmax that optimizes the EO pumping shifts in the manner of an expansion fan of straight lines from bmax = 0 at α/β = 1 to 0.4 at α/β = ∞ (β = 0). The pattern of straight lines in bmax of these maps is reasonable because QM(α,β) should depend on the ratio of α and β, not on their individual magnitudes. For a smaller K, the fan starts at a larger α/β (=1.22 for K = 5), and terminates at a smaller bmax (=0.22 for K = 5) at α/β = ∞ (β = 0). As we increase the nonlinearity λ, bmax moves to a larger value; this trend is more significant for smaller K (=5), and is very little for large K (=100).
3.2 Unsteady starting EO flow in an annulus
Following the approach of Chang and Wang,16 we may decompose the velocity for the transient state,| u = u0 − ũ | (23) |
Substituting eqn (23) and (9) in eqn (4), we have
| ũt = ∇2ũ, t > 0 | (24) |
Let
 | (25) |
Eqn (24) gives
 | (26) |
The solution is
| fn(r) = Y0(γn)J0(γnr) − J0(γn)Y0(γnr) | (27) |
| Y0(γn)J0(γnb) − J0(γn)Y0(γnb) = 0 | (28) |
From the asymptotic expansion of Bessel function,22 we have
 | (29) |
Table 1 shows that the approximation (29) compares well with those computed with great accuracy, in particular, at larger b or greater n.
| n\γn | b = 0.1 | b = 0.25 | b = 0.5 |
|---|---|---|---|
| 1 | 3.315(3.491) | 4.098(4.189) | 6.246(6.283) |
| 2 | 6.858(6.981) | 8.324(8.378) | 12.55(12.57) |
| 3 | 10.38(10.47) | 12.53(12.57) | 18.84(18.85) |
| 4 | 13.89(13.96) | 16.73(16.76) | 25.12(25.13) |
| 5 | 17.39(17.45) | 20.92(20.94) | 31.41(31.42) |
| 13 | 45.35(45.38) | 54.44(54.45) | 81.68(81.68) |
| 14 | 48.84(48.87) | 58.65(58.64) | 87.96(87.97) |
| 15 | 52.34(52.36) | 62.82(62.83) | 94.25(94.25) |
The orthogonality of the Bessel functions fn gives
 | (30) |
| cn = {[Y0(γn)J1(γn) − J0(γn)Y1(γn)]2 − b2[Y0(γn)J1(γnb) − J0(γn)Y1(γnb)]2/2} | (31) |
Recall the two fundamental problems for steady flow where we have set
(A1) u0 = u1 for (α,β) = (1,0)
(A2) u0 = u2 for (α,β) = (0,1)
The relationships: eqn (11), (14) and (15) are also valid for transient solution. Let
| ũ = αũ1 + βũ2 | (32) |
 | (33) |
(A1) For ψ = ψ1, eqn (18) and the D–H approximation (8) give
 | (34) |
Note that ũ1 is the velocity deficit for ψ = ψ1; then we recall eqn (25) and write
 | (35) |
At t = 0, we have
 | (36) |
Substituting (36) in eqn (34), and using eqn (30), we obtain
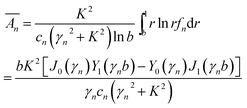 | (37) |
(A2) For ψ = ψ2, eqn (21) and the D–H approximation (8) give
 | (38) |
Now that ũ2 is the velocity deficit for ψ = ψ2; then we recall eqn (25) and write
 | (39) |
At t = 0, we have
 | (40) |
Substituting (40) in eqn (38), and using eqn (30), we obtain
 | (41) |
After solving (A1) and (A2) for the transient problems, we may obtain the general solution for the velocity deficit from eqn (32)
 | (42) |
 | (43) |
 ,
,  are given by eqn (37) and (41), respectively, fn are given by eqn (27), and γn are given by eqn (29).
Then we have the transient velocity and EO flow rate for the general pair of zeta potentials (α,β)
| u = u0 − ũ | (44) |
Q = Q0 − ![[Q with combining tilde]](https://www.rsc.org/images/entities/i_char_0051_0303.gif)
| (45) |
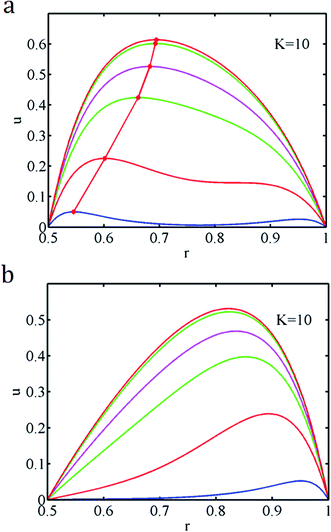
Fig. 7a and b shows some typical velocity distributions u at various times while different zeta potentials develop on the two walls for K = 10, b = 0.5. It is seen that the entire velocity increases as time evolves, and finally reaches the steady state. The electric double layer (EDL), a thin layer next to the solid walls, serves as the sole pumping unit of the EO flow when the external voltage is applied. Hence the EO pumping first appears near the walls at initial times, then the pumping gradually extends to the center of the gap by diffusion of momentum. The location of the maximal velocity is close to the wall that has the higher zeta potential at all times, but shifts away from that wall as time evolves.
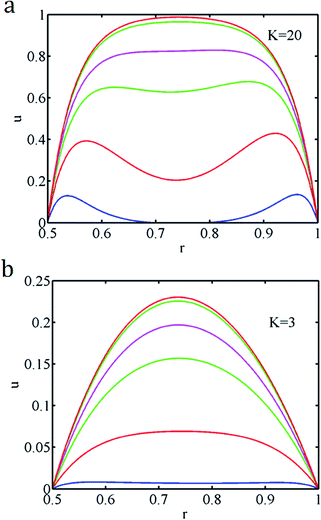
Fig. 8a and b shows some typical velocity distributions u at various times while we have the same zeta potential on the two walls for K = 20 and 3 with fixed b = 0.5. A large K indicates a relatively thin EDL, therefore for large K the EO flow only appears near the walls, and the electrolyte near the channel center would not be influenced at initial times. From Fig. 8a and b, we can see that for large K there are two maxima of the velocity near the walls at small times after the flow is started, but eventually there is only one maximal velocity as both maxima shifts towards the channel center as time evolves. On the other hand, for small K there is only one maximal velocity soon after the flow is started.
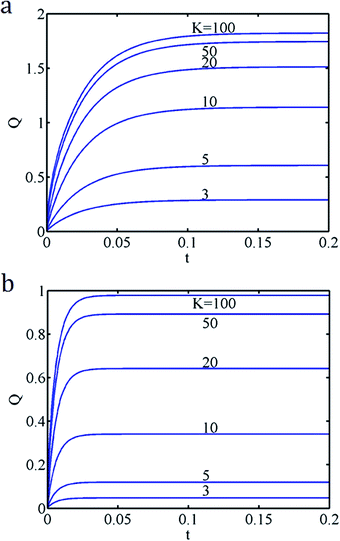
Fig. 9a and b shows the temporal evolutions of the flow rate Q for different K and b with α = 0.5 and β = 1. As shown in these plots, the flow rate reaches the steady state at the same time for all K values. This is consistent with eqn (42) which shows that the transient time is dominated by 1/γ12 and is independent of K, but almost linear in (1 − b) (cf. eqn (29)), namely, the smaller b, the greater the transition time. In addition, the EO flow rate for larger K increases more rapidly than that for smaller K at initial stages of flow development though the transient-time scales are the same.
4 Extension to the Poisson–Boltzmann equation
For higher zeta potentials (λ![[left double angle bracket]](https://www.rsc.org/images/entities/char_27ea.gif) 0), the DHA is no longer valid, the analysis must be performed based on the nonlinear P–B equation.
0), the DHA is no longer valid, the analysis must be performed based on the nonlinear P–B equation.
It is difficult to solve nonlinear equations, but once we have solved the linear DHA, there are several approaches to extend the results to the nonlinear P–B equation. Here we employ the method of homotopy. The method of homotopy is powerful, accurate and suitable for many highly nonlinear problems.23 Recently, homotopy methods have been widely applied to the fields of science, economics24 and engineering.25 This method proves to be very efficient in leading to convergent results compared to some traditional numerical methods.26 In this study, we combine Newton's and homotopy methods to solve the nonlinear Poisson–Boltzman equation.
4.1 Method of homotopy
The boundary conditions are| ψ(b) = α, ψ(1) = β | (46) |
Define
 | (47) |
| L(ψ) = ∇2ψ − K2ψ | (48) |
Introduce the homotopy function
| H(ψ,s) = sF(ψ) + (1 − s)L(ψ) | (49) |
The “end conditions” are given by eqn (47) and (48)
| H(ψ,0) = L(ψ) = 0 | (50) |
| H(ψ,1) = F(ψ) = 0 | (51) |
The general idea of homotopy is to start with the known solution for eqn (50) (from DHA), and progressively approach to the final solution for the P–B eqn (51) by solving the homotopy eqn H(ψ,s) = 0 with gradually increasing the homotopy parameter s to ensure convergence of the solution at each increment of s.
Let 0 = s0 < s1 < … < sM = 1, M is an arbitrary integer. In this study, it is sufficient to set M = 5, and take s1, s2, s3 and s4 are 0.2, 0.4, 0.6 0.8, respectively.
(A) For s = s0, there is H(ψ0,s0) = L(ψ0) = 0, with ψ0(b) = α, ψ0(1) = β.
And the initial solution is
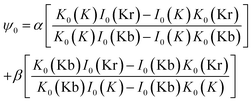 | (52) |
(B) For s = s1, there is
| H(ψ1,s1) = s1F(ψ1) + (1 − s1)L(ψ1) = 0 with ψ1(b) = α, ψ1(1) = β | (53) |
 | (54) |
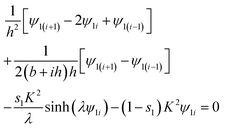
The nonlinear equation H(ψ1,s1) = 0 is then discretized by the central finite difference. Let h = (1 − b)/N, i = 1 ∼ (N − 1), eqn (54) becomes
Or, we can simply put it in the compact form
| H = Aψ1 + G = 0 | (55) |
| ψ1(j + 1) = ψ1(j) − J−1H[ψ1(j)] | (56) |
 and
and(C) Repeat the process B for s = s2, s = s3… until sM = 1 to obtain the nonlinear solution ψ = ψM for the P–B equation.
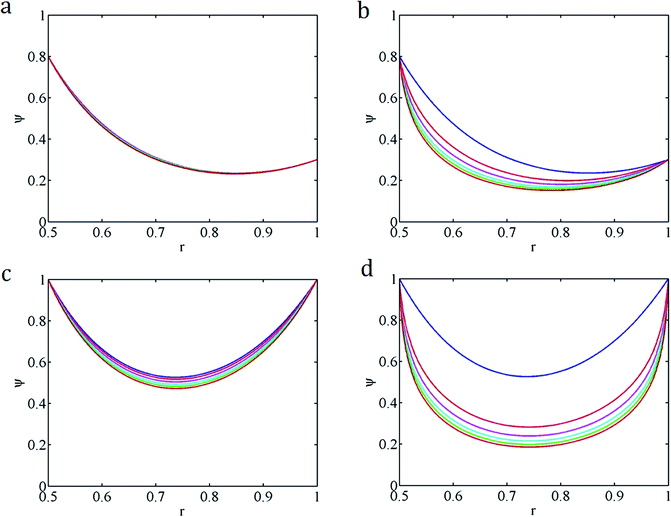
Fig. 10a–d shows the iterated solutions for the EDL potentials of s0 ∼ s5 with K = 5, b = 0.5 for several pairs of (α,β). As shown in these figures, the linear D–H approximation remains a good approximation for small λ. Yet, the discrepancy between DHA and PBE is getting large as λ is further increased. In addition, from these figures we can also see clearly that a larger λ corresponds to a stronger zeta potential in the entire channel, especially at the center, and the EDL is more tightly restricted in a thin layer next to the channel walls.
4.2 Steady flow
From eqn (4) we still have ∇2(u0 + ψ) = 0 for the steady state of P–B equation, and the general solution for eqn (9) with u0 + ψ = α for r = b and u0 + ψ = β for r = 1 is given by
 | (57) |
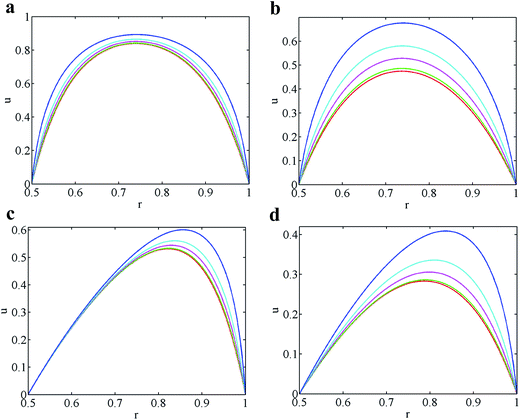
As an illustration, let us fix b = 0.5. Fig. 11a–d shows the velocity distributions of the P–B equation with various λ for K = 10 or 5. The result for the λ = 0 case is from the D–H approximation.
As expected, the maximal velocity occurs at the channel center for the symmetry condition (α = 1, β = 1). The location of the maximal velocity is closer to the wall that has the higher zeta potential for the unsymmetric condition (α = 0, β = 1). The EO pumping rate increases with increasing λ, and the increase is more efficient at smaller K.
4.3 Unsteady starting flow
Again we write u = u0 − ũ, at t = 0. Eqn (57) gives
 | (58) |
Using eqn (30), we find
 | (59) |
Then we have the velocity and flow rate in unsteady state from eqn (25) and (7). Fig. 12 shows typical velocity distributions at various times while the two channel walls develop the same zeta potentials (α = β = 1) on two walls for λ = 5 with K = 10 and b = 0.5. As shown in Fig. 12, there are two maxima of the velocity near the walls at small times after flow is started, but there is only one maximal velocity near the center at the steady state.
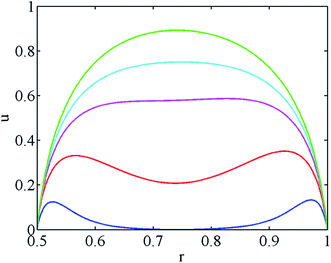 | ||
| Fig. 12 The transient velocity distributions at various times associated with PBE (λ = 5) with α = β = 1, K = 10 and b = 0.5 (from bottom, t = 0.001, 0.01, 0.03, 0.05, 10). | ||
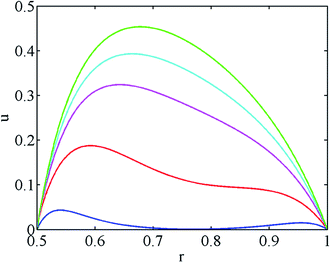
Fig. 13 shows typical velocity distributions at various times while there are different zeta potentials on the two channel walls for λ = 2 with K = 10 and b = 0.5. It is seen that the velocity increases gradually as time evolves, and finally reaches the steady state, and the location of the maximal velocity is at all times close to the wall which has the higher zeta potential.
 | ||
| Fig. 13 The transient velocity distributions at various times associated with PBE (λ = 2) for α = 0.8, β = 0.3 with K = 10 and b = 0.5 (from bottom, t = 0.001, 0.01, 0.03, 0.05, 10). | ||
Fig. 14a and b shows variations of the flow rate Q0 with increasing t for different K and λ, and α = β = 1, b = 0.5. From these curves, we see that the transient time scale is independent of λ though the flow rate is larger for larger λ. In addition, for a smaller K the flow rate increases rapidly as λ increases, but the influence of λ will be diminishing for larger K.
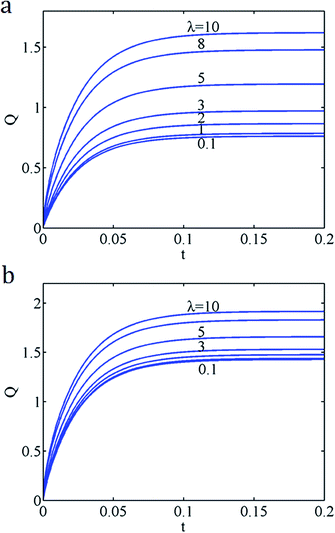 | ||
| Fig. 14 (a) K = 5, α = β = 1, b = 0.5 (from bottom, λ = 0.1, 1, 2, 3, 5, 8, 10). (b) K = 10, α = β = 1, b = 0.5 (from bottom, λ = 0.1, 1, 2, 3, 5, 8, 10). | ||
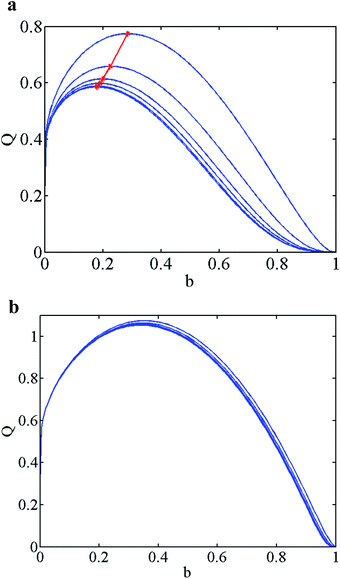
Fig. 15a and b shows variations of the flow rate Q0 versus b for different λ with K = 5, α = 1 and β = 0.1. It is seen that the flow rate Q rapidly rises to the maximum as b increases from zero, then decreasing to zero with further increasing b. From Fig. 15a and b, we can also see that for this small K = 5, the flow rate Q could be markedly increased by increasing λ, but the influence of the nonlinearity is diminishing for large K. In addition, it is indicated in Fig. 15a that increasing the nonlinearity λ shifts the optimum inner radius toward a larger value.
Table 2 shows the optimum sizes of the core for various λ and K. Apparently, increasing λ would increase the optimum radius bmax and the corresponding flow rate QM. For a small K, the nonlinearity markedly shifts the optimum radius bmax and increases the flow rate QM, yet this effect is small for larger K. In addition, at smaller λ (≤2), the nonlinearity has little effect on the optimum radius bmax and the flow rate QM, and conversely for large λ that effect is very much significant.
| λ\K | 5 | 10 | 20 | 100 |
|---|---|---|---|---|
| 0 | 0.1779 | 0.2575 | 0.309 | 0.352 |
| (0.585) | (0.8286) | (0.9677) | (1.0821) | |
| 0.1 | 0.178 | 0.2575 | 0.309 | 0.352 |
| (0.5855) | (0.8287) | (0.9678) | (1.0821) | |
| 1 | 0.1804 | 0.2588 | 0.3097 | 0.3522 |
| (0.5883) | (0.8308) | (0.969) | (1.0823) | |
| 2 | 0.1877 | 0.2628 | 0.3117 | 0.3526 |
| (0.5981) | (0.8374) | (0.9728) | (1.0831) | |
| 3 | 0.1991 | 0.2685 | 0.3148 | 0.3532 |
| (0.614) | (0.8476) | (0.9785) | (1.0842) | |
| 5 | 0.2269 | 0.2825 | 0.3219 | 0.3546 |
| (0.6587) | (0.8741) | (0.9927) | (1.0867) | |
| 10 | 0.2842 | 0.312 | 0.3368 | 0.3572 |
| (0.7743) | (0.9345) | (1.0228) | (1.0915) |
5 Concluding remarks
In this study, we presented semi-analytical solutions of steady and unsteady starting EO flow for an annulus channel. The two channel walls may develop different zeta potentials (α at the inner r = b and β at the outer r = 1). The problem for this simple geometry is actually complicated by five physical parameters, the pair of zeta potentials (α, β), b – the ratio of the inner to outer radii, K – the electrokinetic width as well as λ which measures the nonlinearity of the P–B equation. It is certainly worthy of having some analytical solutions for such a problem with many parameters.Our closed-form solutions for steady EO flow under DHA are more compact and convenient than previously reported by other authors. In addition, we obtained the analytical series solution for the transient starting EO flow, and numerically extended the results to the P–B equation by the method of homotopy. The EO flow in an annulus channel has some distinguished features, which could be summarized as follows.
(1) If the zeta potential on the outer wall is equal or larger than that of the inner wall, introduction of an interior core would always hinder the flow. If the zeta potential on the inner wall is larger, an interior core may increase the flow rate, but only if the value of K is large enough or β < 0.3.
(2) For large K, the EDL is a thin layer next to the solid walls so that the maximal velocity occurs near the wall right after the flow is started, but its location eventually shifts towards the center of the channel. For the steady EO flow with α = β, the maximal velocity has a location very close to the channel center, but the location is closer to the wall that has the higher zeta potential if α ≠ β.
(3) A small K indicates a relatively thick EDL that the charge distributes more widely across the channel. For the case of α = β, the location of the maximal velocity is at the channel center soon after the flow is started. The unsteady velocity profile has a more uniform distribution compared to the case of a larger K.
(4) The EO flow reaches the steady state at the same transient time for all K values with a given channel geometry. But the smaller b, the greater the transition time. This is consistent with the analysis that the transient time is dominated by 1/γ12 ∼ (1 − b)2. In addition, the EO flow rate for larger K increases faster than that for smaller K at the initial stage of flow development though the transient times are the same.
(5) A larger λ means a stronger zeta potential with EDL tightly restricted in a thin layer next to the channel wall. There are two maxima of the velocity near the walls right after the flow is started, and then the location of the maximal velocity is shifting towards the channel center. For α ≠ β, the maximal velocity occurs at a location closer to the wall of higher zeta potential, and the lager λ, the closer the location is to the wall. The transient-time scale is independent of K and λ though the EO flow rate is larger at a larger K or λ. In addition, for a smaller K (=5, 10) the EO pumping rate increases significantly with increasing λ, but the effect of λ is diminishing for larger K (=20, 100).
(6) If α < β, we always have the maximal EO flow rate when there is no inner core (b = 0). However, if α > β, we may optimize the EO pumping rate with respect to b. The several maps on the α–β plane (Fig. 6a–c) present the important interesting results, and provides a useful guide for practical design. The main finding is that for large K (=100) the bmax that optimizes the EO pumping shifts in the manner of an expansion fan of straight lines from bmax = 0 at α/β = 1 to 0.4 at α/β = ∞ (β = 0). For a smaller K, the fan starts at a larger α/β (=1.33 for K = 5), and terminates at a smaller bmax (=0.21 for K = 5) at α/β = ∞ (β = 0). As we increase the nonlinearity λ, bmax moves to a larger value; this trend is more significant for smaller K (=5), and is very little for large K (=100).
As a final remark, the results of this study are mostly presented in dimensionless quantities. Yet they are readily transformed to their dimensional quantities with referring to the reference scales. For example, the reference time scale is ρL2/μ, which is about 10−8 s = 10 ns for L = 100 nm if we use the density and viscosity of water. This indicates that transport of electrolyte by EO pumping is very efficient for the duct on the size of nanoscales. Although the present results for the Debye–Hückel approximation are extended to the nonlinear Poisson–Boltzmann equation, in other realistic applications, one may need more accurate models to account for the physics and chemistry such as finite size effects, overlapped EDLs, etc.
Acknowledgements
This work was completed while the corresponding author (C. C. Chang) was visiting Guangxi University. The authors would like to thank the financial support by the Guangxi University and the Ministry of Science and Technology (Taiwan) under Project No. MOST 102-2221-E-002 -169 -MY3.References
- D. P. J. Barz and P. Ehrhard, Lab Chip, 2005, 5, 949–958 RSC.
- P. Watts and C. Wiles, Chem. Commun., 2007, 443–467, 10.1039/b609428g.
- L. OuYang, C. Wang, F. Du, T. Zheng and H. Liang, RSC Adv., 2014, 4, 1093–1101 RSC.
- Z. Yuan, A. L. Garcia, G. P. Lopez and D. N. Petsev, Electrophoresis, 2007, 28, 595–610 CrossRef CAS PubMed.
- Y. Jia, Y. Ren and H. Jiang, RSC Adv., 2015, 5, 66602–66610 RSC.
- D. Das, Z. Yan, N. V. Menon, Y. Kang, V. Chan and C. Yang, RSC Adv., 2015, 5, 70197–70203 RSC.
- N. Sasaki, T. Kitamori and H. B. Kim, Lab Chip, 2006, 6, 550–554 RSC.
- L. C. Jellema, T. Mey, S. Koster and E. Verpoorte, Lab Chip, 2009, 9, 1914–1925 RSC.
- M. A. Witek, S. Wei, B. Vaidya, A. A. Adams, L. Zhu, W. Stryjewski, R. L. McCarley and S. A. Soper, Lab Chip, 2004, 4, 464–472 RSC.
- R. Iyer, Part. Sci. Technol., 2001, 19, 219–228 CrossRef CAS.
- M. A. Hashim, S. Mukhopadhyay, J. N. Sahu and B. Sengupta, J. Environ. Manage., 2011, 92, 2355–2388 CrossRef CAS PubMed.
- S. Annamalai, M. Santhanam, S. Sudanthiramoorthy, K. Pandian and M. Pazos, RSC Adv., 2016, 6, 3552–3560 RSC.
- S. Annamalai, S. Selvaraj, H. Selvaraj, M. Santhanam and M. Pazos, RSC Adv., 2015, 5, 81052–81058 RSC.
- R. C. Wu and K. D. Papadopoulos, Colloids Surf., A, 2000, 161, 469–476 CrossRef CAS.
- H. K. Tsao, J. Colloid Interface Sci., 2000, 225, 247–250 CrossRef CAS PubMed.
- C. C. Chang and C. Y. Wang, Electrophoresis, 2008, 29, 2970–2979 CrossRef CAS PubMed.
- Y. Jian, L. Yang and Q. Liu, Phys. Fluids, 2010, 22, 207–216 Search PubMed.
- H. J. Butt, K. Graf and M. Kappl, Physics and Chemistry of Interfaces, Wiley, New York, 2003 Search PubMed.
- R. J. Nap, A. L. Božič, I. Szleifer and R. Podgornik, Biophys. J., 2014, 107, 1970–1979 CrossRef CAS PubMed.
- H. Bruus, Theoretical Microfluidics, Oxford University Press, 2008 Search PubMed.
- J. G. Santiago, Anal. Chem., 2001, 73, 2353–2365 CrossRef CAS PubMed.
- M. Abramowitz and I. A. Stegun, Handbook of mathematical functions with formulas, graphs and mathematical tables, U.S. Govt. Print. Off., 1965 Search PubMed.
- C. M. Bender and S. A. Orszag, Advanced mathematical methods for scientists and engineers, McGraw-Hill, New York, 1978 Search PubMed.
- K. L. Judd, Numerical Method in Economics, MIT Press, 1998 Search PubMed.
- F. Soltanian, M. Dehghan and S. M. Karbassi, Int. J. Comput. Math., 2010, 87, 1950–1974 CrossRef.
- T. M. Wu, Appl. Math. Comput., 2005, 168, 1169–1174 CrossRef.
| This journal is © The Royal Society of Chemistry 2017 |

