 Open Access Article
Creative Commons Attribution 3.0 Unported Licence
Stability, CO2 sensitivity, oil tolerance and displacement efficiency of polymer enhanced foam†
Wanfen Pu*,
Peng Wei *,
Lin Sun and
Song Wang
State Key Laboratory of Oil and Gas Geology and Exploitation, South West Petroleum University, Chengdu, Sichuan 610500, China. E-mail: pwf58@163.com; shibadin@qq.com
First published on 18th January 2017
Abstract
This paper focuses on the benefits of polymers that contribute to foam flooding, such as foam stability, carbon dioxide (CO2) sensitivity, oil tolerance and displacement efficiency. From the results, polymer enhanced foam was found to have a high stability and an insignificant coalescence mainly because of the high viscous force and strong foam films. Some significant improvements of foam properties were observed in the polymer enhanced CO2 foam, especially in a supercritical state (16 MPa, 90 °C), and polymer enhanced foam showed remarkable oil tolerance because of the fact that the stable emulsion was uniformly dispersed in liquid films. Furthermore, polymer enhanced foam could promote mobility control and increase the liquid division and enhanced oil recovery in a strong heterogeneous formation.
1. Introduction
When foam acts as a high viscosity fluid, it is able to produce considerable control of gas mobility.1,2 Accompanied by unique features (i.e., increase of foam stability with permeability and water saturation in porous media),3,4 foam can block the high-permeability region, and thus, create fluid diversion into the low-permeability regions, and can also contribute to plugging the high water-cut channels and thereby improve the swept volume of the high residual oil areas. These phenomena indicate that foam tends to develop a selective flow in reservoirs and boosts the swept volume with a high degree of recovery.Foam, stabilized only by surfactant adsorption, has a relatively poor stability, which can hardly meet the harsh reservoir conditions (e.g., severe heterogeneity).5 Therefore, it is of vital importance to employ some foam stabilizing agents, such as water soluble polymers, which have been extensively employed as oil displacement agents in enhanced oil recovery (EOR) projects.6,7 As a macromolecule, the role of the polymer is to modify the rheological behavior of foam films.8 Huh and Rossen stated that the apparent viscosity of foam is determined by the rheological behavior of the polymer–surfactant solution.9 Meanwhile, the drainage process of bulk foam is highly dependent on the viscosity of liquid phase. The rheological properties can be influenced by many factors, e.g., concentration, molecular properties, temperature and salinity.10,11 Furthermore, in carbon dioxide (CO2) foam, the polymer–surfactant mixtures can produce more intermolecular associations because of the introduction of polar groups, which may be beneficial to improvement of the apparent viscosity.12
In the porous media, Romero et al. found that the adverse effect of capillary pressure and coalescence on polymer enhanced foam is less significant compared to that on surfactant foam, indicating that the presence of polymer contributes to the stability of the foam.13 As many researchers have claimed, the stability of foam is markedly improved by adding polymer into the oil-bearing environment, in which the polymer plays two roles. Firstly, the oil droplets are not inclined to spread at the surface mainly because of the viscous resistance.14 Secondly, a high strength emulsion can be created because of the interaction of polymer and surfactant, which is beneficial to stabilization of the foam films.15 In heterogeneous formation, Telmadarreie and Trivedi believed that the polymer causes the stability of gas bubbles (or foam films) in the high-permeability region and increases the fluid diversion, which significantly improves the injection pressure and the EOR.16 In addition, Liu et al. have shown that the polymer enhanced foam favors the displacement of the high viscous oil because of the high solution viscosity.5
The primary objective of this research was to systematically investigate the stability, the CO2 sensitivity, the oil tolerance and the displacement efficiency of polymer enhanced foam at a fixed high temperature (90 °C), which have seldom appeared together in previous studies. Firstly, a zwitterionic surfactant, cocamidopropyl hydroxyl sulfobetaine (CHSB) was chosen for the foaming work, and then different polymers were added to determine the best stabilizer. Secondly, the stability of the polymer enhanced foam was studied considering three aspects: different types of polymer, polymer concentration and microstructures. Thirdly, CO2 sensitivity and oil tolerance of polymer enhanced foam was studied, respectively. Finally, the mobility control and displacement efficiency were discussed in relation to heterogeneous formation with different permeability ratios.
2. Experimental section
2.1 Materials
CHSB was supplied by KeLong Industry Ltd (Chengdu, China), and was used as a foaming agent because of its high temperature tolerance, and the molecular schematic diagram of this is presented in a previous study by Sun et al.17 The polymers used in the research, i.e., anionic polyacrylamide (APAM) were supplied by Hengju Industry Ltd (Beijing, China): APAM-1 (molecular weight of 2 × 10⁶ g mol−1), APAM-3 (molecular weight of 5 × 10⁶ g mol−1), and APAM-9 (molecular weight of 7 × 10⁶ g mol−1) nonionic polyacrylamide (NPAM) was supplied by Hengju Industry Ltd (Beijing, China): NPAM-2 (molecular weight of 5 × 10⁶ g mol−1), NPAM-4 (molecular weight of 6 × 10⁶ g mol−1), and NPAM-5 (molecular weight of 8 × 10⁶ g mol−1). Xanthan gum (XG; molecular weight of 1–2 × 10⁶ g mol−1): XG-1 was supplied by Minbo Industry Ltd (Zhengzhou, China), XG-2 was supplied by Zhengmin Industry Ltd (Shijiazhuang, China), and XG-3 was supplied by Hongfei Industry Ltd (Renqiu, China). The formation water was simulated by mixing sodium chloride, calcium chloride and magnesium chloride (salinity was about 2.1 × 10⁴ mg l−1, calcium and magnesium concentration to 850 mg l−1). Crude oil used in the research was supplied from an oilfield in China, and had a viscosity of 15.6 mPa s at 90 °C. CO2 and nitrogen (N2) were supplied by Xinju Ltd. (Chengdu, China), with a purity of 99.9 wt%. The sand cores in this study were supplied by the Northeast Petroleum University (China), and their parameters are shown in Table 1.| Core no. | Permeability (mD) | Porosity (%) | Permeability ratio | Initial oil saturation (%) |
|---|---|---|---|---|
| 1 | 43.2 | 21.2 | 3 | 65 |
| 128.5 | 29.6 | 76 | ||
| 2 | 39.1 | 19.5 | 1.5 | 66 |
| 58.7 | 24.1 | 72 | ||
| 3 | 41.5 | 20.3 | 3 | 62 |
| 124.9 | 30.6 | 80 | ||
| 4 | 48.6 | 22.5 | 6 | 63 |
| 296.5 | 36.2 | 84 | ||
| 5 | 35.3 | 18.3 | 12 | 64 |
| 420.1 | 39.7 | 85 |
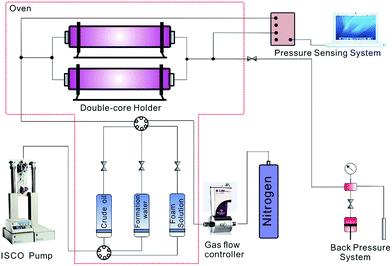
2.2 Experiment setup and procedures
3. Results and discussion
3.1 Foam properties of CHSB
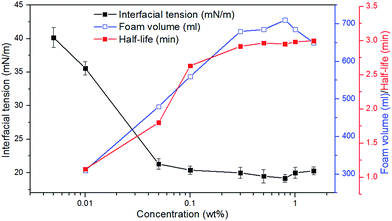
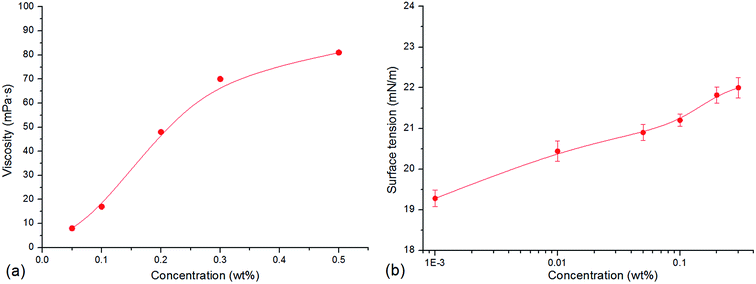
As shown in Fig. 2, with increase in the concentration of CHSB, the surface tension reduces sharply, and the foam volume and half-life increase significantly. An inflexion is observed at 0.05 wt% and then the surface tension changes smoothly when the concentration exceeds to 0.05 wt%, indicating that the critical micelle concentration (CMC) of CHSB is about 0.05 wt% (i.e., 0.9–1.1 mM, and this is consistent with the results of Zhao et al.18), which is less than found using other surfactants (e.g., sodium dodecyl sulfate and cetrimonium bromide).19,20 This is because the hydrophilic groups [i.e., sulfonate (SO3−), hydroxyl (OH−) and amino (N+)] make the foam more surface active. Meanwhile, the foam volume and half-life increase dramatically at first and then level off as the concentration increases. The inflexions of foam volume and half-life are around 0.2 wt%, which is much larger than the inflexion of surface tension (i.e., CMC). This is because the generation of foam requires a lot of surfactant adsorptions, thus, the stable foam can be created when the amount of surfactants is considerably larger. In addition, after the concentration rises up to 0.8 wt%, a modest increase of surface tension appears and a reduction of foam volume occurs. It is thought that the surface adsorption behavior is perturbed by excessive surfactant molecules, and results in the reduction of foaming ability.3.2 Stability of polymer enhanced foam
3.3 CO2 sensitivity of foam under high pressure
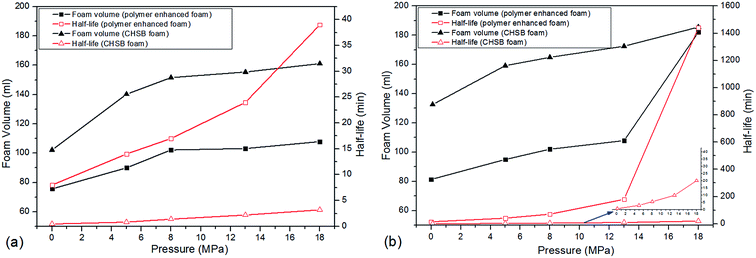
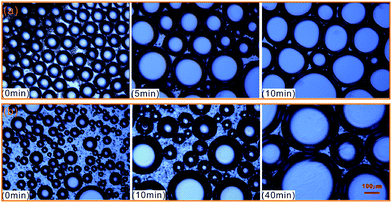
In this section, two foam systems were adopted (CHSB foam and polymer enhanced foam) and then the high pressure bulk foam tests were conducted with two types of gas (i.e., N2 and CO2). As shown in Fig. 7(a), with the increase of N2 pressure, both foam volume and half-life all showed rising trends, and the half-life of the polymer enhanced foam increased significantly. Polymer enhanced foam displayed quite a high stability at 18 MPa (i.e., the half-life is 39 min). From Fig. 7(b), as with the N2 foam systems, the foam properties of CO2 foam tended to be enhanced with increase of pressure. However, some marked differences can be observed: (i) the half-life of CO2 foam systems is much larger than that of N2 foam systems; (ii) the foam properties of the polymer enhanced foam experience sharp rises when the pressure increases from 13 MPa to 18 MPa. The elevated pressures can greatly promote the solubility of CO2 in aqueous solution (e.g., more than 50 times higher than the N2 solubility24,25), and thus, the generated CO2 foam tends to be more stable because of the electrostatic interaction between amino (N+) ions in CHSB and hydrogen ions (H+) in the carbonated solution.26 Meanwhile, the good availability of CO2 causes it to generate more foam except in the dissolved fraction. A supercritical state is achieved at 13 MPa (T = 90 °C), above which CO2 is more miscible with the aqueous solution. Therefore, the foam volume is dramatically enhanced because of the vague interface of water and CO2 in this state, which shows a significant CO2 sensitivity.26 In addition, as shown in Fig. 8, the fine grained N2 bubbles were detectable under high pressure with the naked eye and polyhedral structures are gradually formed after 60 min, indicating that they coarsen obviously with the drainage of liquid. In contrast, the CO2 bubbles were too small or too dense to observe and still presented a uniform and fine grained appearance after 60 min, which shows a stronger long-term stability in the CO2 phase.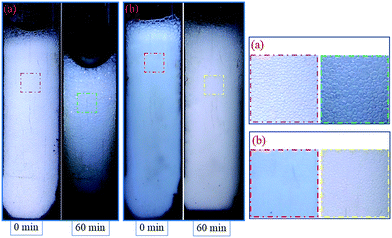 | ||
| Fig. 8 Appearance of polymer enhanced foam changes over time, N2 foam (a) and CO2 foam (b) at 5 MPa. | ||
To further determine the influence of polymer on the foam's CO2 sensitivity, the half-life ratio (η) of CO2 foam to N2 foam was calculated in CHSB foam and polymer enhanced foam, respectively. As shown in Fig. S2 (ESI†), the η of the polymer enhanced foam increased from 8 to 37 at 18 MPa, and it was equivalent to seven times that of CHSB foam. This indicates that a strong synergistic effect was detected in polymer enhanced foam at the supercritical state, which greatly promoted the association of the polymer in foam films and thus improved the foam stability.27
3.4 Foam properties in oil-bearing
In this section, the effect of crude oil on foam properties are shown in Fig. 9. As can be observed from Fig. 9(a), two systems maintain the favorable foam properties within 15% of oil content, and foam properties decrease gradually as the oil content continues to increase. However, the foam volume of polymer enhanced foam shows an increasing trend with 20% oil content, indicating that the polymer acts as a foam booster in an oil-bearing environment. As shown in Fig. 9(b), the half-life ratio is near 8 in the absence of oil, and as oil is added to the foam system, it stays almost unchanged within 10% of oil content and then gradually increases to about 10 at 20%. Interestingly, the half-life ratio climbs sharply to 25 when 30% oil is added. These phenomena suggest that: (i) there is no significant effect of a slight amount of oil is found on foam properties (i.e., CHSB plays some role in the oil tolerance because of long alkane chain28); (ii) the polymer can drastically decrease the adverse effect of oil on foam stability when exposed to an extensive amount of oil.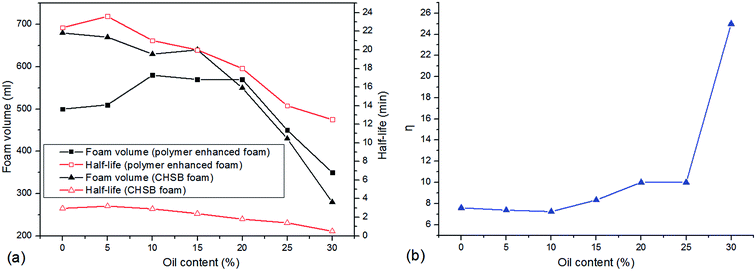 | ||
| Fig. 9 Foam properties as a function of oil content, (a) variations of foam volume and half-life, (b) the half-life ratio (η) of polymer enhanced foam to CHSB foam. | ||
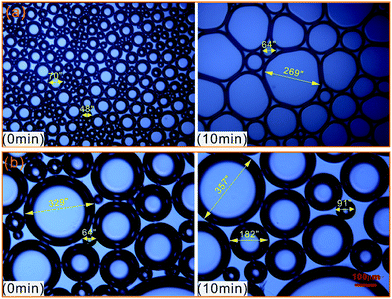
To further evaluate the effect of crude oil on foam, the microstructures of oil foam were visualized using LM. As shown in Fig. 10, gas bubbles of CHSB foam present a uniform size and are evenly distributed in the initial state, and oil droplets are gathered in foam films. In contrast, the oil-bearing polymer enhanced foam displays unequally distributed and different sized gas bubbles, and the oil droplets disperse evenly in foam films. Subsequently, the frequent coalescence was observed in the oil foam, especially in the CHSB foam. As shown in Fig. 11(a), the oil droplets were inclined to assemble in plateau borders of CHSB foam with the draining of liquid, and the accumulation of oil droplets merged into bigger droplets at a fast rate and finally form an oil band in the plateau border. From Fig. 11(b), it can be seen that the oil droplets of polymer enhanced foam are a smaller size and disperse uniformly in the matrix of foam films (i.e., oil-in-water emulsions), and can still keep their original morphology within 10 min. Furthermore, the accumulation of oil droplets are distributed in foam films instead of plateau borders. As a result, the crude oil can be emulsified into very small and stable particles in the foam films of polymer enhanced foam, and the coalescence of oil foam does not readily develop because of the steric effect and the high viscous force in the surfactant–polymer mixtures.
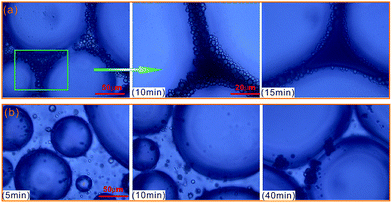 | ||
| Fig. 11 Microphotographs of oil drops as a function of time, and CHSB foam (a) and polymer enhanced foam (b). | ||
3.5 Foam flooding in heterogeneous cores
To evaluate the oil displacement characteristics of polymer enhanced foam in the simulated formation, four sets of foam flooding experiments (core no. 2–no. 5) were conducted in heterogeneous cores with different permeability ratios. As shown in Fig. 12, all the differential pressures were directly proportional to the injected volume of polymer enhanced foam, and the growing amplitude of differential pressure increases as the permeability ratio rises. During the subsequent water flooding, the variations of differential pressure are heightened with increasing permeability ratio. This is mainly because of the fact that the higher mobility reduction is imposed in the core with the larger permeability, that is, the more stable foam is generated in porous media with a larger spatial scale.28 As a result, polymer enhanced foam has a better ability to keep stable in the stronger heterogeneity, which could have a favorable impact on swept volume and oil recovery.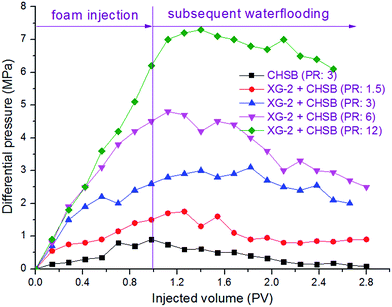 | ||
| Fig. 12 Changes of differential pressure in heterogeneous cores with different permeability ratios (PR). | ||
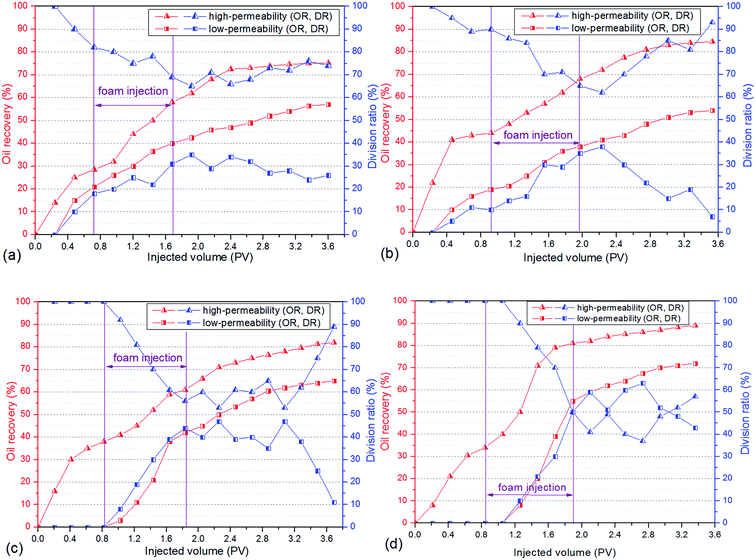
As shown in Fig. 13, the oil recovery of high-permeability core is 30–42% after water flooding, but with the increase of permeability ratio, the oil recovery of low-permeability core decreases from 20% to 0%, which indicates that oil tends to be produced in the high permeability core whereas the swept volume of the low permeability core is quite low. The remarkable variations of division ratio and oil recovery are observed in heterogeneous cores as a result of the injection of polymer enhanced foam, i.e., the division ratio of the low-permeability core increases to its maximum value (30–50%) and the oil production of the low-permeability core increases dramatically (36–72%). Meanwhile, the division ratio of the low-permeability core increases as the permeability ratio increases. These phenomena indicate that there is a significant development of flow diversion in heterogeneous cores when polymer enhanced foam is used, and this is mainly determined by the foam's higher mobility reduction in the stronger heterogeneity (as discussed in the previous paragraph). Because the foam gradually establishes the high flow resistance in the high-permeability core, the subsequent flow is forced to divert to the low-permeability core, and thus, displaces the residual oil. Furthermore, foam has been proven to perform excellently in the areas of low oil saturation and large spatial scale.29 Therefore, a large amount of crude oil is produced from both the high-permeability core and the low-permeability core, which leads to the result that the enhanced oil recovery increases as the heterogeneity gets stronger (see Table 2), especially in the low-permeability core. In addition, the stable fluctuation curves, where the division ratio of the low-permeability core is at a higher level during the subsequent water flooding, are shown in Fig. 13(c) and (d). This indicates that a long-term flow diversion is achieved by using the residual foam. Consequently, the obvious flow diversion and oil increase are achieved by using conducting polymer enhanced foam flooding in the heterogeneous formation, and the larger permeability ratio can promote the advantage of foam to carry out mobility reduction and oil recovery enhancement.
| Core no. | Permeability ratio | Foam system | EORa (%) | EORb (%) | EORc (%) |
|---|---|---|---|---|---|
| a Enhanced oil recovery in high-permeability core.b Enhanced oil recovery in low-permeability core.c Enhanced oil recovery in heterogeneous cores. | |||||
| 1 | 3 | CHSB foam | 30.5 | 25.4 | 26.8 |
| 2 | 1.5 | Polymer enhanced foam | 45.7 | 36.1 | 42.9 |
| 3 | 3 | Polymer enhanced foam | 41.5 | 38.2 | 40.8 |
| 4 | 6 | Polymer enhanced foam | 44 | 64.8 | 50.3 |
| 5 | 12 | Polymer enhanced foam | 55.3 | 71.9 | 61.2 |
To check the effect of polymer on the foam's displacement efficiency in the heterogeneous formation, CHSB foam flooding was also carried out using core no. 1. By comparison of the CHSB foam and polymer enhanced foam under the same conditions (i.e., the blue and black curves in Fig. 12), it was found that the differential pressure was still below 1 MPa after 1.0 PV of foam injection and this then decreased obviously during the subsequent injection of water, which indicated that CHSB foam is relatively weaker in the porous media and can hardly develop a long-term stability in the subsequent water flooding as polymer enhanced foam can. As shown in Fig. S3 (ESI†) and Table 2, the division ratio of the low-permeability core increased to about 20% after the CHSB foam was injected and the total enhanced oil recovery was 26.8%, which was far below the recoveries achieved using conducting polymer enhanced foam flooding. Therefore, CHSB foam was not effective in diverting the flow to the low-permeability zone and enhancing oil recovery in the heterogeneous formation, in other words, the addition of polymer to the surfactant foam did affect the regime of its displacement characteristics by greatly enhancing the foam stability in the porous media and improving the liquid diversion in the heterogeneous core formation.
4. Conclusions
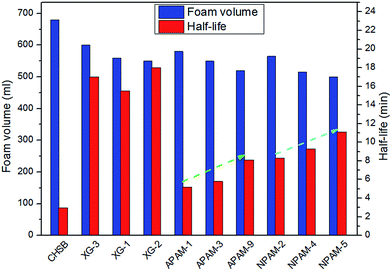
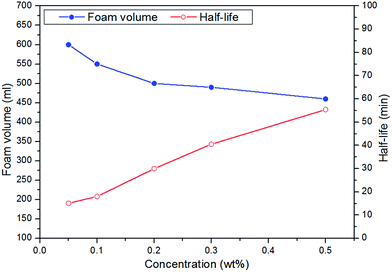
(1) The addition of different polymers presents an improvement in foam stability, in which the molecular weight of a specific polymer could play a role, and the CHSB/NPAM system was more stable than the CHSB/APAM system. The foam enhanced using XG-2 shows the best foam stability and an obvious enhancement was obtained with increasing concentration, and this mainly resulted from the high viscous force and strong foam films.(2) In the high temperature and high pressure reactor, CO2 foam has more favorable foam properties than N2 foam, and the stability of CO2 foam is greatly enhanced by adding polymers. Gas bubbles of CO2 polymer enhanced foam show a uniform and dense appearance under high pressure. The significant CO2 sensitivity of polymer enhanced foam can be observed in the supercritical state (at 90 °C and 16 MPa).
(3) In the presence of crude oil, CHSB foam is prone to coalescence and drainage because of the unstable oil drop in the liquid films. However, the crude oil tends to form a uniformly dispersed and stable emulsion in the liquid films of polymer enhanced foam, which shows a strong oil tolerance (especially with the oil content of 30%) compared with that of CHSB foam.
(4) The foam flooding experiment revealed that polymer enhanced foam can produce a higher differential pressure in formation with a stronger heterogeneity, and liquid diversion and the EOR can be significantly improved. With an increase of permeability ratio, the liquid diversion and oil production increase remarkably by using the polymer enhanced foam.
Acknowledgements
Special thanks to National Petroleum Corporation of China for supplying the formation water and the crude oil sample.References
- D. G. Huh and L. L. Handy, SPE Reservoir Eng., 1989, 4, 77–84 CrossRef CAS.
- R. F. Li, W. Yan and S. Liu, SPE J., 2010, 15, 928–942 CrossRef.
- R. D. Sydansk, SPE Adv. Tech., 1994, 2, 160–166 CrossRef.
- K. Mannhardt and I. Svorstøl, J. Pet. Sci. Eng., 1999, 23, 189–200 CrossRef CAS.
- Y. M. Liu, L. Zhang and S. R. Ren, SPE 179584, SPE Improved Oil Recovery Conference, Tulsa, Oklahoma, USA, April 2016, pp. 11–13 Search PubMed.
- S. Gou, T. Yin and L. Yan, Colloids Surf., A, 2015, 471, 45–53 CrossRef CAS.
- S. Gou, Y. He and Y. Ma, RSC Adv., 2015, 5, 51549–51558 RSC.
- D. Wang, Q. Hou and Y. Luo, J. Dispersion Sci. Technol., 2015, 36, 268–273 CrossRef CAS.
- C. Huh and W. R. Rossen, SPE J., 2008, 13, 17–25 CrossRef CAS.
- R. Baeza, C. C. Sanchez and A. M. R. Pilosof, Colloids Surf., B, 2004, 36, 139–145 CrossRef CAS PubMed.
- A. Olajire, Energy, 2014, 77, 963–982 CrossRef CAS.
- X. Xu, A. Saeedi and R. Rezaee, SPE 173716, SPE International Symposium on Oilfield Chemistry, The Woodlands, Texas, USA, April 2015, pp. 13–15 Search PubMed.
- C. Romero, J. M. Alvarez and A. J. Müller, SPE 75179, SPE/DOE Improved Oil Recovery Symposium, Tulsa, Oklahoma, April 2002, pp. 13–17 Search PubMed.
- X. Duan, J. Hou and T. Cheng, J. Pet. Sci. Eng., 2014, 122, 428–438 CrossRef CAS.
- L. Sun, W. Pu, J. Xin and P. Wei, RSC Adv., 2015, 5, 23410–23418 RSC.
- A. Telmadarreie and J. J. Trivedi, SPE J., 2016, 21, 321–334 CrossRef.
- L. Sun, P. Wei and W. Pu, J. Pet. Sci. Eng., 2016, 147, 485–494 CrossRef CAS.
- J. Zhao, C. Dai and Q. Ding, RSC Adv., 2015, 5, 13993–14001 RSC.
- A. I. Mitsionis and T. C. Vaimakis, Chem. Phys. Lett., 2012, 547, 110–113 CrossRef CAS.
- V. Bergeron, D. Langevin and A. Asnacios, Langmuir, 1996, 12, 1550–1556 CrossRef CAS.
- R. Petkova, S. Tcholakova and N. D. Denkov, Langmuir, 2012, 28, 4996–5009 CrossRef CAS PubMed.
- L. Sun, P. Wei and W. F. Pu, J. Dispersion Sci. Technol., 2015, 36, 1693–1703 CrossRef CAS.
- E. S. De Preval, D. Fabrice and M. Gilles, Colloids Surf., A, 2014, 442, 88–97 CrossRef.
- A. Chapoy, A. H. Mohammadi and A. Chareton, Ind. Eng. Chem. Res., 2004, 43, 1794–1802 CrossRef CAS.
- R. F. Weiss and B. A. Price, Mar. Chem., 1980, 8, 347–359 CrossRef CAS.
- D. Li, B. Ren and L. Zhang, Chem. Eng. Res. Des., 2015, 102, 234–243 CrossRef CAS.
- D. Rousseau, S. Renard and B. Prempain, SPE 154055, SPE Improved Oil Recovery Symposium, Tulsa, Oklahoma, USA, April 2012, pp. 14–18 Search PubMed.
- M. Simjoo, T. Rezaei and A. Andrianov, Colloids Surf., A, 2013, 438, 148–158 CrossRef CAS.
- H. Gao, Y. Liu and Z. Zhang, Energy Fuels, 2015, 29, 4721–4729 CrossRef CAS.
Footnote |
| † Electronic supplementary information (ESI) available. See DOI: 10.1039/c6ra27063h |
| This journal is © The Royal Society of Chemistry 2017 |

