 Open Access Article
Creative Commons Attribution 3.0 Unported Licence
A red emitting of manganese-doped boron carbon oxynitride (BCNO) phosphor materials: facile approach and photoluminescence properties
Bebeh W. Nuryadin*a,
Fitri A. Permatasarib,
Ade Y. Nuryantini c,
Irfana D. Faryunid,
Mikrajuddin Abdullahb and
Ferry Iskandar
 *be
*be
aDepartment of Physics, UIN Sunan Gunung Djati Bandung, Bandung 40614, Indonesia. E-mail: bebehwahid102@uinsgd.ac.id
bDepartment of Physics, Faculty of Mathematics and Natural Sciences, Institut Teknologi Bandung, Bandung 40132, Indonesia
cDepartment of Physics Education, UIN Sunan Gunung Djati Bandung, Bandung 40614, Indonesia
dDepartment of Physics, Faculty of Mathematics and Natural Sciences, Tanjungpura University, Pontianak, Indonesia
eResearch Center for Nanoscience and Nanotechnology, Institut Teknologi Bandung, Bandung 40132, Indonesia. E-mail: ferry@fi.itb.ac.id
First published on 17th January 2017
Abstract
BCNO (boron carbon oxynitride) phosphors have attracted attention due to their non toxicity, simple synthesis process, and high quantum efficiency. However, the tunable emission, particularly a red emission, is still challenging to achieve. In the present study, a bright red emission (emission wavelength 620 nm under 365 nm UV excitation) of a manganese-doped BCNO (BCNO:Mn) phosphor synthesized by a solid state method is reported. Without Mn-doping, the BCNO phosphor exhibited a bright blue emission that can be ascribed to the closed-shell BO− and BO2− anions that act as luminescence center. Via Mn-doping, a red emission was exhibited that can be ascribed to the 4T1(4G) → 6A1(6S) transition from a new luminescence center of Mn2+ incorporated into the BCNO host lattice. The optimum red PL properties (λem: 611 nm, λex: 365 nm) were obtained with BCNO:Mn at a molar ratio of Mn/B at 0.71% mol/mol synthesized at 550 °C. We believe that the BCNO:Mn is a promising red-emitting phosphor for white light diodes.
Introduction
Boron carbon oxynitride (BCNO) is one of the most attractive phosphor materials because of its excellent properties, such as non-toxicity, simple synthesis process, tunable color emission, and high quantum efficiency.1–3 These excellent properties of the BCNO phosphor offer a great potential application for light emitting diode (LED), panel displays, bio-imaging, and DNA labelling.3–5 The BCNO phosphor material, an intermediate material between graphite and hexagonal-BN, was first synthesized by our group using a urea combustion method.1 The main PL mechanism of BCNO is thought to be due to closed-shell BO− and BO2− anions that act as a luminescence center. Another PL mechanism of BCNO involves carbon and oxygen impurities that produce energy levels in the bandgap rather than inter-band transition or exciton emission. The original band gap of pristine BCNO was calculated to be around 5.8 eV.4 This wide band gap leads to red photoluminescence of BCNO phosphor still being a challenge to obtain.Several studies have been conducted concerning the attainment of red emission of the BCNO phosphor.5–8 Our group successfully obtained near red emission (∼571 nm) of BCNO by increasing the polyethylene glycol (PEG) fraction and decreasing the synthesis temperature (700 °C).6 The increased PEG fraction led to the presence of carbon defects in the crystal lattice of the BCNO phosphor through substitution or intercalation. Zhang et al., have reported red emission (∼620 nm) by increasing the sintering temperature, heating time and the ratio of boric acid to hexamethylenetetramine.7 Increasing the sintering temperature (650 °C) leads to nitrogen defects that act as electron traps in the BCNO lattice. Kang et al., reported a broad emission (from 400–750 nm) by converting graphene oxide into a BCNO hybrid nanosheet.8 The sheets may contain the BCNO, graphene quantum dots (GQDs), and graphene oxide. These three different chemical structures possess intrinsic state emission (electron–hole recombination, quantum size effect/zig-zag sites) and defect state emission (surface energy traps) as a luminescence center.
Red photoluminescence has not only been attempted with BCNO but also in other phosphor materials. An alternative to overcome this challenge is the use of manganese (Mn) as the dopant in phosphor materials.9–11 Numerous studies have reported successful red emission from Mn-doped phosphors such as Mn:LiAlO2,9 Mn:CaZnOS,10 and Mn:AlN.11 The Mn doped phosphors are expected to play an important role in red emission due to the d–d transitions in Mn.9–11 In addition, the presence of dopant atoms in the BCNO structure increases its quantum yield, as reported in other studies.12,13 To the best of our knowledge, the recent literature contains no reports regarding Mn-doping of BCNO phosphors.
In this study, we report the first synthesis of Mn doped BCNO from citric acid, boric acid, urea and manganese(II) sulfate monohydrate via a solid state method. Furthermore, we elucidated the influence of the synthesis temperature and Mn-doping concentration on the PL properties of BCNO:Mn using scanning electron microscopy (SEM), spectrofluorophotometry, and X-ray diffraction (XRD). Moreover, we considered the luminescence mechanism possibilities on the BCNO:Mn structure.
Experimental
Material and synthesis
A schematic flowchart for the manganese doped BCNO preparation via a solid-state method is shown in Fig. 1. Analytical reagents such as boric acid (H3BO3, Merck Co. Ltd.), citric acid (C6H8O7, Merck Co. Ltd.), urea ((NH2)2CO, Merck Co. Ltd.), and manganese(II) sulfate monohydrate (MnSO4·H2O, Merck Co. Ltd) were used as raw materials.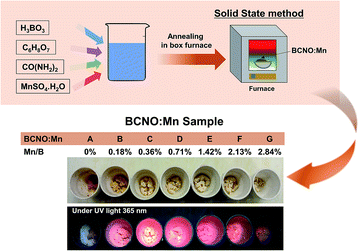 | ||
| Fig. 1 Schematic of BCNO:Mn synthetic process. The lower image shows the as-prepared BCNO:Mn phosphors synthesized at 550 °C with various Mn concentrations. | ||
A precursor was prepared by dissolving all raw materials in 10 mL pure water at 70 °C under stirring at 500 rpm for 10 min. For all samples, the mass of boric acid, urea and citric acid were fixed at 0.5 g, 2 g, and 0.01 g, respectively. Moreover, doping of Mn was conducted by varying the molar ratio of manganese to boron source (Mn/B) from 0 to 2.84% mol/mol. After sufficient stirring, the precursor solutions were heated in an electrical furnace with the temperature varying from 500 °C to 700 °C for 30 min under ambient atmospheric pressure.
Characterization
The chemical bonding of the prepared samples was determined by the Fourier transform infrared (FTIR, Bruker Optics, Ettlingen – Germany) spectroscopy method with an Alpha Platinum ATR sampling module. The crystal structure of the prepared samples was analyzed using an X-ray diffractometer (XRD Philips Analytical PW 1710 BASED, PANalytical, Netherlands) with a 0.02° step size using Cu Kα radiation (λ = 1.5406 Å). The morphologies of the prepared samples were observed using a scanning electron microscope (SEM, JEOL JCM-6000 Benchtop, Japan) at an operating voltage of 15 kV. The elemental mapping of the prepared samples was carried out with an energy dispersive X-ray spectroscope (EDXs JEOL JED-2300, Japan). The PL properties, PLE intensity and luminescence decay curves of the samples were characterized using a spectrofluorophotometer (Carry Eclipse, Agilent Ltd., Australia) equipped with a xenon laser source at room temperature.Results and discussion
Structural and optical properties of BCNO:Mn phosphor material
Preparation of BCNO from citric acid, boric acid and urea via a solid-state phase method has been reported; it exhibits blue photoluminescence under UV excitation.14,15 Herein, by adding manganese(II) sulfate monohydrate, with 0.18% to 2.84% Mn/B ratios (denoted as BCNO:Mn B–G) at various synthesis temperatures, the BCNO:Mn exhibited strong red photoluminescence under 365 nm UV lamp excitation, as shown in Fig. 1.A general overview of the structure of the BCNO:Mn samples under various conditions was obtained using FTIR and XRD, as shown in Fig. 2. The FTIR spectra (Fig. 2a) show the absorption peaks of various vibration modes in the 500–4000 cm−1 region for BCNO:Mn samples with various Mn concentrations. The B–N linkage, vibration at ∼789 cm−1 for the B–N–B vibration and ∼1400 cm−1 for B–N stretching16–18 were prominent in all the samples. The absorption peaks at ∼980 cm−1, ∼1010 cm−1, and ∼1200 cm−1 correspond to the N–B–O vibration, B–O–B, and B–O bonds, respectively.19 In addition, the absorption peaks at ∼1700 cm−1, ∼2230 cm−1, and 3200 cm−1 were induced by the C![[double bond, length as m-dash]](https://www.rsc.org/images/entities/char_e001.gif) N, C
N, C![[triple bond, length as m-dash]](https://www.rsc.org/images/entities/char_e002.gif) N, and O–H stretching vibrations, respectively. The presence of the same vibrations in all the samples indicates the appropriate structure in all BCNO:Mn samples at various Mn concentrations.
N, and O–H stretching vibrations, respectively. The presence of the same vibrations in all the samples indicates the appropriate structure in all BCNO:Mn samples at various Mn concentrations.
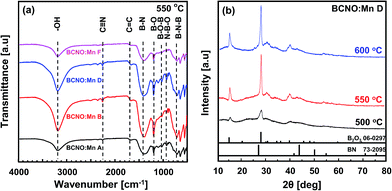 | ||
| Fig. 2 (a) FTIR spectra of BCNO:Mn samples synthesized at 550 °C at various Mn concentrations; (b) XRD patterns of BCNO:Mn D samples synthesized at various temperatures. | ||
XRD patterns showing the crystal structure of BCNO:Mn D at various synthesis temperatures are shown in Fig. 2b. The diffraction peaks of BCNO:Mn D indicate the existence of B2O3 and BN phases, which is similar to previous reports.14,15,20 The B2O3 is shown by a characteristic peak centered at 14.7°, whereas 27.8° belongs to the (111) and (310) of cubic B2O3 (JCPDS card no. 06-0297), respectively.14,15,20 The BN phase, which corresponds to turbostratic BN (t-BN) (JCPDS card no. 73-2095), is shown by the characteristic peak centered at 27° and 43°, belonging to (002) and (10) (unresolved (100) and (101) planes for h-BN), respectively.14,15 This result indicates that BCNO was successfully synthesized via the solid state phase method. The t-BN on BCNO:Mn may have originated from the exothermic reaction of urea with boric acid or B2O3 with NH3. The presence of B2O3 is more dominant than the t-BN phase due to volatilization of urea during the reaction under ambient atmosphere.3 The PL spectra of the BCNO:Mn A (undoped BCNO) at various synthesis temperatures (500–700 °C) under excitation at 365 nm are shown in Fig. 3. The PL spectra of BCNO:Mn A synthesized at 500–650 °C shows a single emission peak in the 415–450 nm range, i.e. a blue emission. The blue emission is thought to arise from closed-shell BO− and BO2− anions that act as a luminescence center.2 Moreover, from the BCNO:Mn A synthesized at 700 °C, not only a blue emission (420 nm) but also a weak near red emission (∼580 nm) was observed. The increase of the synthesis temperature of BCNO may lead to C impurities on the lattice that would serve a new energy level around 2 eV, below the conduction band of BN.7 Thus, this would increase the transition probability of trapped electrons from the N vacancy level to the C impurities level. However, the increase in synthesis temperature provides a strong blue emission rather than a red emission.
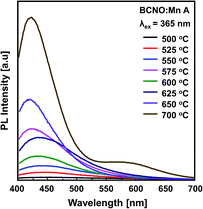 | ||
| Fig. 3 PL spectra of BCNO:Mn A (undoped BCNO) synthesized at various temperatures under UV light excitation at 365 nm. | ||
Effect of Mn concentrations on PL properties of BCNO:Mn phosphor
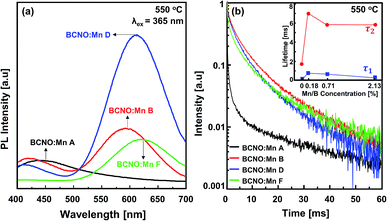
The PL spectra of the BCNO:Mn samples synthesized at 550 °C at various Mn concentrations are shown in Fig. 4a. Initially, without Mn-doping, the BCNO exhibited a low blue emission, centered at 450 nm under UV light excitation at 365 nm. The blue emission may originate from closed-shell BO− and BO2 anions that act as a luminescence center.2 The addition of Mn atoms led to a gradual decrease of the blue emission and dramatically increased the red emission, indicating the existence of Mn in the BCNO lattice. The red emission of the samples became intense and reached a maximum PL intensity for BCNO:Mn D with a peak centered at 620 nm. The red emission peak was redshifted as the Mn concentration was increased. This phenomenon was also observed for other phosphors with Mn as a dopant.9,10,21,22 This may be related to the stronger crystal field strength due to shortened Mn–O distance.22 Then, the red PL intensity decreased for BCNO:Mn E (higher Mn/B ratio) significantly, which may be due to concentration quenching.21In order to further validate the existence of Mn on the BCNO lattice, the decay curve of the BCNO:Mn samples was investigated. As described by Blasse,23 the decay behavior of BCNO:Mn can be expressed as follows:
 | (1) |
Morphological observation and elemental mapping of BCNO:Mn at various Mn concentrations was performed by scanning electron microscopy (SEM) with EDXS, and the results are shown in Table 1. The SEM images revealed no significant difference in the morphology between Mn:BCNO A (undoped BCNO) and BCNO:Mn at various concentrations. All samples were irregularly shaped and closely attached to each other. The elemental mapping results showed that the prepared samples contained B, C, N, O, and Mn without any contaminants. Well-distributed color intensities and appropriate Mn atomic percentages of the samples confirmed that Mn acted as a dopant on the BCNO phosphor. A low N atomic percentage of a sample indicates that the sample appropriately tends to a B2O3 structure rather than h-BN. This is reasonable for BCNO synthesized at 550 °C due to the high formation energy of h-BN.24
Effect of synthesis temperature on PL of BCNO:Mn
Based on the variation of the Mn concentration, BCNO:Mn D was selected as a representative sample for further investigating the influence of synthesis temperature on the PL. The PL spectra of the BCNO:Mn D samples synthesized at various temperatures are shown in Fig. 5a. The PL spectra showed two emission peaks in the blue range (∼420 nm) and red range (∼620 nm), confirming that the samples consisted of BCNO in the presence of Mn dopant. The red emission peak was shifted toward shorter wavelengths with increasing temperature, which may have been related to changing C/B or C/N content.2,14,20 However, further investigation is still needed. The red emission peak for BCNO:Mn synthesized at 500–600 °C showed a predominant red emission, while starting from 650 °C, the blue emission became predominant, indicating not only the Mn concentration but also the synthesis temperature plays an important role in the red luminescence of the BCNO phosphor.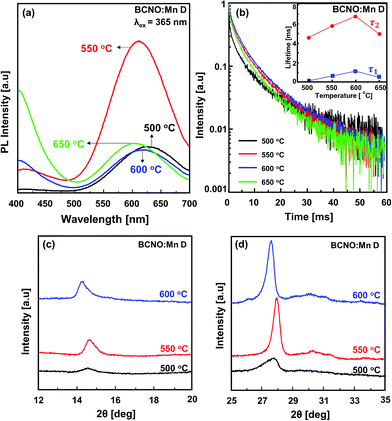 | ||
| Fig. 5 The BCNO:Mn D synthesized at various temperatures: (a) PL spectra under 365 nm UV excitation; (b) the decay curve (λex = 365 nm, λem = 620 nm), the inset (b) lifetime of BCNO sample; (c and d) the XRD pattern details, as shown in Fig. 2b. | ||
The decay curves of the BCNO:Mn samples (Fig. 5b) show a slight decrement in BCNO:Mn D lifetime at various synthesis temperatures, indicating appropriate de-excitation pathways due to the same BCNO:Mn composition.
Despite their lifetime being only weakly influenced, the structure of the BCNO:Mn samples was strongly influenced by the synthesis temperature. As shown in Fig. 2b, the intensity of each peak in the XRD results tended to increase along with the increase in temperature, which indicates that the BCNO structure was improved.20 Details of the XRD patterns of the BCNO:Mn D at 14.7° and 27.8° belonging to (111) and (310) of cubic B2O3 are shown in Fig. 5c and d. As the synthesis temperature was increased, the diffraction patterns shifted to a higher angle and then reshifted to a lower angle. This shifting is attributed to the transformation of the lattice size of BCNO:Mn due to Mn incorporation.21
PL mechanism
Fig. 6a shows the PL and PLE spectra of BCNO:Mn D synthesized at 550 °C. The PL spectra show excitation independence with predominant emission peak centers at 611 nm. The excitation independence may be induced by the O-related surface26 as observed in the EDXS results (Table 1). Normally, when Mn2+ is incorporated into a phosphor host lattice, the emission spectra are strongly affected by the Mn2+ incorporation in the host lattice structure. A green or yellow emission has been observed for Mn2+ incorporated into a tetrahedral coordination environment, as shown by ZnGa2O4:Mn2+ (λem: 502 nm),25 ZnS:Mn2+ (λem: 580 nm), SrZnO:Mn2+ (λem: 575 nm),27 etc. On the other hand, a red emission has been observed for Mn2+ incorporated into an octahedral coordination environment, as shown by LiAlO2:Mn2+ (λem: 670 nm),9 Ca9Lu(PO4)7:Mn2+ (λem: 645 nm),28 etc. However, the evident lattice structure of BCNO has not been reported, and thus the unclear PL mechanism of emission was based on the host lattice structure.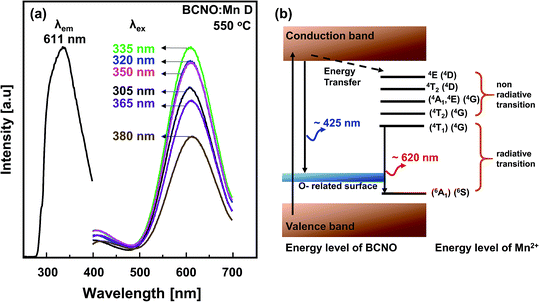 | ||
| Fig. 6 (a) The PLE and PL of BCNO:Mn D synthesized at 550 °C; (b) idealized energy level scheme of BCNO:Mn phosphors (assuming Mn in form Mn2+ pure tetrahedral point symmetry (Td)). | ||
Another PL mechanism, based on the Tanabe–Sugano diagram, is illustrated in Fig. 6b. The observed red emission of BCNO:Mn may be ascribed to the 4T1(4G) → 6A1(6S) transition of Mn2+ incorporated into the BCNO host lattice. It is reasonable to idealize that the Mn atoms that originated from manganese(II) sulfate monohydrate did not go through oxidation during synthesis. The incorporation of the larger Mn2+ ions (ionic radii 83 pm) in the BCNO lattice increases the BCNO lattice constant. The expanding crystal will reduce the orbital overlap of neighboring atoms.10,29,30 As a consequence, orbital splitting will occur, serving a new energy level within the BCNO bandgap. In addition, as a transition metal ion, Mn2+ has an incompletely filled d-shell, which causes a strong crystal field around its ions in the BCNO lattice that can generate the transfer energy from lattice to the Mn2+ level.24,28 However, the BCNO structure itself has a luminescence center that exhibits a blue emission, whereas the Mn2+ level has a luminescence center that exhibits a red emission. Moreover, the competition between both luminescence centers should be seen as a function of Mn concentration and synthesis temperature.
The existence of Mn dopant on the BCNO lattice acts as a new luminescence center that generates a red emission. The decrement of the red PL intensity after reaching the optimum Mn concentration is due to the quenching concentration, as reported in the Mn-doped phosphor case. This is reasonable because the increase of the Mn concentration forces a wider orbital overlap that leads to effective energy transfer between the Mn atoms. Therefore, the excited electrons will pass through far away from the excitation site, leading to a nonradiative transition. In addition, the decrement of the red PL intensity after reaching the optimum synthesis temperature may be due to the improved BCNO lattice as a blue luminescence center. However, further investigation is needed to elucidate the real competition between both luminescence centers.
Conclusion
A red luminescence BCNO:Mn phosphor was successfully synthesized for the first time via a solid state method. A series of experiments was conducted to explore the effects of Mn concentration and synthesis temperature on the PL properties. The phosphors were characterized via electron microscopy, X-ray diffraction, FTIR spectroscopy, EDXS, and PL, PLE and time-resolved luminescence spectroscopy. The BCNO:Mn exhibited two peaks, i.e. a predominant peak in the red range and a minor peak in the blue range. The blue emission may originate from closed-shell BO− and BO2− anions that act as luminescence center. Moreover, the red emission of BCNO:Mn may be ascribed to the 4T1(4G) → 6A1(6S) transition of Mn2+ incorporated into the BCNO host lattice. The optimum red PL properties (emission 611 nm under 365 nm excitation) were obtained from BCNO:Mn with a 0.71% mol/mol Mn/B molar ratio synthesized at 550 °C.Acknowledgements
This study was partly supported by a research grant Penelitian Unggul Integrasi Keilmuan (DIKTIS PUIK/37/2016) from the Ministry of Religious Affairs, Republic of Indonesia and Riset Desentralisasi PUPT (PN-7-11-2016) from the Indonesian Directorate General of Higher Education (DIKTI).References
- T. Ogi, Y. Kaihatsu, F. Iskandar, W. N. Wang and K. Okuyama, Adv. Mater., 2008, 20, 3235–3238 CrossRef CAS.
- W. N. Wang, T. Ogi, Y. Kaihatsu, F. Iskandar and K. Okuyama, J. Mater. Chem., 2011, 21, 5183–5189 RSC.
- X. Liu, S. Ye, Y. Qiao, G. Dong, Q. Zhang and J. Qiu, Chem. Commun., 2009, 4073–4075, 10.1039/b904567h.
- X. Zhang, L. Li, Z. Lu, J. Lin, X. Xu, Y. Ma, X. Yang, F. Meng, J. Zhao and C. Tang, J. Am. Ceram. Soc., 2014, 97, 246–250 CrossRef CAS.
- B. W. Nuryadin, E. C. Septia, F. Iskandar, T. Ogi, K. Okuyama, M. Abdullah and Khairurrijal, Adv. Mater. Res., 2014, 896, 464–467 CrossRef.
- Y. Kaihatsu, W.-N. Wang, F. Iskandar, T. Ogi and K. Okuyama, J. Electrochem. Soc., 2010, 157, J329 CrossRef CAS.
- X. Zhang, X. Jia, H. Liu, Z. Lu, X. Ma, F. Meng, J. Zhao and C. Tang, RSC Adv., 2015, 5, 40864–40871 RSC.
- Y. Kang, Z. Y. Chu, T. Ma, W. P. Li, D. J. Zhang and X. Y. Tang, Optoelectron. Lett., 2016, 12, 1–4 CrossRef.
- M. Aoyama, Y. Amano, K. Inoue, S. Honda, S. Hashimoto and Y. Iwamoto, J. Lumin., 2013, 136, 411–414 CrossRef CAS.
- P. Li, M. Peng, L. Wondraczek, Y. Zhao and B. Viana, J. Mater. Chem. C, 2015, 3, 3406 RSC.
- N. J. Cherepy, S. A. Payne, N. M. Harvey, D. Åberg, Z. M. Seeley, K. S. Holliday, I. C. Tran, F. Zhou, H. P. Martinez and J. M. Demeyer, Opt. Mater., 2016, 54, 14–21 CrossRef CAS.
- T. Ogi, H. Iwasaki, A. B. D. Nandiyanto, F. Iskandar, W.-N. Wang and K. Okuyama, J. Mater. Chem. C, 2014, 2, 4297–4303 RSC.
- X. Zhang, J. Yu, Z. Lu, H. Liu, X. Jia, C. Ren, X. Yang, F. Meng and C. Tang, J. Lumin., 2016, 176, 283–291 CrossRef CAS.
- B. W. Nuryadin, T. P. Pratiwi, F. Iskandar, M. Abdullah, K. Khairurrijal, T. Ogi and K. Okuyama, Adv. Powder Technol., 2014, 25, 891–895 CrossRef CAS.
- H. Iwasaki, T. Ogi, F. Iskandar, K. Aishima and K. Okuyama, J. Lumin., 2015, 166, 148–155 CrossRef CAS.
- C. Ren, X. Zhang, L. Zhou, Z. Lu, J. Lin, X. Xu, L. Li, X. Zhang, Y. Xue, F. Meng, J. Zhao and C. Tang, J. Lumin., 2014, 153, 338–342 CrossRef CAS.
- F. Lu, X. Zhang, Z. Lu and C. Tang, J. Lumin., 2014, 149, 231–235 CrossRef CAS.
- X. Zhang, Z. Lu, H. Liu, J. Lin, X. Xu, F. Meng, J. Zhao and C. Tang, J. Mater. Chem. C, 2015, 3, 3311–3317 RSC.
- E. D. Rivera-Tapia, C. A. Fajardo, A. J. Ávila-Vega, C. F. Ávila, F. M. Sánchez-Arévalo, I. Chango-Villacís, F. J. Quiroz-Chávez, J. Santoyo-Salazar and R. C. Dante, Fullerenes, Nanotubes, Carbon Nanostruct., 2016, 24, 8–12 CrossRef CAS.
- I. D. Faryuni, B. W. Nuryadin, F. Iskandar, M. Abdullah, Khairurrijal, T. Ogi and K. Okuyama, J. Lumin., 2014, 148, 165–168 CrossRef CAS.
- P. Li, M. Peng, M. Wondraczek, Y. Zhao and B. Viana, J. Mater. Chem. C, 2015, 3, 3406–3415 RSC.
- L. Shi, H. Yanlin and J. S. Hyo, J. Phys. Chem. A, 2010, 114, 6927–6934 CrossRef CAS PubMed.
- G. Blasse and B. Grabmaier, in Luminescent Materials, Springer, 1994, pp. 91–107 Search PubMed.
- A. Yamanaka and S. Okada, Sci. Rep., 2016, 6, 30653 CrossRef CAS PubMed.
- J. S. Kim, J. S. Kim, T. W. Kim, S. M. Kim and H. L. Park, Appl. Phys. Lett., 2005, 86, 231909 CrossRef.
- L. Tang, R. Ji, X. Li, K. S. Teng and S. P. Lau, Part. Part. Syst. Charact., 2013, 30, 523–531 CrossRef CAS.
- S. Kubota, T. Oyama, H. Yamane and M. Shimada, Chem. Mater., 2003, 15, 3403–3405 CrossRef CAS.
- N. Guo, Y. Huang, H. You, M. Yang, Y. Song, K. Liu and Y. Zheng, Inorg. Chem., 2010, 49, 10907–10913 CrossRef CAS PubMed.
- G. Li, D. Geng, M. Shang, C. Peng, Z. Cheng and J. Lin, J. Mater. Chem., 2011, 21, 13334 RSC.
- Q. Zhang, H. Ni and L. Wang, Appl. Phys. A: Mater. Sci. Process., 2013, 114, 883–889 CrossRef.
| This journal is © The Royal Society of Chemistry 2017 |

