 Open Access Article
Creative Commons Attribution 3.0 Unported Licence
A four-state capacitance molecular switch based on a redox active tetrathiafulvalene self-assembled monolayer†
E. Marchante,
M. S. Maglione,
N. Crivillers,
C. Rovira and
M. Mas-Torrent *
*
Institut de Ciència de Materials de Barcelona (ICMAB-CSIC), Networking Research Center on Bioengineering, Biomaterials and Nanomedicine (CIBER-BBN), Campus de la UAB, 08193 Bellaterra, Spain. E-mail: mmas@icmab.es
First published on 17th January 2017
Abstract
An electroactive tetrathiafulvalene (TTF) self-assembled monolayer (SAM) on gold has been prepared and fully characterised by electrochemical impedance spectroscopy. Transfer rates of the same order were found for the two redox processes. Remarkably, the TTF SAM was successfully exploited as a 4-state electrochemical switch using the capacitance of the SAM as output signal.
The development of molecules possessing different reversible redox stable states has attracted great interest for their potential as active units in charge-storage electronic devices.1–3 Hybrid organic–inorganic materials that consist of the immobilisation of the active molecules on solid supports provide a promising alternative route to existing silicon technology. One example of these hybrid materials consists of the chemical grafting of the functional molecules on conducting surfaces by forming a self-assembled monolayer (SAM).4 Commonly, redox-active SAMs are composed of a single electroactive unit that can switch between typically two redox states.5 Such bi-stable systems can hence mimic current memory devices which are based on binary systems where every bit is coded by a 0 or 1, corresponding to a low or high signal.6–9 However, one approach to deal with the ever-increasing information density, is to increase the number of memory states in each cell. For this purpose, the realization of electroactive surfaces with multiple accessible redox states is highly desirable.10 Only a few examples of ternary and quaternary redox SAMs can be found in the literature, which have been achieved by employing molecules that exhibit several redox states11–16 or molecules that contain two electroactive moieties,17,18 or by preparing bi-component SAMs with two functional molecules.19 The former strategy is synthetically less demanding, although it is challenging to find electroactive molecules with more than three accessible redox states in a voltage window where the SAMs linked to a substrate are stable. In all these cases each molecular redox state has been attributed to one memory bit. However, it has been previously shown in self-assembled multilayers of an Os2+ complex that the definition of the number of states is not limited by the redox bi-stability of this system, but it can be enhanced if at specific input values distinct levels of the output signal can be determined.12 As a readout signal in these types of electroactive SAMs the optical response (i.e., absorption) has been extensively employed.5,15,16,20 Nonetheless, the use of electrical signals is particularly appealing since they can be more easily integrated with modern technologies. Recently, we demonstrated in a ferrocene SAM that the capacitance of the SAM before and after the redox peak determined by electrochemical impedance spectroscopy (EIS) can be successfully exploited as output of the electrochemical switch.21 Here, we carried out a step forward by applying this methodology in a system with more accessible redox states, in particular in a SAM of a tetrathiafulvalene (TTF) derivative on gold. TTFs exhibit two redox processes and are ideal candidates to be applied in molecular switches.22–25 The TTF SAMs were prepared and fully characterised by EIS in order to determine the two electron transfer constants and the capacitance of the system at different applied voltages. Four different states were defined and the electrochemical switching response was successfully monitored employing the SAM capacitance as a readout mechanism.
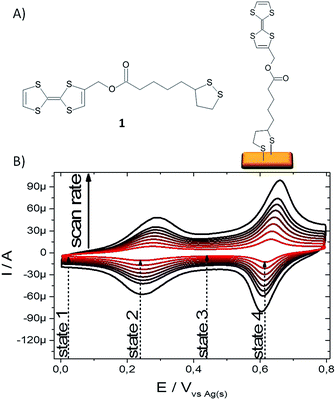
The TTF derivative 1 (Fig. 1A) was synthesised following the methodologies reported in the literature (see ESI† for synthetic details).26–28 This molecule bears a disulfide group that can react with gold surfaces in order to form a covalent bonded SAM. The SAMs were prepared by immersion of the freshly cleaned substrates in a 1 mM solution of 1 in dry THF under an inert atmosphere and room temperature for 72 h. Subsequently, the functionalized samples were rinsed carefully with THF and dried under a stream of nitrogen giving the target TTF-SAM (Fig. 1A). The SAMs were successfully characterised by X-ray Photoelectron Spectroscopy (XPS) and Time-of-Flight Secondary Ion Mass Spectrometry (ToF-SIMS) (Table S1 and Fig. S1 ESI†).
 | ||
| Fig. 1 (A) TTF molecule 1 and scheme of its corresponding SAM on gold. (B) CV of TTF-SAM in LiClO4 0.1 M in acetonitrile at scan rates 0.1, 0.2, 0.3, 0.4, 0.5, 0.6, 0.7 and 1 V s−1. | ||
The confinement of the TTF core on the electrode surface provides an electrochemical interface with three stable redox states, i.e., the neutral, the radical cation and the dication forms of TTF. The TTF-Au modified electrodes were characterized then using electrochemical techniques. Fig. 1B shows the voltammetric response of the TTF-modified Au surface at different potential scan rates (ν) measured using a solution of LiClO4 0.1 M in acetonitrile as electrolyte, the functionalized surface as working electrode and platinum and silver wires as counter and pseudo-reference electrodes, respectively. Expectedly, two reversible one-electron processes corresponding to the TTF/TTF˙+ and TTF˙+/TTF2+ redox couples were observed at the formal potentials E′1 = 0.26 V and E′2 = 0.63 V vs. Ag(s) (at a scan rate of 100 mV s−1), respectively. The linear relationship between Ipa (i.e., the anodic peak current intensity) and ν is in agreement with the presence of surface-confined redox-active molecules (see ESI, Fig. S2†), along with the small peak-to-peak separations (ΔEp = Eanodic − Ecathodic) observed at low scan rates for the two redox processes, ΔEp1 = 27 mV and ΔEp2 = 19 mV.29 The full width at half maximum (fwhm) in a theoretical case, where an ideal Nernstian reaction under the Langmuir isotherm conditions (i.e., all adsorption sites are equivalents and there are no interactions between immobilized electroactive centers) occurs at 25 °C, is ca. 90 mV.30 The deviations from the theoretical fwhm value gives hence information about the redox centers, especially related to the intermolecular interactions.31,32 In this case, the fwhm value of the first redox peak of the TTF-SAMs was larger than 90 mV (i.e., 143 mV), whereas for the second redox peak was slightly lower than the theoretical value (i.e., 79 mV). This type of CV shape has been commonly observed in other TTF-SAMs.13,33,34 From the area under the cyclic voltammetry peak, the TTF surface coverage was estimated to be 2.2 × 10⁻¹⁰ mol cm−2 (at 100 mV s−1 of scan rate). Repeated electrochemical cycling demonstrated that the SAM was stable and only a significant reduction in the CV was detected when the potential was scanned beyond the first redox process (Fig. S3†).
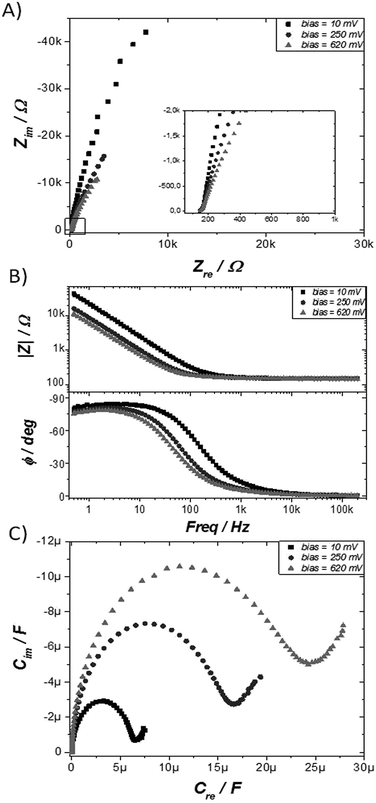
Electrochemical impedance spectroscopy (EIS) is a powerful tool to characterize electrical interfacial properties.35 In SAMs it has mainly been previously employed to determine electron transfer rates in electroactive systems36 or to investigate the ionic permeability through SAMs based of non-electroactive molecules.37 To characterise the TTF-SAM, impedance spectra were collected, in the same conditions as the ones used in the CV experiments, between 200 kHz and 500 mHz with an AC amplitude of 5 mV (peak to peak) at three different voltages: before the redox process (10 mV), at the first redox peak potential (250 mV), and at the second redox peak potential (620 mV). Nyquist and Bode plots, shown in Fig. 2A and B, respectively, are the standard diagrams to represent EIS measurements.38–40 In cases where a DC-current can be established, such as when an ion pair is present in the electrolyte solution, Nyquist plots typically display one or more semicircles.35 Nevertheless, in the case of surface confined molecules under an inert electrolyte, a DC-current cannot be established, and the system shows capacitor behaviour. Accordingly, the Nyquist plots of the TTF-SAM look like straight vertical lines parallel to the y axis (Fig. 2A).41–45 The Bode magnitude plots (impedance modulus (|Z|) vs. frequency) at the low frequency region consist of straight lines with slopes close to −1, while the phase angles (ϕ) approach −90°. This behaviour is in agreement with a capacitor-like system,46 where the gold metal surface acts as one of the capacitor plate and the physisorbed ions at the SAM/electrolyte interface act as the other capacitor plate.47 At higher frequencies (f > 10 kHz), the frequency-independent impedance and phase angle close to zero indicate that the system behaves as a resistor, that is, the total impedance is dominated by the solution resistance.47 This is due to the fact that at high frequencies, the capacitor behaves as a short-circuit element since there is no time to be charged, allowing the AC current to pass. Noticeable, a significant modulation in |Z| is observed at the low frequency region depending on the DC voltage applied (i.e., on the SAM redox state), indicating that the performed impedance measurements could be successfully used as a readout of the molecular switch. Alternatively, the data can be analyzed by means of capacitance Bode plots by using the expressions:40,41,48 Cre = −Zim[(j2πfZ)−1] and Cim = −Zre[(j2πfZ)−1], where Zre and Zim are the real and imaginary part of the complex impedance, respectively, and f the frequency.
 | ||
| Fig. 2 EIS characterization of TTF-SAM at 3 different bias voltages: 10 mV (■), 250 mV (●), and 620 mV (▲) vs. Ag(s). (A) Nyquist plot, (B) Bode plot, and (C) Cole–Cole Plot. | ||
In fact, capacitance Cole–Cole plots, where the imaginary (Cim) versus the real (Cre) part of the capacitance are represented, provide very useful information for surface confined redox species.41–45,48–50 Fig. 2C clearly illustrates that different processes with different time constants are occurring depending on the applied DC potential. The small semicircle recorded at a voltage outside the redox process (i.e., 10 mV) comes from the non faradaic terms dominated by the resistance of the electrolyte (Re) and the double layer capacitance (Cdl). In the redox window potentials faradaic contributions are also present (i.e., a pseudo-capacitance for charging the monolayer and a resistance for the electron transfer). Noteworthy, the influence of applied potential on the capacitance spectra of bare Au was much smaller than when the gold is functionalised with the TTF electroactive monolayer, indicating that the observed effect is not simply due to the polarisation of the metal but to the redox processes involved (Fig. S4†).
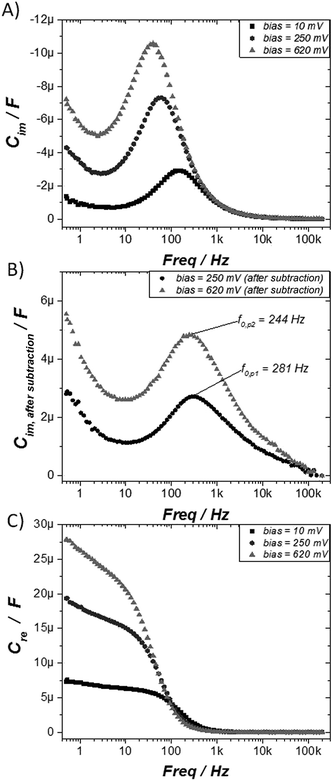
The imaginary part of the capacitance for the prepared TTF-SAMs is plotted against frequency at DC bias 10, 250 and 620 mV, as shown in Fig. 3A. From this data, it is possible to extract information about the kinetic parameters of the redox transfer.41–45,48–50 However, first it is necessary to treat the data. First the solution resistance (Re), which is easily extracted from the beginning of Zre at high frequency in the Nyquist plot, should be subtracted from the spectrum by means of Zre(f) − Re.48 Then, the blank response from the experimental data registered at 10 mV is also subtracted. In this way, we can gain information exclusively on the redox processes, free of parasitic signals. Fig. 3B shows the final responses of the two Cim spectra that correspond to the first and second redox processes, respectively, after the subtraction of the response of the SAM outside the redox window. From these graphs, the rate constant for the electron transfer process (kET) can be estimated from the frequency (f0) at the highest ordinate point using the expression: kET = πf0.41–45,48–50 The kET values for the TTF/TTF˙+ and TTF˙+/TTF2+ redox processes were estimated to be 882 and 767 s−1, respectively. Noticeably, previously reported transfer rates for TTF SAMs extracted from applying Laviron's formalism on the CV data gave a higher value for the second oxidation process than for the first one.51,52 This trend was attributed to environmental effects such as the formation of ion pairs between the oxidized TTF molecules and the electrolyte anions that accelerated the second redox process.50–52 However, in our study the transfer rates found for the two TTF redox processes by EIS are of the same order.
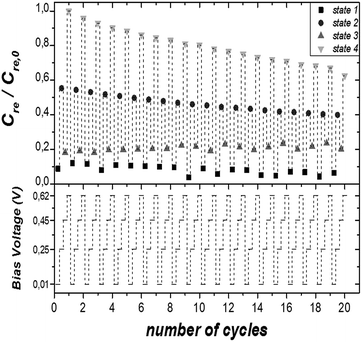
Further, the Cre versus frequency plot is illustrated in Fig. 3C. We found that at medium/high frequency range, the measured capacitance corresponds to the bulk capacitance, whereas at low frequency values a plateau is reached reflecting the interfacial double-layer capacitance.53 Consequently, at this low frequency the capacitance is clearly dependant on the redox state of the molecule and, thus, on the applied DC voltage. Therefore, this result prompted us to investigate the capacitance response in the electrochemical switchable TTF-SAM at low frequency. Taking into account the CV data, four different voltage inputs were selected: 10, 250, 450 and 620 mV vs. Ag(s), respectively (Fig. 1B). Such voltages correspond, respectively, to a state where the TTF molecule is in neutral state (state 1), where the first oxidation process occurs (state 2), where all the TTF surface-confined molecules should exist as TTF˙+ radical-cation (state 3) and the last one where the second oxidation process takes place (state 4). A schematic representation of the different TTF-SAM redox states can be found in Fig. S5.† Hence EIS measurements were performed at 1 Hz at the selected DC potentials. In Fig. 4 evolution of Cre in the four states is shown when 20 cycles were applied to the TTF functionalised gold substrate. Capacitance values discernible and specific for each state with significant on/off ratios were found, validating the feasibility of using the SAM capacitance as output of the electrochemical switch. A perceptible decrease of the initial capacitance value of 3, 15, 2 and 30% for states 1–4, respectively, after 20 cycles, was found. As the values indicate, such variation is more pronounced at the states corresponding to the potential of the redox process. This is attributed to some molecular desorption caused by the bias stress. This is also in accordance to the changes observed in the CV of the SAM before and after the impedance switching experiments (Fig. S6†). The switching response was studied in different samples after the application of 50 cycles achieving similar results (Fig. S7†). Therefore, it has been successfully achieved a surface confined molecular switch operating with both and electric input and output signals by making use of the SAM capacitance. It should be highlighted though that the robustness of the system is limited to the electrochemical stability of the sulphur–gold covalent bond which could probably be improved by avoiding extremely traces of humidity and oxygen. We also anticipate that other SAMs such as silane derivatives on ITO would be more durable.13,19
Conclusions
In summary, a functionalised gold surface with a TTF derivative was prepared in order to realise a surface with multiple accessible redox states. Such hybrid material was investigated as a four-state surface-immobilized switch by taking advantage of the different capacitance response under the application of external electric fields. Importantly, the number of states of the switch was not limited to the number of redox states of the molecule but instead it was determined by the output of the system at defined DC applied potentials. It should be also noticed that quaternary logic storage platforms can easily match the present binary system as they can be decoded directly into two binary-digit equivalents.54–56 Complementary, high and comparable values of kET were obtained by EIS for the two redox process of the TTF. Thus, the results here reported might encourage the development of this type of electrochemical molecular switches for the future implementation in devices.Acknowledgements
We acknowledge financial support from the EU (projects ERC StG 2012-306826 e-GAMES and ITN iSwitch 642196), the Networking Research Center on Bioengineering, Biomaterials and Nanomedicine (CIBER-BBN), the DGI (Spain) project BE-WELL CTQ2013-40480-R, the Generalitat de Catalunya (2014-SGR-17) and the Spanish Ministry of Economy and Competitiveness, through the “Severo Ochoa” Programme for Centres of Excellence in R&D (SEV-2015-0496). E. M. and M. S. M. are enrolled in the Materials Science PhD program of the UAB.References
- J. R. Heath, J. F. Stoddart, R. S. Williams, E. A. Chandross and P. S. Weiss, Science, 2004, 303, 1137 CrossRef PubMed.
- N. Fuentes, A. Martín-Lasanta, L. Álvarez de Cienfuegos, M. Ribagorda, A. Parra and J. M. Cuerva, Nanoscale, 2011, 3, 4003 RSC.
- F. Meng, Y.-M. Hervault, Q. Shao, B. Hu, L. Norel, S. Rigaut and X. Chen, Nat. Commun., 2014, 5, 3023 Search PubMed.
- A. Ulman, Chem. Rev., 1996, 96, 1533–1554 CrossRef CAS PubMed.
- T. Gupta and M. E. Van Der Boom, Angew. Chem., Int. Ed., 2008, 47, 5322–5326 CrossRef CAS PubMed.
- M. Emmelius, G. Pawlowski and H. W. Vollmann, Angew. Chem., Int. Ed. Engl., 1989, 28, 1445–1471 CrossRef.
- S. Kawata and Y. Kawata, Chem. Rev., 2000, 100, 1777–1788 CrossRef CAS PubMed.
- M. Alexe, C. Harnagea, A. Visinoiu, A. Pignolet, D. Hesse and U. Gösele, Scr. Mater., 2001, 44, 1175–1179 CrossRef CAS.
- Q. Zhang, J. He, H. Zhuang, H. Li, N. Li, Q. Xu, D. Chen and J. Lu, Adv. Funct. Mater., 2016, 26, 146–154 CrossRef CAS.
- M. Mas-Torrent, C. Rovira and J. Veciana, Adv. Mater., 2013, 25, 462–468 CrossRef CAS PubMed.
- D. Gryko, J. Li, J. R. Diers, K. M. Roth, D. F. Bocian, W. G. Kuhr and J. S. Lindsey, J. Mater. Chem., 2001, 11, 1162–1180 RSC.
- G. De Ruiter, L. Motiei, J. Choudhury, N. Oded and M. E. Van Der Boom, Angew. Chem., Int. Ed., 2010, 49, 4780–4783 CrossRef CAS PubMed.
- C. Simão, M. Mas-Torrent, J. Casado-Montenegro, F. Otón, J. Veciana and C. Rovira, J. Am. Chem. Soc., 2011, 133, 13256–13259 CrossRef PubMed.
- J. Casado-Montenegro, M. Mas-Torrent, F. Otón, N. Crivillers, J. Veciana and C. Rovira, Chem. Commun., 2013, 49, 8084–8086 RSC.
- I. Alcón, M. Gonidec, M. R. Ajayakumar, M. Mas-Torrent and J. Veciana, Chem. Sci., 2016, 7, 4940–4944 RSC.
- A. Kumar, M. Chhatwal, P. C. Mondal, V. Singh, A. K. Singh, D. a. Cristaldi, R. D. Gupta and A. Gulino, Chem. Commun., 2014, 50, 3783–3785 RSC.
- L. Wei, K. Padmaja, W. J. Youngblood, A. B. Lysenko, J. S. Lindsey and D. F. Bocian, J. Org. Chem., 2004, 69, 1461–1469 CrossRef CAS PubMed.
- C. Simao, M. Mas-Torrent, V. André, M. T. Duarte, J. Veciana and C. Rovira, Chem. Sci., 2013, 4, 307–310 RSC.
- J. Casado-Montenegro, E. Marchante, N. Crivillers, C. Rovira and M. Mas-Torrent, ChemPhysChem, 2016, 17, 1810–1814 CrossRef CAS PubMed.
- C. Simão, M. Mas-Torrent, N. Crivillers, V. Lloveras, J. M. Artés, P. Gorostiza, J. Veciana and C. Rovira, Nat. Chem., 2011, 3, 359–364 CrossRef PubMed.
- E. Marchante, N. Crivillers, M. Buhl, J. Veciana and M. Mas-Torrent, Angew. Chem., Int. Ed., 2016, 55, 368–372 CrossRef CAS PubMed.
- D. Canevet, M. Sallé, G. Zhang, D. Zhang and D. Zhu, Chem. Commun., 2009, 7345, 2245–2269 RSC.
- P. Batail, Chem. Rev., 2004, 104, 4887–4890 CrossRef CAS.
- J. L. Segura and N. Martn, Angew. Chem., Int. Ed., 2001, 40, 1372–1409 CrossRef CAS PubMed.
- N. Martín, L. Sánchez, M. Á. Herranz, B. Illescas and D. M. Guldi, Acc. Chem. Res., 2007, 40, 1015–1024 CrossRef PubMed.
- J. Garín, J. Orduna, S. Uriel, A. J. Moore, M. R. Bryce, S. Wegener, D. S. Yufit and J. A. K. Howard, Synthesis, 1994, 489–493 CrossRef.
- G. Cooke, F. M. Duclairoir, V. M. Rotello and J. F. Stoddart, Tetrahedron Lett., 2000, 41, 8163–8166 CrossRef CAS.
- M. Á. Herranz, L. Yu, N. Martín and L. Echegoyen, J. Org. Chem., 2003, 68, 8379–8385 CrossRef CAS PubMed.
- P. Daum and R. W. Murray, J. Electroanal. Chem. Interfacial Electrochem., 1979, 103, 289–294 Search PubMed.
- H. L. Lord, W. Zhan and J. Pawliszyn, Fundamentals and applications of needle trap devices, John Wiley & Sons, Inc., New York, NY, 2012, vol. 2 Search PubMed.
- M. Lyons, in Electroanalytical Chemistry, ed. A. J. Bard and I. Rubisntein, Marcel Dekker, Inc, New York, NY, 2014, p. 110 Search PubMed.
- O. Alévêque, F. Seladji, C. Gautier, M. Dias, T. Breton and E. Levillain, ChemPhysChem, 2009, 10, 2401–2404 CrossRef PubMed.
- Y. Yokota, A. Miyazaki, K. I. Fukui, T. Enoki, K. Tamada and M. Hara, J. Phys. Chem. B, 2006, 110, 20401–20408 CrossRef CAS PubMed.
- P.-Y. Blanchard, O. Alévêque, S. Boisard, C. Gautier, A. El-Ghayoury, F. Le Derf, T. Breton and E. Levillain, Phys. Chem. Chem. Phys., 2011, 13, 2118–2120 RSC.
- E. Barsoukov and J. R. Macdonald, Impedance Spectroscopy: Theory, Experiment, and Applications, 2005 Search PubMed.
- S. Campuzano, M. Pedrero, C. Montemayor, E. Fatás and J. M. Pingarrón, J. Electroanal. Chem., 2006, 586, 112–121 CrossRef CAS.
- E. Boubour and R. B. Lennox, J. Phys. Chem. B, 2000, 104, 9004–9010 CrossRef CAS.
- J. N. Murray, Prog. Org. Coat., 1997, 31, 375–391 CrossRef CAS.
- L. V. S. Philippe, G. W. Walter and S. B. Lyon, J. Electrochem. Soc., 2003, 150, B111–B119 CrossRef CAS.
- J. R. Macdonald and W. B. Johnson, Fundamentals of Impedance Spectroscopy, 2005 Search PubMed.
- T. M. Nahir and E. F. Bowden, Langmuir, 2002, 18, 5283–5286 CrossRef CAS.
- E. Katz, O. Lioubashevsky and I. Willner, J. Am. Chem. Soc., 2004, 126, 15520–15532 CrossRef CAS PubMed.
- Y. Guo, J. Zhao, X. Yin, X. Gao and Y. Tian, J. Phys. Chem. C, 2008, 112, 6013–6021 CAS.
- R. E. Ruther, Q. Cui and R. J. Hamers, J. Am. Chem. Soc., 2013, 135, 5751–5761 CrossRef CAS PubMed.
- M. Drüschler, N. Borisenko, J. Wallauer, C. Winter, B. Huber, F. Endres and B. Roling, Phys. Chem. Chem. Phys., 2012, 14, 5090 RSC.
- Z. Kerner and T. Pajkossy, Electrochim. Acta, 2000, 46, 207–211 CrossRef CAS.
- E. Boubour and R. B. Lennox, Langmuir, 2000, 16, 4222–4228 CrossRef CAS.
- P. R. Bueno, G. Mizzon and J. J. Davis, J. Phys. Chem. B, 2012, 116, 8822–8829 CrossRef CAS PubMed.
- M. S. Góes, H. Rahman, J. Ryall, J. J. Davis and P. R. Bueno, Langmuir, 2012, 28, 9689–9699 CrossRef PubMed.
- P. R. Bueno, F. Fabregat-Santiago and J. J. Davis, Anal. Chem., 2013, 85, 411–417 CrossRef CAS PubMed.
- G. Yzambart, B. Fabre, F. Camerel, T. Roisnel and D. Lorcy, J. Phys. Chem. C, 2012, 116, 12093–12102 CAS.
- N. Bellec, A. Faucheux, F. Hauquier, D. Lorcy and B. Fabre, Int. J. Nanotechnol., 2008, 5, 741–756 CrossRef CAS.
- V. F. Lvovich, Impedance spectroscopy application to electrochemical and dielectric phenomena, Wiley, 2012 Search PubMed.
- M.-J. Lee, C. B. Lee, D. Lee, S. R. Lee, M. Chang, J. H. Hur, Y.-B. Kim, C.-J. Kim, D. H. Seo, S. Seo, U.-I. Chung, I.-K. Yoo and K. Kim, Nat. Mater., 2011, 10, 625–630 CrossRef CAS PubMed.
- R. Waser, R. Dittmann, C. Staikov and K. Szot, Adv. Mater., 2009, 21, 2632–2663 CrossRef CAS.
- T. Chattopadhyay, J. N. Roy and A. K. Chakraborty, Opt. Commun., 2009, 282, 1287–1293 CrossRef CAS.
Footnote |
| † Electronic supplementary information (ESI) available. See DOI: 10.1039/c6ra27011e |
| This journal is © The Royal Society of Chemistry 2017 |


