 Open Access Article
Creative Commons Attribution 3.0 Unported Licence
A facile sacrificial template method to synthesize one-dimensional porous CdO/CdFe2O4 hybrid nanoneedles with superior adsorption performance†
Yadan Wub,
Enlai Hub,
Wei Daib,
Zhipeng Lib,
Yijun Zhong*ac and
Yong Hu *ab
*ab
aHangzhou Institute of Advanced Studies, Zhejiang Normal University, Hangzhou, 311231, P. R. China. E-mail: yonghu@zjnu.edu.cn
bInstitute of Physical Chemistry, Zhejiang Normal University, Jinhua, 321004, P. R. China
cJinhua Polytechnic, Jinhua, 321007, P. R. China
First published on 17th January 2017
Abstract
In this work, we have developed a facile sacrificial template method to prepare one-dimensional (1D) porous CdO/CdFe2O4 hybrid nanoneedles (HNNs) with uniform pore size distribution and structural stability for the first time. The solid 1D Cd2Fe(CN)6 NNs with a smooth surface are first synthesized and used as sacrificial templates through a simple low-temperature hydrothermal process. After thermal treatment, the solid precursor NNs can be transformed into the corresponding porous CdO/CdFe2O4 HNNs. Due to the large-scale production and unique structural features, the as-prepared porous CdO/CdFe2O4 HNNs can serve as a highly efficient adsorbent towards removal of Congo red (CR) from aqueous solution with a maximum adsorption capacity of 1491 mg g−1. Furthermore, the adsorption process of CR on porous CdO/CdFe2O4 HNNs was systematically carried out, indicating that the Langmuir model and the pseudo-second-order kinetics model can describe well the adsorption behavior. The result demonstrates that the as-prepared porous CdO/CdFe2O4 HNNs may be a promising candidate in dye effluent treatment.
1. Introduction
Over the last few years, water pollution has received much attention and become a global problem, because organic dyes discharged from the textile industry are the main source of sewage.1,2 As a class of synthetic colored organic compounds and one of the most important benzidine-based anionic dyes, Congo red (CR) is widely adopted in the textile industry. Due to being harmful to many organisms including humans, it is of importance to rationally and efficiently deal with its contaminated effluents.3 Up to now, a great number of methods have been adopted, such as oxidation,4 electrochemical degradation,5 photocatalysis,6–8 coagulation,9 adsorption,10 nanofiltration,11 etc. Among these methods, adsorption has been considered as the main method dealing with organic dyes in wastewater, because of its operational ease, low capital and operational costs and high efficiency.12–14 Conventional adsorbents, including active carbon,15,16 synthetic resins,17 etc., are limited due to their low adsorptive efficiency and the difficult regeneration and disposal. Therefore, exploring high efficiency and low cost adsorbent materials is of vital importance for practical application.Recently, numerous efforts have been made to develop novel low-dimensional or porous adsorbents owing to their small particle sizes, great specific surface areas, porosity, and abundant active sites.1,18–26 For example, one-dimensional (1D) porous ZnO/SnO2 hetero-nanofibers have been successfully prepared via a electrospinning method,27 which exhibited the superior adsorption capacity and the enhanced photoactivity for the degradation of CR. Sun et al. reported a novel adsorbent based on the porous Al-doped ZnO nanosheets, demonstrating the improved adsorption capacity for dye.28 The synergistic effect of low-dimensional morphology and porous structure can provide a large surface-to-volume ratio and plenty active sites, which can facilitate the diffusion and transport of organic dyes in aqueous solution, resulting in the enhanced adsorptive performance.
Herein, a novel adsorbent based on 1D porous CdO/CdFe2O4 hybrid nanoneedles (HNNs) has been synthesized via a facile sacrificial template method for the first time. The solid 1D Cd2Fe(CN)6 NNs are first synthesized and used as sacrificial templates by a simple low-temperature hydrothermal route, and then the solid precursor NNs can be transformed into the corresponding porous 1D CdO/CdFe2O4 HNNs after thermal treatment. Because of the large-scale production and unique structural features, the as-obtained 1D porous HNNs exhibit an superior adsorption capacity of 1491 mg g−1 for CR from aqueous solution. The adsorption process of CR on 1D porous CdO/CdFe2O4 HNNs was systematically carried out, which is in accordance with the pseudo-second-order kinetics model and Langmuir isotherm. Further investigations show that the adsorption process is endothermic and spontaneous, and the adsorption mechanism is attributed to a physisorption process.
2. Experimental section
2.1 Synthesis of Cd2Fe(CN)6 NNs and porous CdO/CdFe2O4 HNNs
All reagents used in this work were of analytical grade and purchased from the Shanghai Chemical Reagent Factory. In a typical synthesis, 22.8 mg of CdCl2·2.5H2O and 0.4 g of polyvinylpyrrolidone (PVP, MW ∼58k) were dissolved in 20 mL of distilled water to form a clear solution. Then, 20 mL of pre-prepared K4Fe(CN)6·3H2O aqueous solution (2.5 mM) was added dropwise into the above solution forming a white colloidal solution and kept stirring for 10 min. The resulting mixture was then transferred into a 50 mL Teflon-lined stainless steel autoclave, which was sealed and heated in an oven at 120 °C for 20 h and then cooled to room temperature naturally. After collection by centrifugation, the resultant white products (1D Cd2Fe(CN)6 NNs) were washed with anhydrous ethanol and distilled water for three times and then dried under vacuum at 80 °C for 4 h. Finally, the 1D porous CdO/CdFe2O4 HNNs were obtained by annealed in air at 550 °C maintaining for 4 h with a ramp rate of 1 °C min−1 using the as-prepared Cd2Fe(CN)6 NNs as precursor.2.2 Characterizations
Powder X-ray diffraction (XRD) measurements of the samples were performed with a Philips PW3040/60 X-ray diffractometer using Cu Kα radiation at a scanning rate of 0.06 deg s−1. Scanning electron microscopy (SEM) was taken with a Hitachi S-4800 scanning electron micro-analyzer with an accelerating voltage of 15 kV. Transmission electron microscopy (TEM) and high-resolution transmission electron microscopy (HRTEM) were conducted using a JEM-2100F field-emission TEM. The adsorption spectra were measured using a PerkinElmer Lambda 900 UV-vis spectrophotometer at room temperature. N2 adsorption–desorption isotherms were carried out at 77 K on a Micrometrics ASAP 2020 surface area and porosity analyzer after the sample had been degassed in vacuum at 160 °C for 4 h. Fourier transform infrared spectra (FT-IR) were recorded on a Nicolet NEXUS670 FT-IR spectrometer using KBr pellets.2.3 Adsorption performance test
For adsorption isotherm studies, 0.02 g of 1D porous CdO/CdFe2O4 HNNs adsorbents were added to 50 mL of CR with different concentrations solution (60, 200, 300, 400, 500, 600, 800, 1000 mg L−1, respectively.) in a conical flask under stirring at a natural pH value and room temperature (298 K) for 8 h. After adsorption, the resulting suspensions were collected and separated to measure the adsorption peak intensity of CR (at 496 nm) by using UV-vis spectroscopy. To study adsorption kinetic, 0.02 g of the CdO/CdFe2O4 sample was mixed with 50 mL of CR solution (60, 100, 150 mg L−1) at certain time intervals. Each test was repeated for three times to ensure the accuracy of this work.3. Results and discussion
3.1 Synthesis and characterization of 1D porous CdO/CdFe2O4 HNNs
The synthesis procedure for the 1D porous CdO/CdFe2O4 HNNs is schematically illustrated in Scheme 1, which can be described by two steps. In step I, the uniform 1D Cd2Fe(CN)6 NNs as the precursors are prepared via a facile low-temperature hydrothermal process at 120 °C for 20 h. In step II, the solid precursors can be transformed into the corresponding 1D porous CdO/CdFe2O4 HNNs after thermal treatment at 550 °C for 4 h. The pores formed in the CdO/CdFe2O4 HNNs by generating gases from the interior of the precursor during the thermal decomposition process can be described as the following reaction equation (eqn (1)), which is much similar to the previous literature.29
 | (1) |
The XRD analysis was first carried out to investigate the crystallographic structure and phase purity of the as-prepared 1D Cd2Fe(CN)6 NNs and porous CdO/CdFe2O4 HNNs. From the XRD pattern of the as-prepared precursor (Fig. S1, see ESI†), all of the observed peaks can be ascribed to the characteristic peaks of cadmium iron cyanide (Cd2Fe(CN)6, JCPDS card no. 24-0164). Fig. 1a shows the XRD pattern of the as-prepared product after thermal treatment at 550 °C. The pattern obviously consist of two sets of diffraction peaks, the diffraction peaks marked by asterisk correspond to the cubic phase of CdO (a = b = c = 4.695 Å, JCPDS card no. 05-0640), and the other peaks marked by square match well with the cubic phase of CdFe2O4 (a = b = c = 8.700 Å, JCPDS card no. 22-1063). No impurity peaks are detectable, indicating the successful transformation of Cd2Fe(CN)6 to CdO/CdFe2O4 hybrids. The porous nature of the as-obtained 1D CdO/CdFe2O4 HNNs was further assessed by nitrogen adsorption isotherm experiment, as shown in Fig. 1b. It can be observed that the adsorption–desorption isotherm of the as-prepared product presents a type IV isotherm with a distinct hysteresis loop at the relative pressure region (P/P0 = 0.7–1), manifesting the existence of plentiful mesopores in the product.30–32 The surface area of the 1D porous CdO/CdFe2O4 HNNs can be found to be 16.2 m2 g−1 and the Barrett–Joyne–Halenda (BJH) pore-size distribution curve (inset in Fig. 1b) display the average size of the pores is centered at approximately 25.3 nm and the pore volume is calculated to be about 0.1188 cm3 g−1. These porous channels are favorable to promote the diffusion of dyes into the adsorbents, resulting in the enhanced adsorption capability for CR.
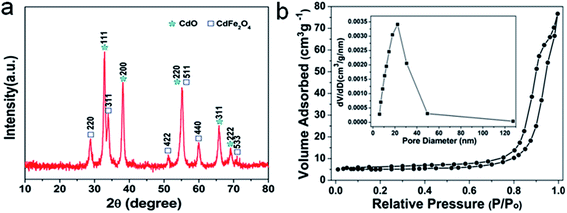 | ||
| Fig. 1 (a) XRD pattern and (b) N2 adsorption–desorption isotherm and pore-size distribution curve (inset) of the as-obtained 1D porous CdO/CdFe2O4 HNNs. | ||
Fig. 2 shows the SEM images of the as-prepared 1D Cd2Fe(CN)6 NNs and porous CdO/CdFe2O4 HNNs. A panoramic view of the as-obtained Cd2Fe(CN)6 precursor (Fig. 2a) reveals that the sample is composed of uniform 1D needle-like nanostructures with a diameter of ca. 300 nm and ca. 10 μm in length. The high-magnification image (Fig. 2b) of a single Cd2Fe(CN)6 NN further display the surface of the precursor is rather smooth. Fig. 2c and d display the SEM images of the as-prepared 1D porous CdO/CdFe2O4 HNNs, which are significantly different from those of the precursor. The rough surface and the disordered pores can be obviously observed, but the 1D needle-like morphology is well preserved, indicating that the as-obtained 1D porous structure is stability. This result also confirms the successful conversion of Cd2Fe(CN)6 NNs into porous CdO/CdFe2O4 HNNs.
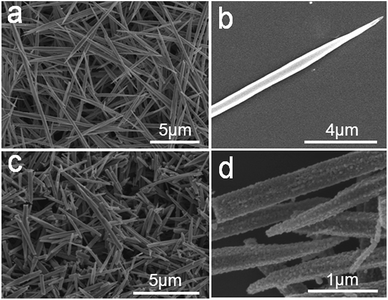 | ||
| Fig. 2 SEM images of the as-prepared (a) and (b) 1D Cd2Fe(CN)6 NNs precursor; (c) and (d) 1D porous CdO/CdFe2O4 HNNs. | ||
The structural information and characterization of the as-obtained 1D porous CdO/CdFe2O4 HNNs was verified by TEM image, as shown in Fig. 3a. It further reveals that needle-like structure has rough surface, which is in agreement with the SEM observations. From the enlarged TEM images (Fig. 3b and c), the 1D needle-like morphology is completely composed of numerous nanoparticles and the porous structure on the surface of HNN can be clearly observed. HRTEM image (Fig. 3d) shows the clear lattice spacings of 0.23 and 0.26 nm are corresponding to the (200) plane of cubic phase CdO and (311) plane of cubic phase CdFe2O4, respectively. The spatial distribution of the compositions in a single CdO/CdFe2O4 HNN is also studied by elemental mapping. As shown in Fig. 3e–h, the mapping results show uniform distribution of O, Fe and Cd elements throughout the entire 1D HNN.
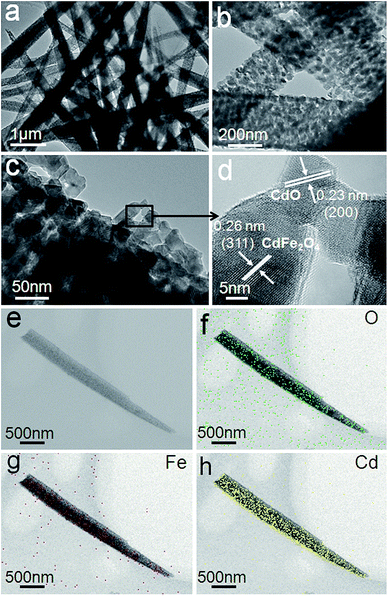 | ||
| Fig. 3 (a–c) TEM images and (d) HRTEM image of the as-prepared 1D porous CdO/CdFe2O4 HNNs. (e) STEM image and (f) O, (g) Fe and (h) Cd elemental mapping images of a single CdO/CdFe2O4 HNN. | ||
3.2 The adsorption capacity of CR
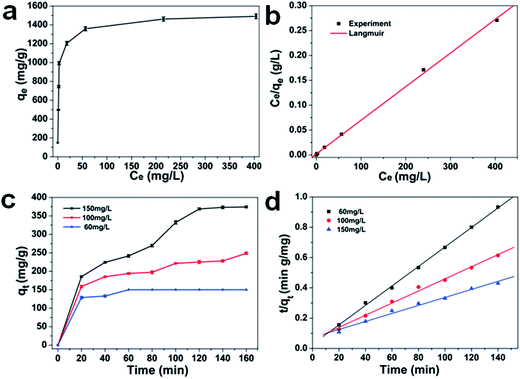
Inspired by the porous structure, the as-prepared 1D CdO/CdFe2O4 HNNs possess more active adsorption sites and efficient transport pathways, which may contribute to excellent adsorption performance. In this work, we have studied the performance of the as-prepared product as a new type of adsorbent, and CR is chosen as a model organic pollutant. The repeated adsorption isotherm and standard deviations of CR at different initial concentrations are shown in Fig. 4a. The adsorption capacity can be determined using the follow expression (eqn (2)):| qt = (C0 − Ct)V/m | (2) |
Here, qt is the adsorption capacity, C0 and Ct are the initial and final (after adsorption) concentrations of CR (mg L−1), V is the volume of CR solution (L), and m is the mass of the as-prepared 1D porous CdO/CdFe2O4 HNNs (g). It can be found that the removal capacity rises dramatically with the increasing equilibrium concentration of CR ranging from 0 to 56.4 mg L−1, and then the trend turns slowly until to reach the saturation value. It can be explained by the fact that the higher initial CR concentration provides a higher driving force, which could promote dye ions from the solution to the surface of the 1D HNNs, and cause more collisions between active sites and dye ions on the adsorbents. When the initial concentration of CR is 1000 mg L−1, the maximum adsorption capacity can reach ca. 1491 mg g−1. The removal capacities of CR using the porous CdO/CdFe2O4 HNNs as adsorbent and other adsorbents reported previously are listed in Table S1 (see ESI†). It can be seen that most of the adsorption capacity of the adsorbent was less 500 mg g−1, and only a few higher than 1000 mg g−1.33–38 Therefore, we can conclude that the as-prepared 1D porous HNNs possess superior adsorption performance.
3.3 Adsorption isotherms
Adsorption isotherm provides specific information both the capacity of the adsorbent and the interactions between adsorbent and CR molecules. Establishing the most appropriate correlations for the equilibrium adsorption capacity of the adsorption system is requested. Among of the most commonly applied isotherm theories, the Langmuir (eqn (3)) and Freundlich (eqn (5)) isotherms were usually used to describe this adsorption process. The Langmuir isotherm is based on the hypothesis that the structure of adsorbent is homogeneous, where all adsorption sites are identical and energetically equivalent (eqn (3)).39
 | (3) |
And the linear form can be expressed as follows (eqn (4)):
 | (4) |
In which Ce and qe are as mentioned above, qm (mg g−1) is the theoretical maximum monolayer adsorption capacity and KL (L mg−1) is the Langmuir adsorption constants related to adsorption rate.
The Freundlich model represents a heterogeneous system and reversible adsorption, which is characterized by a heterogeneity factor of 1/n. This model is not restricted to monolayer formation (eqn (5)).39
| qe = KFCe1/n | (5) |
Meanwhile, eqn (5) can also be rearranged to obtain a linear form (eqn (6)):
 | (6) |
For the Freundlich mode, the constant KF (L mg−1) and n are the Freundlich adsorption constant, KF is roughly adsorption capacity at a unit concentration, and n is the adsorption intensity.
Both of the Langmuir and the Freundlich models were applied to analyze the equilibrium adsorption data of CR onto porous CdO/CdFe2O4 HNNs adsorbent. The plots are shown in Fig. 4b and S2a (see ESI†). Additionally, Table S2 (see ESI†) summarizes the model parameters calculated from the slope and intercept of the both models, as well as the coefficients of determination R2. For Langmuir model, the correlation coefficient is R2 = 0.99978, while R2 = 0.75854 for the Freundlich model. Therefore, the adsorption process of CR on the porous CdO/CdFe2O4 HNNs obeys Langmuir model, indicating the adsorbed layer is monolayer coverage. The calculated adsorption capacity (qe,cal) from Langmuir model of the product for CR can be estimated to be 1494 mg g−1, which is close to the experimental value (1491 mg g−1).
3.4 Adsorption kinetics
To study the effect of contact time and evaluate properties, adsorption kinetic experiments were further performed. Fig. 4c shows the effect of contact time at different initial concentrations (60, 100, 150 mg L−1) and standard deviations with 1D porous CdO/CdFe2O4 HNNs. From this plot, the adsorption capacity for CR rises with the increase of adsorption time, reaching adsorption equilibrium at about 60, 100 and 120 min for 60 mg L−1, 100 mg L−1 and 150 mg L−1, respectively. Two famous pseudo-first-order (eqn (7)) and pseudo-second-order (eqn (8)) kinetic models39 were used to investigate the characteristics of the adsorption process.
ln(qe − qt) = ln![[thin space (1/6-em)]](https://www.rsc.org/images/entities/char_2009.gif) qe − k1t qe − k1t
| (7) |
 | (8) |
Where qt (mg g−1) is the value of CR adsorbed at any time t (min), and k1 (min−1) and k2 (g mg−1 min−1) are the rate constants of pseudo-first-order and pseudo-second-order rate constants, respectively. Linear regressions of the two models are shown in Fig. 4d and S2b (see ESI†), and the corresponding model constants and standard deviations as well as the coefficients of determination R2 are summarized in Table 1. By comparison, the R2 of the pseudo-second-order model is obviously superior than that of the pseudo-first-order model. Thus, the pseudo-second-order model can be fitted well with experimental data in this case. In addition, the qe,cal of pseudo-second-order model is also close to the value of qe,exp, which further confirms that pseudo-second-order model can be more suitable to describe the adsorption process.
| C0 (mg L−1) | Pseudo-first-order model | Pseudo-second-order model | ||||||||
|---|---|---|---|---|---|---|---|---|---|---|
| Experimental qe, (mg g−1) | Calculated qe, (mg g−1) | k1 (g mg−1 min−1) | R2 | S.D. (%) | Experimental qe, (mg g−1) | Calculated qe, (mg g−1) | k2 (g mg−1 min−1) | R2 | S.D. (%) | |
| 60 | 150.0 | 112.1 | 5.44 × 10⁻² | 0.646 | 71.3 | 150.0 | 155.5 | 1.53 × 10⁻³ | 0.998 | 1.05 |
| 100 | 248.7 | 157.9 | 1.59 × 10⁻² | 0.889 | 27.1 | 248.7 | 250.0 | 2.70 × 10⁻⁴ | 0.992 | 1.48 |
| 150 | 374.2 | 289.6 | 1.29 × 10⁻² | 0.942 | 15.5 | 374.2 | 377.3 | 9.74 × 10⁻⁵ | 0.984 | 1.41 |
3.5 Adsorption mechanism
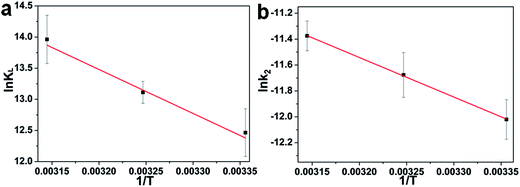
According to the work reported in literature,40 the range of the free energy (ΔG0) reflects indirectly the type of adsorption. The change of ΔG0 of physisorption is between −20 and 0 kJ mol−1. When ΔG0 is ranging from −20 to −80 kJ mol−1, the type of adsorption can be attributed to the physisorption together with chemisorption, and chemisorption is between −80 and −400 kJ mol−1. The calculation formula of the changes in thermodynamic parameters of free energy (ΔG0), enthalpy (ΔH0), and entropy (ΔS0) are calculated as the following [eqn (9) and (10)]:
ΔG0 = −RT![[thin space (1/6-em)]](https://www.rsc.org/images/entities/char_2009.gif) ln ln![[thin space (1/6-em)]](https://www.rsc.org/images/entities/char_2009.gif) KL KL
| (9) |
 | (10) |
![[thin space (1/6-em)]](https://www.rsc.org/images/entities/char_2009.gif) KL versus 1/T are 58.71 kJ mol−1 and 299.94 J mol−1 K−1, respectively. The positive value of ΔH0 indicates the process of adsorption is endothermic.41,42 Meanwhile, the positive value of ΔS0 reflects the affinity of adsorbent for CR and indicates some structural changes in adsorbent and dye.
KL versus 1/T are 58.71 kJ mol−1 and 299.94 J mol−1 K−1, respectively. The positive value of ΔH0 indicates the process of adsorption is endothermic.41,42 Meanwhile, the positive value of ΔS0 reflects the affinity of adsorbent for CR and indicates some structural changes in adsorbent and dye.
| Temperature (K) | ΔG0 (kJ mol−1) | ΔH0 (kJ mol−1) | ΔS0 (J mol−1 K −1) | Ea (kJ mol−1) |
|---|---|---|---|---|
| 298 | −30.88 | |||
| 308 | −33.57 | 58.71 | 299.94 | 25.4 |
| 318 | −36.91 |
As mentioned above, the kinetic model for the adsorption of CR onto porous CdO/CdFe2O4 HNNs can be recognized as the pseudo-second-order model. Therefore, the activation energy of the adsorption process is calculated adopting the rate constants (k2) of the pseudo-second-order model by using the Arrhenius equation as follows (eqn (11)):43
 | (11) |
![[thin space (1/6-em)]](https://www.rsc.org/images/entities/char_2009.gif) k2 and 1/T (Fig. 5b) for the process of adsorbing CR on the 1D HNNs, Ea is found to be 25.4 kJ mol−1. The physisorption generally has activation energy ranging from 5–40 kJ mol−1, while chemisorption has a larger activation energy (40–800 kJ mol−1).42,44 As a consequence of ΔG0, ΔH0, and Ea, all values indicate that the adsorption process of CR on porous CdO/CdFe2O4 HNNs follows physisorption.
k2 and 1/T (Fig. 5b) for the process of adsorbing CR on the 1D HNNs, Ea is found to be 25.4 kJ mol−1. The physisorption generally has activation energy ranging from 5–40 kJ mol−1, while chemisorption has a larger activation energy (40–800 kJ mol−1).42,44 As a consequence of ΔG0, ΔH0, and Ea, all values indicate that the adsorption process of CR on porous CdO/CdFe2O4 HNNs follows physisorption.
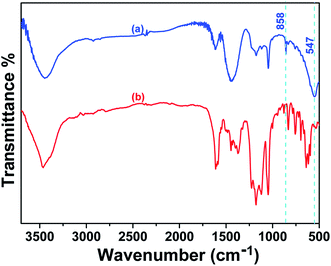
The removal of CR may be connected with the electrostatic attraction and surface complexation through hydrogen bonding between the adsorbent and CR molecules.19,44–48 As what has been discussed above, it would be reasonable to believe the existence of electrostatic attraction between CR and porous CdO/CdFe2O4 HNNs. In order to confirm the complexation effect, SEM and the FT-IR spectra of the as-prepared porous CdO/CdFe2O4 HNNs after test were also carried out. The SEM images of CR-loaded adsorbent (Fig. S4, see ESI†) show that the surface of the 1D HNNs is still rough, but no pores can be observed, which is a powerful proof that CR attach on the surface of adsorbent. FT-IR analysis further reveals the molecular and structural changes of CR and CR-loaded adsorbent. Fig. 6a shows the FT-IR spectrum of the CR-loaded adsorbent, in which the weak bond at 3448 cm−1 can be attributed to the N–H stretching vibration. The bond at 1618 cm−1 can be indexed to the C–C stretching vibration in benzene. The adsorption at 1448 and 1176 cm−1 are due to the framework vibration of benzene rings. The adsorption at 1047 cm−1 is the characteristic adsorption peak of S![[double bond, length as m-dash]](https://www.rsc.org/images/entities/char_e001.gif) O stretching vibration. Compared with the FT-IR spectrum of CR (Fig. 6b), there are two new peaks at 858.2 and 547.6 cm−1, adsorptions at 858.2 cm−1 is due to the Cd–O–H bending49 and 547.6 cm−1 represents Cd–O symmetrical stretching vibration.50 It have been reported that the oxygen atom of the S
O stretching vibration. Compared with the FT-IR spectrum of CR (Fig. 6b), there are two new peaks at 858.2 and 547.6 cm−1, adsorptions at 858.2 cm−1 is due to the Cd–O–H bending49 and 547.6 cm−1 represents Cd–O symmetrical stretching vibration.50 It have been reported that the oxygen atom of the S![[double bond, length as m-dash]](https://www.rsc.org/images/entities/char_e001.gif) O group can be used as the hydrogen-bonding acceptor and produce intramolecular hydrogen bonding with the oxygen-containing functional group of alkali-activated carbon nanotubes.19 Here, S
O group can be used as the hydrogen-bonding acceptor and produce intramolecular hydrogen bonding with the oxygen-containing functional group of alkali-activated carbon nanotubes.19 Here, S![[double bond, length as m-dash]](https://www.rsc.org/images/entities/char_e001.gif) O group of CR and the O group of CdO can form intramolecular hydrogen bonding and then produces Cd(OH)2. Therefore, we can conclude that electrostatic attraction and surface complexation both contribute to the adsorption performance of CR on porous CdO/CdFe2O4 HNNs. In this case, the CR and adsorbent attract to each other under the effect of electrostatic attraction, and mesopores can provide a large number of active sites, which greatly promote the contact area. Additionally, the surface complexation via hydrogen bonding between the protonation hydroxyl of CdO/CdFe2O4 and sulfonate groups (–SO3−) of CR may be a vital factor for the adsorption.51 These results result in the excellent adsorption performance of the as-prepared 1D porous HNNs.
O group of CR and the O group of CdO can form intramolecular hydrogen bonding and then produces Cd(OH)2. Therefore, we can conclude that electrostatic attraction and surface complexation both contribute to the adsorption performance of CR on porous CdO/CdFe2O4 HNNs. In this case, the CR and adsorbent attract to each other under the effect of electrostatic attraction, and mesopores can provide a large number of active sites, which greatly promote the contact area. Additionally, the surface complexation via hydrogen bonding between the protonation hydroxyl of CdO/CdFe2O4 and sulfonate groups (–SO3−) of CR may be a vital factor for the adsorption.51 These results result in the excellent adsorption performance of the as-prepared 1D porous HNNs.
4. Conclusion
In conclusion, a new type of adsorbent based on 1D porous CdO/CdFe2O4 HNNs have been successfully prepared by a simple sacrificial template strategy. The solid Cd2Fe(CN)6 NNs are first synthesized through a simple low-temperature hydrothermal process and then convert into the corresponding porous CdO/CdFe2O4 HNNs after thermal treatment. Benefiting the unique structural features, the resulting product was applied to remove the CR dye in aqueous solution, which exhibit outstanding adsorption performance with a maximum adsorption capacity of 1491 mg g−1. The adsorption process of the CR on porous CdO/CdFe2O4 HNNs fits well with the pseudo-second-order rate equation and Langmuir adsorption model. We believe that this simple and scaled-up preparation strategy can be extended to synthesize other 1D porous nanostructures for various applications.Acknowledgements
Financial support from the Natural Science Foundation of China (21671173), Zhejiang Provincial Natural Science Foundation of China (LR14B010001), and the Zhejiang Provincial Public Welfare Project (2016C31015) are gratefully acknowledged.References
- L. Ai, H. Yue and J. Jiang, Nanoscale, 2012, 4, 5401–5408 RSC.
- H.-Y. Jing, T. Wen, C.-M. Fan, G.-Q. Gao, S.-L. Zhong and A.-W. Xu, J. Mater. Chem. A, 2014, 2, 14563–14570 CAS.
- L. Wu, Y. Liu, L. Zhang and L. Zhao, Dalton Trans., 2014, 43, 5393–5400 RSC.
- W. Chen, W. Lu, Y. Yao and M. Xu, Environ. Sci. Technol., 2007, 41, 6240–6245 CrossRef CAS PubMed.
- G. Chen, Sep. Purif. Technol., 2004, 38, 11–41 CrossRef CAS.
- Y. Hu, X. Gao, L. Yu, Y. Wang, J. Ning, S. Xu and X. W. Lou, Angew. Chem., Int. Ed., 2013, 52, 5636–5639 CrossRef CAS PubMed.
- X. Gao, H. B. Wu, L. Zheng, Y. Zhong, Y. Hu and X. W. Lou, Angew. Chem., Int. Ed., 2014, 53, 5917–5921 CrossRef CAS PubMed.
- H. B. Wu, H. H. Hng and X. W. Lou, Adv. Mater., 2012, 24, 2567–2571 CrossRef CAS PubMed.
- A. Majcen-Le Marechal, Y. M. Slokar and T. Taufer, Dyes Pigm., 1997, 33, 281–298 CrossRef CAS.
- M. Zhou, X. Gao, Y. Hu, J. Chen and X. Hu, Appl. Catal., B, 2013, 138–139, 1–8 CrossRef CAS.
- S. Chakraborty, M. K. Purkait, S. DasGupta, S. De and J. K. Basu, Sep. Purif. Technol., 2003, 31, 141–151 CrossRef CAS.
- L. Ai, C. Zhang and Z. Chen, J. Hazard. Mater., 2011, 192, 1515–1524 CrossRef CAS PubMed.
- Z. Yan, G. Li, L. Mu and S. Tao, J. Mater. Chem., 2006, 16, 1717–1725 RSC.
- L. Ai, C. Zhang, F. Liao, Y. Wang, M. Li, L. Meng and J. Jiang, J. Hazard. Mater., 2011, 198, 282–290 CrossRef CAS PubMed.
- S. Babel and T. A. Kurniawan, Chemosphere, 2004, 54, 951–967 CrossRef CAS PubMed.
- M. Ghaedi, A. Ansari, M. H. Habibi and A. R. Asghari, J. Ind. Eng. Chem., 2014, 20, 17–28 CrossRef CAS.
- Y. Yu, Y.-Y. Zhuang, Z.-H. Wang and M.-Q. Qiu, Ind. Eng. Chem. Res., 2003, 42, 6898–6903 CrossRef CAS.
- Y. Su, H. Cui, Q. Li, S. Gao and J. K. Shang, Water Res., 2013, 47, 5018–5026 CrossRef CAS PubMed.
- J. Ma, F. Yu, L. Zhou, L. Jin, M. Yang, J. Luan, Y. Tang, H. Fan, Z. Yuan and J. Chen, ACS Appl. Mater. Interfaces, 2012, 4, 5749–5760 CAS.
- J. B. Fei, Y. Cui, X. H. Yan, W. Qi, Y. Yang, K. W. Wang, Q. He and J. B. Li, Adv. Mater., 2008, 20, 452–456 CrossRef.
- J. Fei, Y. Cui, J. Zhao, L. Gao, Y. Yang and J. Li, J. Mater. Chem., 2011, 21, 11742–11746 RSC.
- W. Cai, J. Yu and M. Jaroniec, J. Mater. Chem., 2010, 20, 4587–4594 RSC.
- B. Wang, H. Wu, L. Yu, R. Xu, T. T. Lim and X. W. Lou, Adv. Mater., 2012, 24, 1111–1116 CrossRef CAS PubMed.
- H. Xiao, Z. Ai and L. Zhang, J. Phys. Chem. C, 2009, 113, 16625–16630 CAS.
- F. Mou, J. Guan, H. Ma, L. Xu and W. Shi, ACS Appl. Mater. Interfaces, 2012, 4, 3987–3993 CAS.
- X. Y. Yu, R. X. Xu, C. Gao, T. Luo, Y. Jia, J. H. Liu and X. J. Huang, ACS Appl. Mater. Interfaces, 2012, 4, 1954–1962 CAS.
- X. Chen, F. Zhang, Q. Wang, X. Han, X. Li, J. Liu, H. Lin and F. Qu, Dalton Trans., 2015, 44, 3034–3042 RSC.
- X. Sun, W. Luo, L. Chen, L. Zheng, C. Bao, P. Sun, N. Huang, Y. Sun, L. Fang and L. Wang, RSC Adv., 2016, 6, 2241–2251 RSC.
- J. Wei, Y. Feng, Y. Liu and Y. Ding, J. Mater. Chem. A, 2015, 3, 22300–22310 CAS.
- A. Etogo, E. Hu, C. Zhou, Y. Zhong, Y. Hu and Z. Hong, J. Mater. Chem. A, 2015, 3, 22413–22420 CAS.
- R. Qiao, M. Mao, E. Hu, Y. Zhong, J. Ning and Y. Hu, Inorg. Chem., 2015, 54, 9033–9039 CrossRef CAS PubMed.
- A. Etogo, R. Liu, J. Ren, L. Qi, C. Zheng, J. Ning, Y. Zhong and Y. Hu, J. Mater. Chem. A, 2016, 4, 13242–13250 CAS.
- H.-Y. Zhu, R. Jiang, Y.-Q. Fu, R.-R. Li, J. Yao and S.-T. Jiang, Appl. Surf. Sci., 2016, 369, 1–10 CrossRef CAS.
- L. Wang, J. Li, Y. Wang, L. Zhao and Q. Jiang, Chem. Eng. J., 2012, 181–182, 72–79 CrossRef CAS.
- C. Lei, X. Zhu, Y. Le, B. Zhu, J. Yu and W. Ho, RSC Adv., 2016, 6, 10272–10279 RSC.
- G. Li, Y. Sun, X. Li and Y. Liu, RSC Adv., 2016, 6, 11855–11862 RSC.
- Z. Li, Y. Du, S. Zhang, Z. Chen, K. Yang, X. Lv and C. Zhu, RSC Adv., 2016, 6, 89699–89707 RSC.
- Y. Zhang, S. Xu, Y. Luo, S. Pan, H. Ding and G. Li, J. Mater. Chem., 2011, 21, 3664 RSC.
- J. Hu, Z. Song, L. Chen, H. Yang, J. Li and R. Richards, J. Chem. Eng. Data, 2010, 55, 3742–3748 CrossRef CAS.
- A. Meng, J. Xing, Z. Li and Q. Li, ACS Appl. Mater. Interfaces, 2015, 7, 27449–27457 CAS.
- M. Kara, H. Yuzer, E. Sabah and M. S. Celik, Water Res., 2003, 37, 224–232 CrossRef CAS PubMed.
- Y. Yao, F. Xu, M. Chen, Z. Xu and Z. Zhu, Bioresour. Technol., 2010, 101, 3040–3046 CrossRef CAS PubMed.
- C. H. Wu, J. Colloid Interface Sci., 2007, 311, 338–346 CrossRef CAS PubMed.
- H. Nollet, M. Roels, P. Lutgen, P. Van der Meeren and W. Verstraete, Chemosphere, 2003, 53, 655–665 CrossRef CAS PubMed.
- W. Q. Cai, J. G. Yu, B. Cheng, B. L. Su and M. Jaroniec, J. Phys. Chem. C, 2009, 113, 14739–14746 CAS.
- B. Cheng, Y. Le, W. Cai and J. Yu, J. Hazard. Mater., 2011, 185, 889–897 CrossRef CAS PubMed.
- F. Yu, J. Ma and Y. Wu, J. Hazard. Mater., 2011, 192, 1370–1379 CrossRef CAS PubMed.
- F. Yu, Y. Wu and J. Ma, J. Hazard. Mater., 2012, 237–238, 102–109 CrossRef CAS PubMed.
- V. R. Shinde, H. S. Shim, T. P. Gujar, H. J. Kim and W. B. Kim, Adv. Mater., 2008, 20, 1008–1012 CrossRef CAS.
- F. T. Thema, P. Beukes, A. Gurib-Fakim and M. Maaza, J. Alloys Compd., 2015, 646, 1043–1048 CrossRef CAS.
- C. C. Yu, X. P. Dong, L. M. Guo, J. T. Li, F. Qin, L. X. Zhang, J. L. Shi and D. S. Yan, J. Phys. Chem. C, 2008, 112, 13378–13382 CAS.
Footnote |
| † Electronic supplementary information (ESI) available. See DOI: 10.1039/c6ra27000j |
| This journal is © The Royal Society of Chemistry 2017 |


