 Open Access Article
ZnO nanorods assembled with different porphyrins – size-tunable hybrid particles†
Jasmin Düring and
Franziska Gröhn*
Department of Chemistry and Pharmacy, Interdisciplinary Center for Molecular Materials, Friedrich-Alexander-University Erlangen-Nürnberg, Egerlandstraße 3, 91058 Erlangen, Germany. E-mail: franziska.groehn@fau.de
First published on 13th January 2017
Abstract
We present a fundamental study on ZnO nanorod–porphyrin assembly formation in solution, providing the key to novel tunable hybrid assemblies with potential in solar energy conversion. The combination of 40 nm ZnO nanorods with ionic porphyrins – meso-tetra(4-carboxyphenyl)porphyrin (TCPP) and meso-tetra-(4-sulfonatophenyl)porphyrin (TPPS) – results in the formation of novel well-defined hybrid assemblies which are stable in solution and exhibit an adjustable size up to 500 nm. Structures have been characterized with dynamic light scattering (DLS), transmission electron microscopy (TEM) and absorption and emission spectroscopy. In particular, the combination of both porphyrins with ZnO in a ternary assembly yields a large stability range in terms of the TCPP/ZnO ratio and may be of significance as a hybrid system for solar cells or photocatalysis.
Introduction
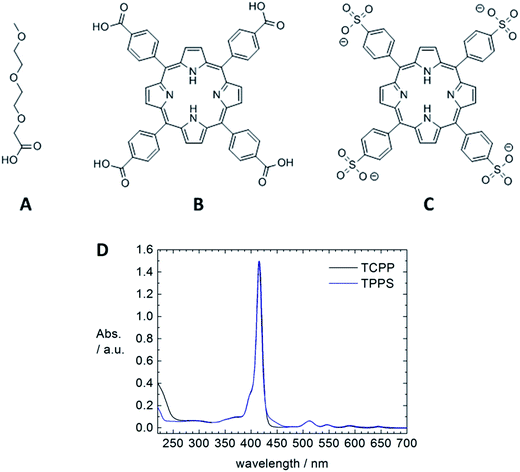
A powerful method to build hybrid nanostructures in solution and on surfaces is self-assembly, that is the formation of organized structures from a disordered system of building blocks. Driving forces can be hydrogen bonding, ionic interactions, π–π stacking, metal coordination or van der Waals interactions. A large range of structures and potential applications is accessible through the concept of self-assembly.1 Yet, in particular for more complex and functional structures, fundamental knowledge on structure formation and control is limited but highly desirable for a broad and targeted exploitation of self-assembly.Combining semiconducting ZnO nanostructures with porphyrins as light harvesting component through self-assembly may have significant impact in the field of solar energy conversion.2,3 With this motivation, we herein fundamentally investigate the assembly formation of ZnO nanorods with different porphyrins that can interact with the ZnO surface due to ionic interaction and metal coordination. Both, meso-tetra(4-carboxyphenyl)porphyrin (TCPP) and meso-tetra-(4-sulfonatophenyl)porphyrin (TPPS) (Fig. 2) have four functional groups which are able to bind to a ZnO surface, so that the porphyrin molecules can act as linker and interconnect ZnO nanorods to into larger organic–inorganic hybrid assemblies. We elucidate influences on the structure formation such as choice and ratio of the building blocks and influence of sonication on the structure formation. Resulting hybrid structures are characterized by dynamic light scattering (DLS), transmission electron microscopy (TEM) and spectroscopic methods. The versatility of this modular and supramolecular approach bears high potential for the formation of functional hybrid nanostructures.
Experimental section
Chemicals
meso-Tetra(4-carboxyphenyl)porphyrin (TCPP) was obtained from TriPorTech GmbH (Germany), meso-tetra-(4-sulfonatophenyl)porphyrin tetrasodium salt (TPPS, 98.0%) was received from Fluka and all other chemicals were purchased from Sigma-Aldrich®. All solvents were filtered before use with 0.2 μm Millipore PTFE filters to remove dust.Synthesis of ZnO nanorods
The ZnO rods were prepared according to literature.4 Zinc acetate (0.82 g, 4.5 mmol, 99.99%) was dissolved in 42 mL methanol and 0.25 mL water was added. Under vigorous stirring at 60 °C a solution of 0.49 g KOH (8.75 mmol, 99.99%) in 23 mL MeOH was added dropwise. During the addition of the KOH solution, the reaction mixture turned opaque. After 2 h 15 min stirring at 60 °C the solution was concentrated to 10 mL at a rotary pump and further stirred at 65 °C for 22 h. Then the solution was left at rest to decant. The white precipitate was dispersed in MeOH, centrifuged at 3000 rpm for 5 min and then dispersed in ethanol.TODA stabilization of ZnO nanorods
To stabilize the ZnO nanorods in solution [2-(2-(2-methoxyethoxy)ethoxy)acetic acid] (TODA, technical grade) was used.5 For this the as prepared ZnO nanorods were centrifuged at 2000 rpm for 5 min and then redispersed in an ethanolic TODA solution with a concentration of c(TODA) = 1.27 × 10⁻² mol L−1. To remove excess TODA the solution was centrifuged at 15![[thin space (1/6-em)]](https://www.rsc.org/images/entities/char_2009.gif) 000 rpm for 1.5 h and redispersed in ethanol. The final ZnO solution, which was used for sample preparation, had a particle concentration of c(ZnO) = 3.77 × 10¹⁷ particles per L. The ZnO particles had a length of 38.6 nm ± 15.4 nm and a diameter of 9.5 nm ± 1.2 nm (130 particles analyzed with TEM).
000 rpm for 1.5 h and redispersed in ethanol. The final ZnO solution, which was used for sample preparation, had a particle concentration of c(ZnO) = 3.77 × 10¹⁷ particles per L. The ZnO particles had a length of 38.6 nm ± 15.4 nm and a diameter of 9.5 nm ± 1.2 nm (130 particles analyzed with TEM).
Sample preparation
The stock solution of meso-tetra(4-carboxyphenyl)porphyrin (TCPP) in ethanol had a concentration of c(TCPP) = 1.7 × 10⁻⁴ mol L−1. Due to the insufficient solubility of meso-tetra-(4-sulfonatophenyl)porphyrin (TPPS) in ethanol at high concentrations, the TPPS stock solution was prepared in filtered methanol with a concentration of c(TPPS) = 9.4 × 10⁻⁴ mol L−1. The concentration of TPPS in the samples was low enough for the TPPS to be completely dissolved, which was confirmed with absorption spectroscopy. Both porphyrin stock solutions were filtered with hydrophilic 0.2 μm Millipore PTFE filters to remove dust. Directly before sample preparation the ZnO rod stock solution always was sonicated (860 W) for a few minutes. The light scattering samples were prepared by subsequently mixing filtered ethanol and the desired amounts of the stock solutions via stirring at 990 rpm in dust free glass vials. The ZnO particle concentration in the sample solutions was kept constant at c(ZnO) = 2.0 × 10¹⁶ particles per L.Light scattering
The measurements were performed in dust free light scattering cuvettes at an instrument which was equipped with a red HeNe laser (λ = 632.8 nm; 20 mW), an ALV 5000 correlator with 320 channels (ALV GmbH, Langen, Germany) and an ALV CGS 3 goniometer. The measurements covered an angular range of 30° ≤ θ ≤ 150°. The intensity autocorrelation function g2(τ) for each angle was transferred into the electric field autocorrelation function g1(τ) via the Siegert relation. The electric field autocorrelation function g1(τ) was successively transformed into the distribution of relaxation times A(τ) by a regularized inverse Laplace transformation using the program CONTIN developed by S. Provencher.6 From the distribution of relaxation times the apparent diffusion coefficient was calculated and via extrapolation to zero scattering vector square the diffusion coefficient was obtained, with which the hydrodynamic radius was received via Stokes–Einstein relation. The error bars were calculated from the error of the extrapolation to zero scattering vector square as described above.UV-Vis spectroscopy
Absorption spectra were recorded on a SHIMADZU UV Spectrophotometer (UV-1800) with a slit width of 1.0 nm.Emission spectroscopy
Emission spectra were recorded on a FluoroMax-3 from Horiba Scientific using 1 cm fluorescence quartz cuvettes.TEM
Transmission electron microscopy (TEM) images were acquired with a Zeiss EM 900 microscope or a Zeiss EM912 microscope, both operated at 80 kV at magnifications ranging from 20![[thin space (1/6-em)]](https://www.rsc.org/images/entities/char_2009.gif) 000× to 250
000× to 250![[thin space (1/6-em)]](https://www.rsc.org/images/entities/char_2009.gif) 000×. The specimens were prepared by depositing 5 μL of the undiluted sample solution onto carbon-coated copper grids, 300 mesh, and immediately remove the solvent via capillary forces.
000×. The specimens were prepared by depositing 5 μL of the undiluted sample solution onto carbon-coated copper grids, 300 mesh, and immediately remove the solvent via capillary forces.
Results and discussion
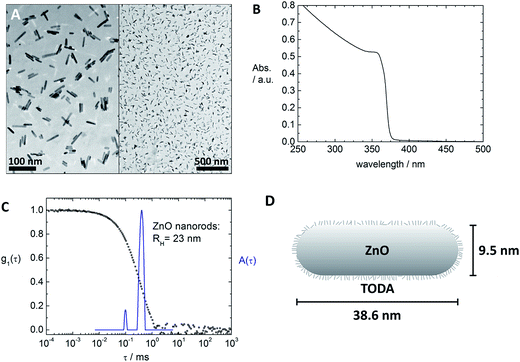
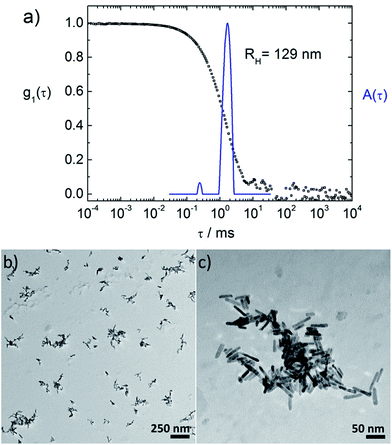
Fig. 1 and 2 depict the building blocks used for supramolecular structure formation in this study. The ZnO nanorods were prepared according to literature as described in the experimental part4 and subsequently coated with [2-(2-(2-methoxyethoxy)ethoxy)acetic acid] (TODA) (Fig. 2A) to provide extended stability in solution.5 The characterization of the functionalized ZnO nanorods with transmission electron microscopy (TEM), UV-Vis spectroscopy and dynamic light scattering (DLS) revealed defined ZnO nanorods with an average size of 38.6 nm × 9.5 nm (Fig. 1A–C). Transmission electron microscopy (TEM) of a TODA stabilized ZnO sample (Fig. 1A) shows individual rods in coexistence with small bundles of up to 10 rods.These ZnO nanorods serve as inorganic building block and can be interconnected by the porphyrins TCPP or TPPS, forming larger hybrid structures, as evident from both, TEM and DLS results in Fig. 3b and c: the carboxylic groups of the TCPP and the sulfonic acid groups of TPPS can bind to the ZnO surface by bridging, ester-like or bidentate binding of the oxygen atoms with zinc atoms.4d,7 Due to the presence of four functional groups per porphyrin molecules, the porphyrin molecules are able to interconnect the ZnO nanorods by binding to nanoparticle surfaces of two different nanoparticles yielding larger structures of porphyrin-interconnected ZnO nanorods.‡ Here, the interconnection does not only result in the structural change of the system, but also in a functional change, as the porphyrin can interact with ZnO electronically, acting as a light harvester and inducing electrons into the ZnO semiconductor.
Assemblies with TCPP
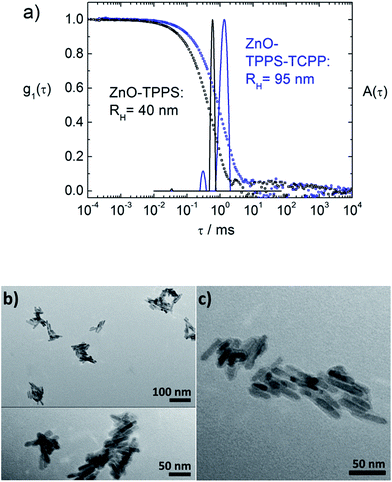
First the interconnection of the ZnO rods by addition of different amounts of TCPP is examined. For this, the ratio of porphyrin and ZnO is denoted molar ratio rM and defined as number of porphyrin molecules N(porphyrin) per ZnO nanorod N(ZnO).Fig. 3a shows dynamic light scattering result of a ZnO–TCPP assembly solution. In contrast to the hydrodynamic radius of RH = 23 nm of the ZnO rods (Fig. 1C), the assemblies are larger and show a size of RH = 129 nm with a size distribution width of σ = 0.22. Hence, multiple rods have become associated into a larger nanoscale assembly through the porphyrins and these assemblies exhibit a well-defined size in solution. Fig. 3b and c visualize these assemblies by TEM, again demonstrating the association of multiple ZnO nanorods. The TEM images show anisotropic assemblies, where due to the low electron contrast of organic material only the ZnO rods are visible. The overall assembly sizes are in good agreement with the DLS measurement.
Considering both, DLS and TEM in conjunction, it is important to note that the hydrodynamic radius RH as obtained in DLS represents the radius of a diffusion equivalent sphere, that is, a dynamic property. On its own, it does not give information on the multiple length scales of particles with anisotropic shapes and/or internal structure but is a good measure of the overall dimension, the width of the size distribution, possible coexistence of multiple sizes, all directly measured in solution with the measurement covering a large particle number. Complementary, TEM visualizes the structure “fully” while one has to keep in mind that the sample is dried on a two-dimensional surface which can cause significant structural changes to the solution structure. Thus, it is best to view both very different methods in combination. In front of this background, TEM and DLS are in good agreement for all investigated samples presented in this study; that is, it was possible to image individual assemblies in TEM.
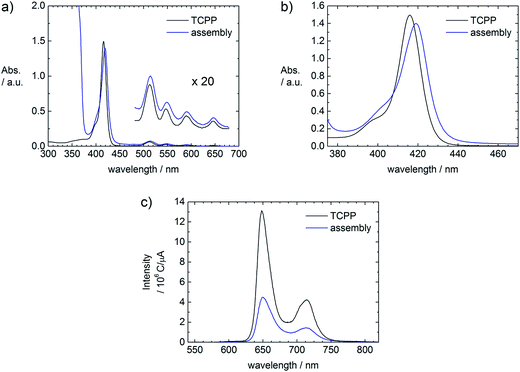
The assembly formation can also be followed spectroscopically. Comparing UV-Vis spectra of a TCPP and a ZnO–TCPP assembly solution, a red shift of 3 nm from 416 nm to 419 nm is observed (Fig. 4a and b), which is understood as the upright binding of TCPP with one or two carboxyl-groups to the surface of ZnO.4d,7a,c,d,8 A flat face-to-face like conformation of the porphyrin would result in the metalation of the porphyrin cavity, which would lead to a shift of the Soret band to 425 nm and the presence of only two Q bands instead of four. These spectral changes are indeed observed, but only after an aging time of several days (Fig. S1†). Therefore the initial assembly formation is driven by the upright binding of TCPP to the ZnO surface, which leads to the interconnection of several ZnO nanorods. The comparison of emission spectra of the porphyrin solution and a fresh assembly solution shows a quenching of the TCPP fluorescence in presence of ZnO, as can be seen in Fig. 4c. This quenching is understood as electronic interaction of the TCPP with the ZnO nanorods and can be exploited in solar energy conversion.3a,4d,9
It is then of interest whether the assembly sizes are tunable by variation of the molar ratio rM(TCPP/ZnO). The sizes increase with increasing rM in a way depicted in Fig. 5. With very small rM (<10) hardly any interconnection takes place and the assemblies are only slightly larger than the ZnO nanorods. For molar ratios rM > 160 the samples precipitate and also for much larger ratios (tested to up to rM = 20![[thin space (1/6-em)]](https://www.rsc.org/images/entities/char_2009.gif) 000) no stable assemblies can be obtained. For molar ratios rM ≤ 160 stable assemblies form in solution which show only minor growth within a time range of few days. The large standard deviation, as can be seen in Fig. 5, might be due to a kinetically controlled assembly formation.
000) no stable assemblies can be obtained. For molar ratios rM ≤ 160 stable assemblies form in solution which show only minor growth within a time range of few days. The large standard deviation, as can be seen in Fig. 5, might be due to a kinetically controlled assembly formation.
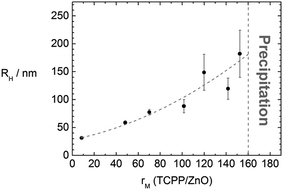 | ||
| Fig. 5 Dependence of the hydrodynamic radius of the ZnO–TCPP assemblies on the molar ratio rM(TCPP/ZnO) with line to guide the eye. | ||
As Zn–TCPP has better electronic properties for DSSCs, the same experiments were carried out with Zn–TCPP in comparison. Zn–TCPP behaves differently from free base TCPP: assemblies with Zn–TCPP are larger than with free base TCPP at the same molar ratios. Furthermore they are not stable, but continue growing until they precipitate, whereby this growth is faster at higher molar ratios. A possible reason for this behavior may lie in the strong stacking of metalized TCPP. Thus, with this additional interaction the stability window for stable assembly formation is narrower than with free base TCPP, leading to larger assemblies and time dependent growth.
Assemblies with TPPS
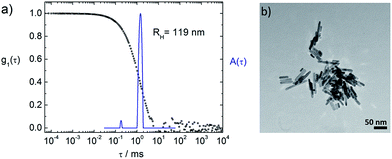
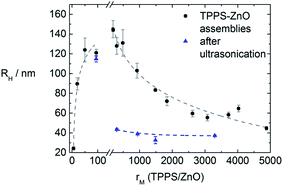
To gain a deeper insight into the general binding and interconnection behavior of porphyrin and ZnO, also the meso-tetra-(4-sulfonatophenyl)porphyrin (TPPS) was used for assembly formation. TPPS has four sulfonate groups instead of carboxyl groups and can also bind to the ZnO surface. With DLS and TEM measurements assembly formation can be followed, as can be seen in Fig. 6.In analogy to the TCPP–ZnO system also here different molar ratios of porphyrin to ZnO were tested. The resulting sizes of the assemblies are depicted in Fig. 7.
At molar ratios rM < 160 the resulting assembly sizes show a similar dependence on the molar ratio as in the TCPP–ZnO system. At small ratios hardly any size change is observable and the assemblies are larger with larger rM. At molar ratios rM > 160, however, no precipitation occurs in contrast to the TCPP–ZnO system, but the assemblies become smaller, are stable for at least one month and a systematic dependence of size on molar ratio is found. To understand this behavior one has to keep in mind the maximum amount of porphyrin that can attach to each ZnO nanorod. This value can be calculated considering the average surface of a ZnO nanorod and the area, each porphyrin molecule requires on a ZnO surface. The latter area was experimentally determined by Cherian et al. to be 1.2 nm2 per molecule.3a In a face-to-face conformation TPPS would occupy about 2.3 nm2. In the system here a total porphyrin coverage is reached at 1000 molecules per ZnO nanorod in case of a porphyrin surface requirement of 1.2 nm2. In case of flat conformation about 500 molecules could fit onto one ZnO nanorod. However, in this study the ZnO nanorods are stabilized by TODA, which is, in terms of surface coverage, in competition with the porphyrin. With centrifugation experiments a maximum surface coverage of rM(TPPS/ZnO) ≈ 200 was determined, which is reasonable considering the presence of TODA.§
Therefore, the assembly size dependence on the molar ratio can be understood in the following way. At ratios rM < 200 all porphyrin molecules are immediately attached to the ZnO surface and interconnect the rods. Small concentration fluctuations can therefore result in different assembly sizes giving quite difficult terms for assembly size prediction.
At larger molar ratios (rM(TPPS/ZnO) > 200) the surface of the ZnO nanorods is saturated with porphyrin. Therefore not every ZnO nanorod within reach is adsorbed to the assembly, but the most stable assembly size is formed. This allows to predict assembly sizes, whereas a window of 45 nm to 145 nm is accessible for tuning of the hydrodynamic radius (for example, Fig. S2† shows an example of small assemblies at a large molar ratio of rM(TPPS/ZnO) = 4000, featuring hydrodynamic radii of RH = 66 nm).
Sonication
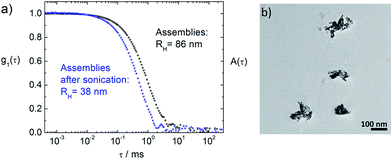
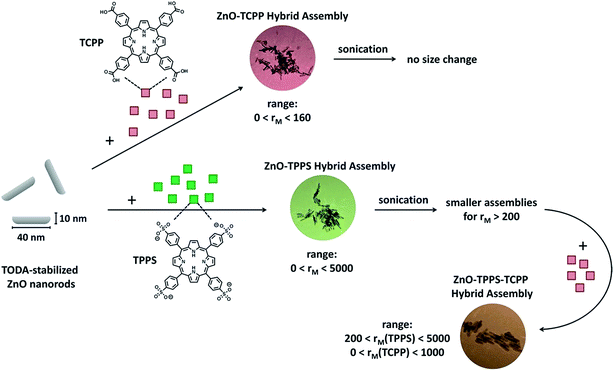
Interestingly, for rM > 200 it is possible to reduce the assembly sizes upon sonication for 15 min to hydrodynamic radii between 30 nm and 45 nm, as can be seen in Fig. 7 (blue triangles) and in Fig. 8. This is not possible for rM < 200, where the sizes stay nearly constant after sonication. This elucidates the interconnecting behavior of the porphyrin, when every molecule is attached to the ZnO surface, but the surface is not yet saturated. Even if the ZnO nanorods are briefly separated by sonication, they immediately become reconnected by the porphyrin. Only once surface saturation with TPPS is reached, the assemblies can become smaller upon sonication, as both surfaces of two freshly separated ZnO nanorods can be stabilized by free TPPS and therefore do not necessarily aggregate again.The sonicated samples for rM > 200 show narrow size distributions (distribution width σ < 0.2) and long term stability. Most importantly, the amount of porphyrin can be chosen freely within a wide concentration range and does not determine the assembly size after the sonication.
Absorption spectroscopy
The spectroscopic investigation yields similar results as in the TCPP system. For molar ratios rM < 200 a red shift of 2 nm of the Soret band (λmax(TPPS) = 415 nm, λmax(assembly) = 417 nm) can be observed in the fresh assembly. This corresponds to upright binding of the TPPS to the ZnO surface.4d,7a,8 For higher molar ratios (rM > 200), not every porphyrin molecule can simultaneously attach to the surface. Therefore no initial shift is observed in the fresh sample. However, with time a shoulder at higher wavelengths evolves in the Soret band and the intensity ratio of the Q bands changes, as can be seen in Fig. 9.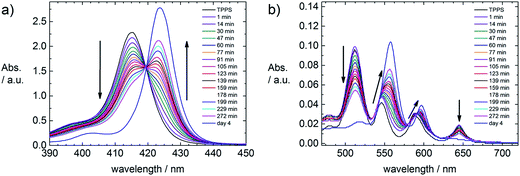 | ||
| Fig. 9 Time dependent UV-Vis spectra of a ZnO–TPPS sample with rM = 1500, c(ZnO) = 2.0 × 10¹⁶ particles per L and c(TPPS) = 5.1 × 10⁻⁵ mol L−1. (a) Soret bands, (b) Q bands. | ||
These time dependent changes can be understood in the way that the TPPS is able to be metalized by the ZnO, forming Zn–TPPS. For rM = 1500 this metalation takes place within several hours (Fig. 9). At such a high molar ratio it is impossible for all TPPS molecules to be attached to the ZnO surface. Centrifugation experiments prove that after a certain time free Zn–TPPS is in solution, which means that it is possible for the TPPS to get metalized at the ZnO surface and subsequently diffuse away again. This gives a hint towards a dynamic attachment and diffusion process of the TPPS at the ZnO surface, facilitated by the sulfonate groups of the porphyrin. The different absorption behavior of TPPS to ZnO in contrast to a porphyrin featuring a COOH group was described elsewhere.2c The time that is necessary to metalize TCPP is another indication of the different behavior of TPPS and TCPP (Fig. S1†). The carboxyl groups of TCPP bind to the ZnO surface more strongly making it geometrically more difficult for TCPP to align cofacially to the surface and thereby become metalized. Thus the metalation of TCPP with zinc ions from the ZnO surface takes much longer (several days, Fig. S1†) than the formation of Zn–TPPS (several hours, Fig. 9). Despite the obvious “feeding” of the porphyrin on the ZnO, in TEM measurements no structural change of the ZnO nanorods is observable. Considering the number of Zn-ions in one ZnO nanorod, this can easily be understood. Even at a molar ratio of rM = 1500 porphyrin molecules per ZnO nanorod, only 1.4% of the Zn-ions could be taken out of the nanorod structure, which is negligible. It is also possible to circumvent this attack of the porphyrin on the ZnO. By adding 100-fold excess of ZnCl2 to the porphyrin solution, metalized Zn–TPPS can be formed. With this Zn–TPPS the same assembly properties were found as with the free base porphyrin. As the metalized porphyrin can only bind with the sulfonate groups, this result also indicates that the upright binding of the porphyrin to the ZnO surface is structure determining.
Emission spectroscopy
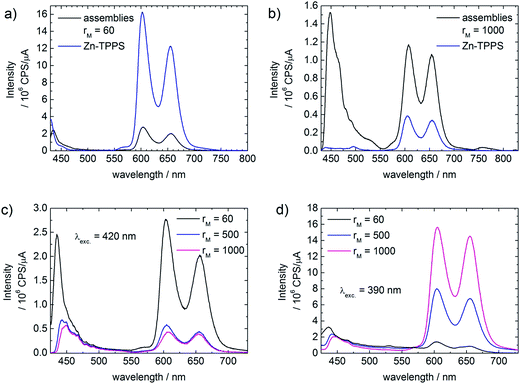
Emission spectroscopy also indicates interaction of ZnO with metalized Zn–TPPS.¶ At low molar ratios (rM < 200), where every porphyrin molecule is attached to the ZnO, a distinct quenching of the porphyrin emission can be observed (Fig. 10a). For high molar ratios (rM ≈ 1000), the emission intensity of the assembly solution is markedly higher than the Zn–TPPS solution of the same concentration, as can be seen in Fig. 10b. At the same time the emission intensities decrease with increasing porphyrin concentration, when the samples are excited with 420 nm (Fig. 10c).At high concentrations porphyrins tend to aggregate in solution, as can be followed with UV-Vis spectroscopy. This behavior is even stronger for metalized porphyrins. The aggregation leads to a quenching of the fluorescence, which decreases with decreasing concentration, as also the stacking tendency becomes smaller with lower concentration. Upon addition of ZnO nanorods at high Zn–TPPS concentrations a part of the porphyrin binds to the ZnO surface, thereby lowering the overall concentration of free Zn–TPPS in solution. At lower concentration the porphyrin stacks are smaller, which diminishes the self-quenching and increases the fluorescence (Fig. 10b).
Interestingly, when exciting the samples with 390 nm, that is, not in the region of highest absorption, the emission intensities increase with increasing porphyrin concentration, as can be seen in Fig. 10d. This is the exact opposite of what was found with 420 nm excitation. These findings can be understood by the inner filter effect: due to the strong absorption of the porphyrin at 420 nm, the intensity of the excitation light is not constant throughout the solution (in case of high porphyrin concentration). In the measuring volume that is significant for the detector, the intensity of the excitation light is markedly weakened, leading to a lower overall intensity of the spectrum. This effect becomes stronger with increasing concentration, causing weaker emission intensity in addition to the self-quenching due to stacking of the porphyrin. At 390 nm excitation light, the absorption of the porphyrin is weak. Therefore the sample is in the measuring volume irradiated with high intensity, leading to a stronger emission compared to 420 nm excitation.
The ZnO–Zn–TPPS assemblies feature an additional strong emission band at around 448 nm, as can be seen best in Fig. 10b. Zn–TPPS of low concentration also shows a similar band at 430 nm (Fig. 10a). For Zn–TPPS alone the ratio between this band and the regular porphyrin emission bands stays constant when changing the excitation wavelength (420 nm, 390 nm). However, the ratios between the first band and the porphyrin emission bands in the assembly samples change with different excitation wavelengths (compare Fig. 10b and c). Furthermore in case of higher porphyrin concentration the first band is markedly stronger in case of assembly samples than in the Zn–TPPS solutions (Fig. 10b). This is an indication that the first emission band in the assembly samples is not caused by the porphyrin, but presumably by fluorescence of the ZnO. ZnO alone does not show emission at this excitation wavelength, therefore energy transfer from the excited porphyrin to the ZnO takes place. The lower intensity of the first band in case of 390 nm excitation can be understood considering the weaker absorption of the porphyrin at this wavelength. With weak excitation the amount of energy that is transferred to the ZnO is small, whereas at 420 nm excitation the absorption of the porphyrin is strong and therefore the amount of transferred energy is high.
The first emission band shows a red shift with increasing porphyrin concentration (435 nm to 448 nm). This red shift might be due to solvatochromism or in this case better described as perichromism.10 With higher porphyrin concentration the ratio between TODA and Zn–TPPS at the ZnO surface shifts towards the porphyrin. Defects in the crystal lattice, which are responsible for the ZnO emission,11 are destabilized due to the different surface environment, lowering the HOMO LUMO gap and thereby causing a red shift of the emission band.
Combination of TPPS and TCPP
Above we have shown the different binding behavior of TPPS and TCPP. With TPPS a very large range of molar ratios is accessible, where the assembly size deceases for increasing rM when rM < 200. Additionally, aggregates can be transferred to smaller well defined assemblies with hydrodynamic radii in a range of 30 < RH < 40 nm via sonication. With TCPP only a small range of molar ratios is accessible, as for rM > 160 the samples precipitate immediately. This is probably due to the strong binding of the carboxyl group to the ZnO surface. Combining these two porphyrins could therefore lead to a better stability and thus to a larger molar ratio range accessible for TCPP/ZnO. To verify this hypothesis at first ZnO–TPPS assemblies are formed with rM = 1000. Then these assemblies are treated with an ultrasonic bath for 15 min, to gain small well defined assemblies of RH ≈ 30–40 nm, which are stabilized by excess TPPS (see Fig. 7 and 9, blue curves). After that, TCPP is added to the solution. For rM(TCPP/ZnO) < 160 the same assembly sizes are found as in the pure ZnO–TCPP system. For larger molar ratios, in difference, no immediate precipitation occurs in contrast to the pure ZnO–TCPP system (Fig. 11a). This holds true up to rM(TCPP/ZnO) < 1000, for larger ratios the samples precipitate within minutes, which is still slower than without TPPS. These results show that the TPPS is able to stabilize the system, enabling a higher loading of TCPP than without the presence of TPPS. In the range 160 < rM(TCPP/ZnO) < 1000 the samples show a slow growth with time and the distribution widths are broad (σ > 0.35). By sonication the hydrodynamic radii can be reduced and the assemblies are much better defined (σ < 0.35).In the TEM pictures in Fig. 11b and c an organic layer is visible around the ZnO nanorods, which stems from the high overall porphyrin load, that is accessible with the porphyrin mixture approach.
As TCPP in combination with ZnO is known to be a good dye sensitizer for DSSC, the investigation of this system and especially the increase of the stability window of TCPP with ZnO by adding another porphyrin that also interacts electronically with ZnO could be of high relevance in the field of solar energy conversion. In this context it should again be pointed out that all experiments are also possible with the metalized Zn–TPPS. Combining two porphyrins and especially a free base and a metalized porphyrin enhances the absorption coverage of the solar spectrum. Due to the different HOMO–LUMO levels of metalized and free base porphyrin the excited state of the Zn-porphyrin can pass to the free base porphyrin. Furthermore charge recombination can be diminished, as the energetic cascade helps to separate electrons and holes.12
Conclusion
In summary, we have presented the assembly formation of ZnO nanorods with the two porphyrins TCPP and TPPS and their mixture, as shown in Scheme 1. With TCPP, stable hybrid assemblies form for porphyrin/zinc oxide ratios rM < 160. With TPPS, assembly formation is possible over a wide range of molar ratios (0 ≤ rM ≤ 5000), where the assembly size is adjustable via rM. UV-Vis absorption and emission spectroscopy confirm interaction of both porphyrins with the ZnO nanorods. With time, the free base porphyrins become metalated and form Zn-porphyrins. For TCPP this process is slow and takes several days, while it is much faster with TPPS taking only several hours, which indicates a more dynamic binding of TPPS to ZnO. In the TPPS–ZnO system it is possible to decrease the assembly sizes to 30 < RH < 45 nm via sonication forming long-term stable hybrid assemblies with narrow size distributions. More complex nanostructures are assembled using a combination of both TCPP and TPPS, resulting in an increased stability range of rM(TCPP/ZnO) ≤ 1000. Again, upon sonication the sizes of the assemblies can be reduced and the size distributions narrowed (for 150 < rM(TCPP/ZnO) < 1000). Thus, a large ratio range of porphyrin to ZnO is accessible by combining the two different porphyrins TCPP and TPPS, with both interacting with the ZnO nanorods. Especially the metalated Zn–TPPS in combination with the free base TCPP could be of high relevance for solar energy conversion, due to enhanced absorption coverage of the solar spectrum and beneficial electronic levels allowing for efficient charge separation. Hence, the comprehension of these porphyrin–ZnO composite assemblies gained herein may contribute significantly to the application of such self-assembled more-component systems in various applications.Acknowledgements
Financial support of Deutsche Forschungsgemeinschaft (DFG), the Interdisciplinary Center for Molecular Materials (ICMM, University Erlangen-Nürnberg) and Solar Technologies go Hybrid (SolTech) is gratefully acknowledged.References
- (a) J. Opel, M. Hecht, K. Rurack, J. Eiblmeier, W. Kunz, H. Cölfen and M. Kellermeier, Nanoscale, 2015, 7, 17434 RSC; (b) Y. Peng, A.-W. Xu, B. Deng, M. Antonietti and H. Cölfen, J. Phys. Chem. B, 2006, 110, 2988 CrossRef CAS PubMed; (c) D. Hentrich, M. Junginger, M. Bruns, H. G. Börner, J. Brandt, G. Brezesinski and A. Taubert, CrystEngComm, 2015, 17, 6901 RSC; (d) K. Gorna, R. Muñoz-Espí, F. Gröhn and G. Wegner, Macromol. Biosci., 2007, 7, 163 CrossRef CAS PubMed; (e) R. Muñoz-Espí, A. Chandra and G. Wegner, Cryst. Growth Des., 2007, 7, 1584 CrossRef; (f) M. Antonietti, M. Niederberger and B. Smarsly, Dalton Trans., 2008, 18 RSC; (g) R. J. Macfarlane, B. Lee, M. R. Jones, N. Harris, G. C. Schatz and C. A. Mirkin, Science, 2011, 334, 204 CrossRef CAS PubMed; (h) X. Liang, L. Yongjun and L. Yuliang, Progress in Chemistry, 2014, 26, 487 Search PubMed; (i) X. Li, L. Yang, C. Qin, F.-H. Liu, L. Zhao, K.-Z. Shao and Z.-M. Su, RSC Adv., 2015, 5, 59093 RSC; (j) K. W. Tan, B. Jung, J. G. Werner, E. R. Rhoades, M. O. Thompson and U. Wiesner, Science, 2015, 349, 54 CrossRef CAS PubMed; (k) M. Jiang, J. A. Kurvits, Y. Lu, A. V. Nurmikko and R. Zia, Nano Lett., 2015, 15, 5010 CrossRef CAS PubMed; (l) Y. Min, M. Akbulut, K. Kristiansen, Y. Golan and J. Israelachvili, Nat. Mater., 2008, 7, 527 CrossRef CAS PubMed; (m) K. Zhang, M. Jiang and D. Chen, Prog. Polym. Sci., 2012, 37, 445 CrossRef CAS; (n) S. Chen, S.-X. Cheng and R.-X. Zhuo, Macromol. Biosci., 2011, 11, 576 CrossRef CAS PubMed.
- (a) D. Shao, H. Sun, J. Gao, G. Xin, M. A. Aguilar, T. Yao, N. Koratkar, J. Lian and S. Sawyer, Nanoscale, 2014, 6, 13630 RSC; (b) Y.-G. Lin, Y.-K. Hsu, Y.-C. Chen, L.-C. Chen, S.-Y. Chen and K.-H. Chen, Nanoscale, 2012, 4, 6515 RSC; (c) Y. Sivalingam, G. Magna, E. Martinelli, G. Pomarico, A. Catini, A. D'Amico, R. Paolesse and C. Di Natale, The 14th International Meeting on Chemical Sensors, 2012, DOI:10.5162/IMCS2012/4.1.1; (d) H. Saarenpää, E. Sariola-Leikas, A. Pyymaki Perros, J. M. Kontio, A. Efimov, H. Hayashi, H. Lipsanen, H. Imahori, H. Lemmetyinen and N. V. Tkachenko, J. Phys. Chem. C, 2012, 116, 2336 CrossRef; (e) Y. Chen, M. Yue, Z.-H. Huang, L.-N. Wang and F. Kang, RSC Adv., 2015, 5, 23174 RSC; (f) H. Hakola, A. Pyymaki Perros, P. Myllyperkiö, K. Kurotobi, H. Lipsanen, H. Imahori, H. Lemmetyinen and N. V. Tkachenko, Chem. Phys. Lett., 2014, 592, 47 CrossRef CAS; (g) P. Kar, S. Sardar, E. Alarousu, J. Sun, Z. S. Seddigi, S. A. Ahmed, E. Y. Danish, O. F. Mohammed and S. Kumar Pal, Chem.–Eur. J., 2014, 20, 10475 CrossRef CAS PubMed; (h) W. Sun, J. Li, G. Mele, Z. Zhang and F. Zhang, J. Mol. Catal. A: Chem., 2013, 366, 84 CrossRef CAS; (i) F. Werner, J.-F. Gnichwitz, R. Marczak, E. Palomares, W. Peukert, A. Hirsch and D. M. Guldi, J. Phys. Chem. B, 2010, 114, 14671 CrossRef CAS PubMed; (j) G. Magnaa, Y. Sivalingam, E. Martinelli, G. Pomarico, F. Basoli, R. Paolesse and C. Di Natale, Anal. Chim. Acta, 2014, 810, 86 CrossRef PubMed; (k) A. Di Mauro, E. Smecca, A. D'Urso, G. G. Condorelli and M. E. Fragalà, Mater. Chem. Phys., 2014, 143, 977 CrossRef CAS; (l) S. Senthilkumar, R. Hariharan, A. Suganthi, M. Ashokkumar, M. Rajarajan and K. Pitchumani, Powder Technol., 2013, 237, 497 CrossRef CAS.
- (a) S. Cherian and C. C. Wamser, J. Phys. Chem. B, 2000, 104, 3624 CrossRef CAS; (b) S. K. Das, N. K. Subbaiyan, F. D'Souza, A. S. D. Sandanayaka, T. Hasobe and O. Ito, Energy Environ. Sci., 2011, 4, 707 RSC.
- (a) C. Pacholski, A. Kornowski and H. Weller, Angew. Chem., Int. Ed., 2002, 41, 1188 CrossRef CAS; (b) M. Voigt, M. Klaumünzer, H. Thiem and W. Peukert, J. Phys. Chem. C, 2010, 114, 6243 CrossRef CAS; (c) B. Sun and H. Sirringhaus, Nano Lett., 2005, 12, 2408 CrossRef PubMed; (d) A. J. Said, G. Poize, C. Martini, D. Ferry, W. Marine, S. Giorgio, F. Fages, J. Hocq, J. Bouclé, J. Nelson, J. R. Durrant and J. Ackermann, J. Phys. Chem. C, 2010, 114, 11273 CrossRef CAS.
- S. Schäfer, R. Srikantharajah, M. Klaumünzer, V. Lobaz, M. Voigt and W. Peukert, Thin Solid Films, 2014, 562, 659 CrossRef.
- S. Provencher, Comput. Phys. Commun., 1982, 27, 229 CrossRef.
- (a) W. Tu, J. Lei, P. Wang and H. Ju, Chem.–Eur. J., 2011, 17, 9440 CrossRef CAS PubMed; (b) W. W. Tu, Y. T. Dong, J. P. Lei and H. X. Ju, Anal. Chem., 2010, 82, 8711 CrossRef CAS PubMed; (c) J. Rochford and E. Galoppini, Langmuir, 2008, 24, 5366 CrossRef CAS PubMed; (d) J. Rochford, D. Chu, A. Hagfeldt and E. Galoppini, J. Am. Chem. Soc., 2007, 129, 4655 CrossRef CAS PubMed; (e) A. Kathiravan, P. S. Kumar, R. Renganathan and S. Anandan, Colloids Surf., A, 2009, 333, 175 CrossRef CAS; (f) M. Niskanen, M. Kuisma, O. Cramariuc, V. Golovanov, T. I. Hukka, N. Tkachenko and T. T. Rantala, Phys. Chem. Chem. Phys., 2013, 15, 17408 RSC.
- I. Hiromitsu, A. Kawami, S. Tanaka, S. Morito, R. Sasai, T. Ikeue, Y. Fujita and M. Handa, Chem. Phys. Lett., 2011, 501, 385 CrossRef CAS.
- A. S. Huss, A. Bierbaum, R. Chitta, D. J. Ceckanowicz, K. R. Mann, W. L. Gladfelter and D. A. Blank, J. Am. Chem. Soc., 2010, 132, 13963 CrossRef CAS PubMed.
- C. Reichardt and T. Welton, Solvents and Solvent Effects in Organic Chemistry, Wiley-VCH, Weinheim, 2011, pp. 371–393 Search PubMed.
- A. B. Djurisic and Y. H. Leung, Small, 2006, 2, 944 CrossRef CAS PubMed.
- D. M. Guldi, I. Zilbermann, G. Anderson, A. Li, D. Balbinot, N. Jux, M. Hatzimarinaki, A. Hirsch and M. Prato, Chem. Commun., 2004, 726 RSC.
Footnotes |
| † Electronic supplementary information (ESI) available. See DOI: 10.1039/c6ra26964h |
| ‡ The binding of TCPP to the ZnO surface could be determined by centrifugation experiments, where no TCPP could be detected in the supernatant, but all porphyrin was found in the sediment together with the ZnO. |
| § Only for rM > 200 TPPS is detectable in the supernatant. |
| ¶ For emission experiments metalized Zn–TPPS was chosen to simplify and better understand the emission spectra. Otherwise even in fresh assembly samples with TPPS a mixture of TPPS and metalized Zn–TPPS is visible in the spectra. |
| This journal is © The Royal Society of Chemistry 2017 |

