
 Open Access Article
 This Open Access Article is licensed under a
 Creative Commons Attribution 3.0 Unported Licence
Molecular insight into the microstructure and microscopic dynamics of pyridinium ionic liquids with different alkyl chains based on temperature response†
Guanglai Zhu *a,
Xianqu Kanga,
Siwen Zhoua,
Xiaoshuan Tanga,
Maolin Shab,
Zhifeng Cuia and
Xinsheng Xua
*a,
Xianqu Kanga,
Siwen Zhoua,
Xiaoshuan Tanga,
Maolin Shab,
Zhifeng Cuia and
Xinsheng Xua
aInstitute of Atomic and Molecular Physics, Anhui Normal University, Wuhu 241000, China. E-mail: zhglai@mail.ahnu.edu.cn
bDepartment of Chemistry and Chemical Engineering, Hefei Normal University, Hefei 230061, China
First published on 17th January 2017
Abstract
The temperature dependence of the microstructure and microscopic dynamics of three N-alkylpyridinium tetrafluoroborate ionic liquids, namely, [BPy][BF4], [HPy][BF4], and [OPy][BF4], is investigated via molecular dynamics simulation. Under a temperature change, the microstructure changes of [OPy][BF4] with a longer alkyl chain show a slight difference from that of [BPy][BF4] and [HPy][BF4] in terms of the radial and spatial distribution functions. A temperature increase is found to be advantageous to the aggregation of the polar regions as well as the nonpolar regions in the pyridinium ionic liquids. However, the properties of the microscopic dynamics of the three ionic liquids regularly change under conditions with temperature change. The results show a decreased probability of ions to reverse the direction of their translation motion because the negative parts of the velocity autocorrelation functions increase with the temperature. The temperature dependence of rotational dynamics is more obvious than that of translation. A rise in temperature causes rotational autocorrelation functions to decay quickly, and it considerably reduces relaxation time. With an increase in alkyl chain length, the rotational correlation improves and the relaxation time decreases. The time correlation functions show that the association dynamics of nonpolar regions is faster than that of polar regions over time. The association time is short for long-tailed ionic liquids.
1. Introduction
Ionic liquids (ILs) are compounds composed of cations and anions, which are liquid at room temperature.1,2 ILs are characterized by low vapor pressure, low volatility, low melting point, wide liquid range, wide electrochemical window, and so on. As a new type of green solvent, ILs are receiving increasing research attention.3–5 According to the articles published in recent years, the research on ILs mainly focuses on organic reactions, materials chemistry, polymer chemistry, analytical chemistry, and the chemical industry.6,7 ILs are also applied to other fields, such as energy, environment, bioscience, photoelectric information, and aerospace materials.8,9 Owing to the many applications of ILs in different fields, their chemical and physical properties merit further attention.10,11 Different structures are known to have different properties.12 The study on the relationship between the microstructure and macroscopic properties of ILs has achieved significant progress; however, some of the data and results are conflicting.13,14 Thus, we still lack in-depth knowledge of the microscopic structure of ILs and the interaction mechanism of cations and anions.15,16 Consequently, the research into the microscopic structure and properties of ILs, especially the effects of their dynamics properties on solute–solvent interaction, is a challenging undertaking.12,17With the deepening of the research into ILs, we should establish the structure and properties of ILs at the molecular level. The microstructure and thermodynamic properties of ILs can be analyzed and predicted via molecular dynamics (MD) simulation.12,18–22 A large body of research has explored the microstructure of imidazolium ILs.21,22 For pyridinium ILs, studies have been dominantly conducted on the experimental aspect.23–25 For example, thermodynamic properties including densities and viscosities,25 have been measured at certain temperatures. However, a limited amount of research has studied the structures and properties of pyridinium ILs via MD simulation in different temperatures.26 In the present work, MD simulation was carried out to study the pure systems of N-butylpyridinium tetrafluoroborate ([BPy][BF4]), N-hexylpyridinium tetrafluoroborate ([HPy][BF4]), and N-octylpyridinium tetrafluoroborate ([OPy][BF4]). The effects of temperature on the local microstructure and dynamics of the three ILs were compared by analyzing their radial distribution functions, spatial distribution functions, and correlation functions. The relationship between the microstructure and the properties was also explored.
2. Simulation methodology
2.1 Force field parameters
The modified OPLS-AA force field developed by Lopes and Pádua was used for the cations of the ILs,27 as shown in eqn (1).
 | (1) |
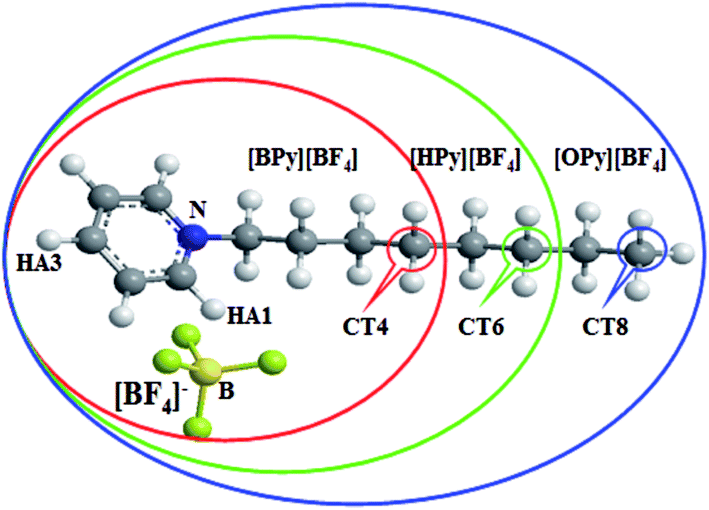 | ||
| Fig. 1 Molecular structure of ILs in this work: [BPy][BF4] (red ellipse), [HPy][BF4] (green ellipse), and [OPy][BF4] (blue ellipse). | ||
2.2 Simulation details
MD simulations were run using the GROMACS 4.5.6 program.29,30 Starting configurations containing 256 ILs were subjected to energy minimization, followed by a 10 ns equilibration in the isothermal–isobaric ensemble. On the basis of the results, each system was equilibrated for 3 ns at a setting temperature that was changed from 293 K to 373 K at an interval of 10 K. The last 2 ns trajectories were taken to calculate the density. During this period, the temperature was maintained via a V-rescale thermostat31 while the pressure was held at 1 bar with a Berendsen barostat.32 A configuration of the system at the average density was taken, and simulations were then run for 4 ns in the canonical ensemble. Without pressure coupling, the V-rescale method was used to maintain the temperature of the system. The particle mesh Ewald method was applied to the long electrostatic interactions, and the bond length was constrained with the LINCS algorithm.33,34 The integration time step was 2 fs. The cutoff radius for VDW and the Coulomb interaction were set to 1.5 nm. The standard periodic boundary condition was used in all simulations. The structure analysis was performed using the last 1 ns trajectory. The rotation and association dynamics were sampled over 2 ns of production runs.3. Results and discussion
3.1 Evaluation of force fields
To verify the accuracy of the force field parameters,35 we obtained the densities of [BPy][BF4], [HPy][BF4], and [OPy][BF4] under different temperatures. In Fig. 2, the hollow part represents the simulated values in the present work, and the solid part represents the experimental values from the literature.23–25 The densities of the system decrease with increase in temperature and present an almost linear relationship. With the increase of the cationic alkyl chain length, the density values decrease because the distance between particles and the macroscopic volume change. Moreover, the gap of the simulation and experiment values is narrowed with the increase of the chain length. The simulation results are in good agreement with the experimental data, with the percentage error being smaller than 2.0%. The chosen force fields of the ILs are thus accurate enough to use. In addition, the ILs as green solvents can be designed with suitable densities that are compatible with those in other experiments by changing their structure appropriately.36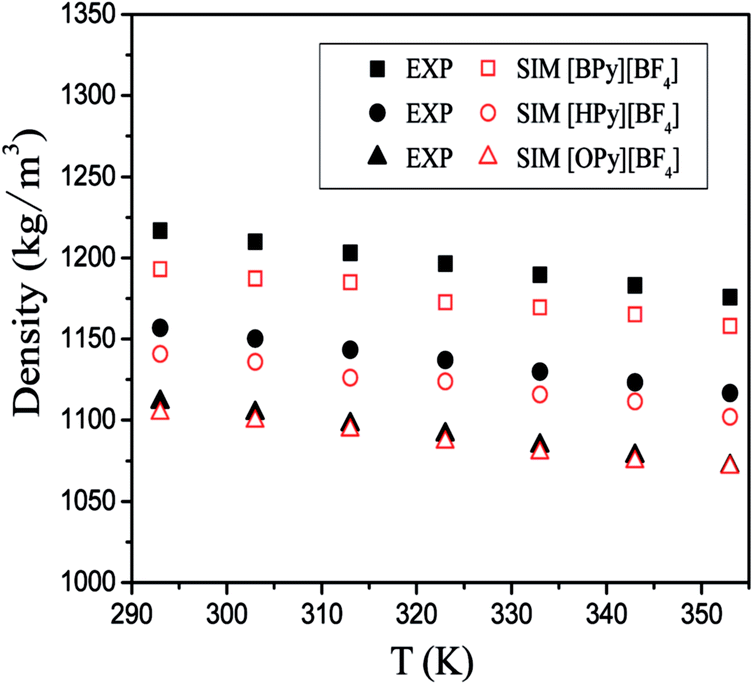 | ||
| Fig. 2 Densities of three pyridinium ILs as the functions of temperature; the experimental values (solid) are taken from ref. 23–25. | ||
3.2 Microstructure
As described in the work of Voth37 and our previous study,38 the N-alkylpyridinium tetrafluoroborate ILs can be divided into two regions: the “head” or the polar region, which is composed of a pyridine ring of cation and anion [BF4]−, and the “tail” part or the nonpolar region, which is composed of the alkyl chain of cations. If this description of the heterogeneous structure of N-alkylpyridinium ILs is correct, the different interactions might cause variations in the effects of the temperature dependence of the polar and nonpolar regions.As shown in Fig. 3, the RDFs between the terminal carbon atoms of the alkyl chain were calculated at different temperatures. With the increase of the temperature, the RDFs show that the peaks of CT4–CT4 of [BPy][BF4] and CT6–CT6 of [HPy][BF4] are reduced. This result indicates that the aggregation degree of the ending carbon atoms decreases with the weakening of their interactions. The peak of [HPy][BF4] is higher than the peak of [BPy][BF4]. The peaks of CT8–CT8 from [OPy][BF4] rise progressively with the increase in the temperature, and the peaks are relatively wide. This indicates that the CT8–CT8 aggregation degree is enhanced. Moreover, all the positions of the peaks show almost no changes at r = 0.42 nm. According to the above results, the change in the nonpolar region of [OPy][BF4] is obviously different from those of [BPy][BF4] and [HPy][BF4] with the increase in temperature.
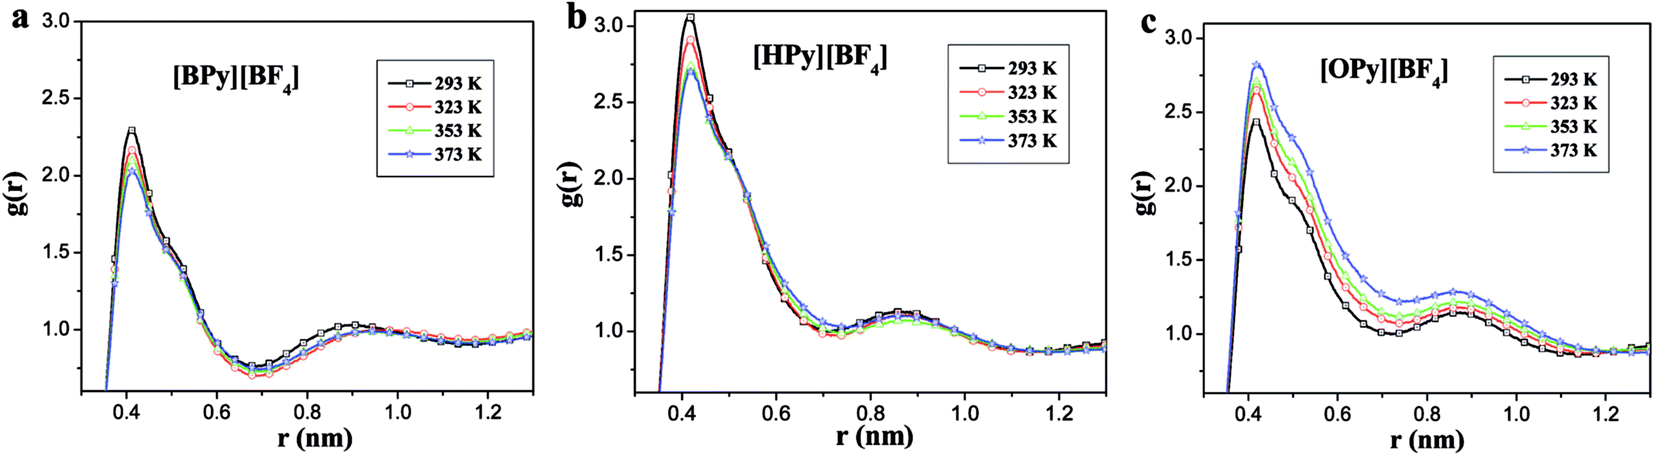 | ||
| Fig. 3 Site–site RDFs for the terminal carbon atom (CT4, CT6 and CT8) of the alkyl chains for [BPy][BF4], [HPy][BF4] and [OPy][BF4] respectively. | ||
Fig. 4 shows the site–site RDFs of the F atoms of BF4 around the HA1 atoms of the cation. The position of the first peak is at the maximum at r = 0.25 nm, which is the characteristic hydrogen bond distance of the C–H⋯F pairs.41 This result indicates a strong interaction between HA1 and F at this position. The position of the second peak is at 0.44 nm. With the increase in the temperature, the first peaks of the RDFs decrease. The changes of the second peaks are not obvious. With the increase of the alkyl chain length, the peaks increase in magnitude. According to Fig. 4, all the changes in the interaction between HA1 and F are similar when the temperature rises; the same is not true for CTn. With the increase in the temperature, the intensity of the first peaks decreases, possibly because of the temperature dependence of the hydrogen bond.42
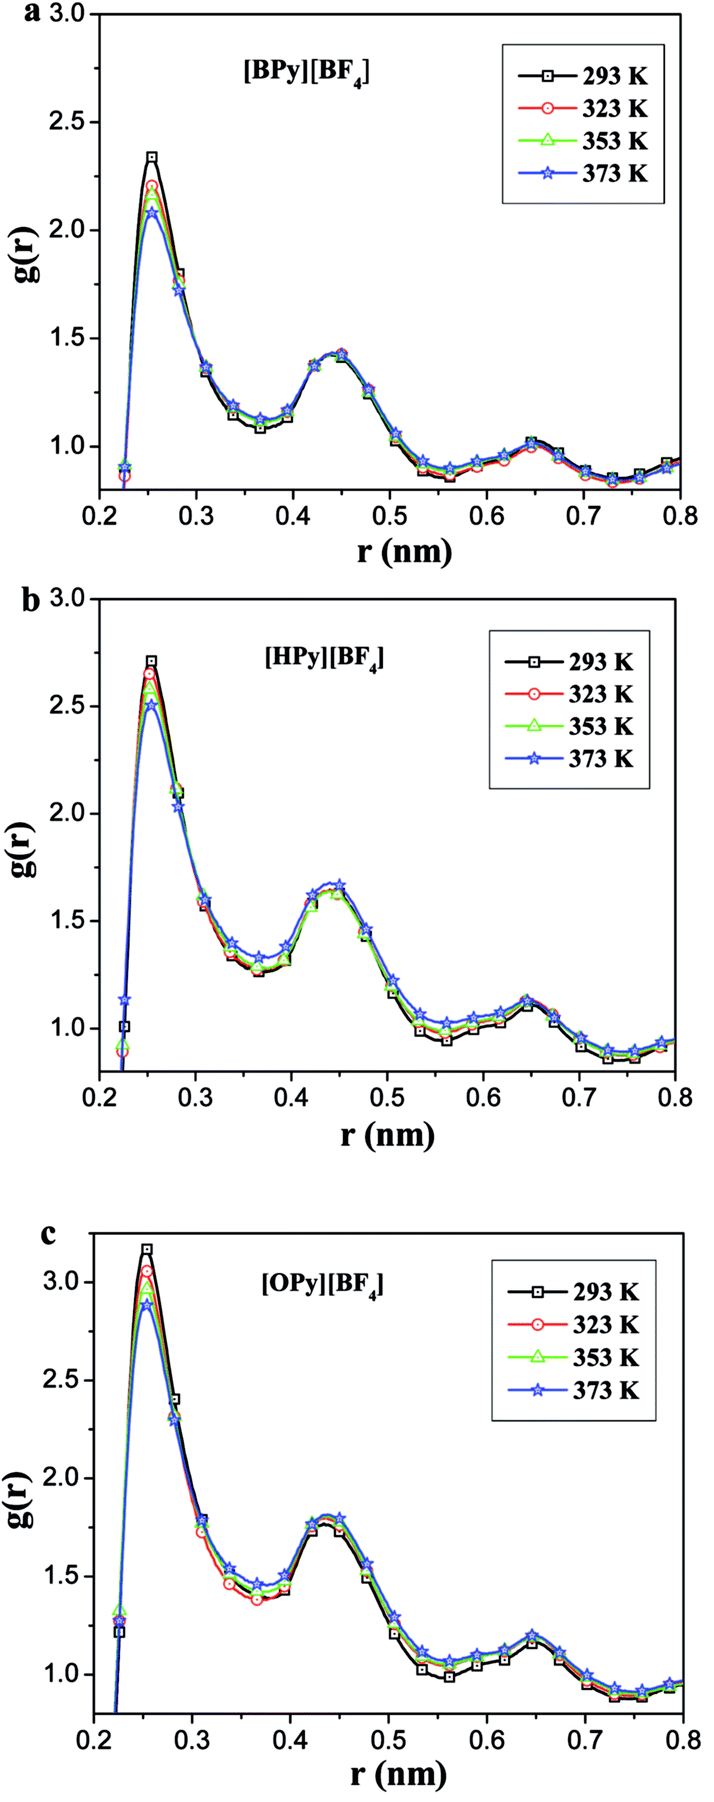 | ||
| Fig. 4 Site–site RDFs of the F atoms of BF4 around the HA1 atoms of the cation. | ||
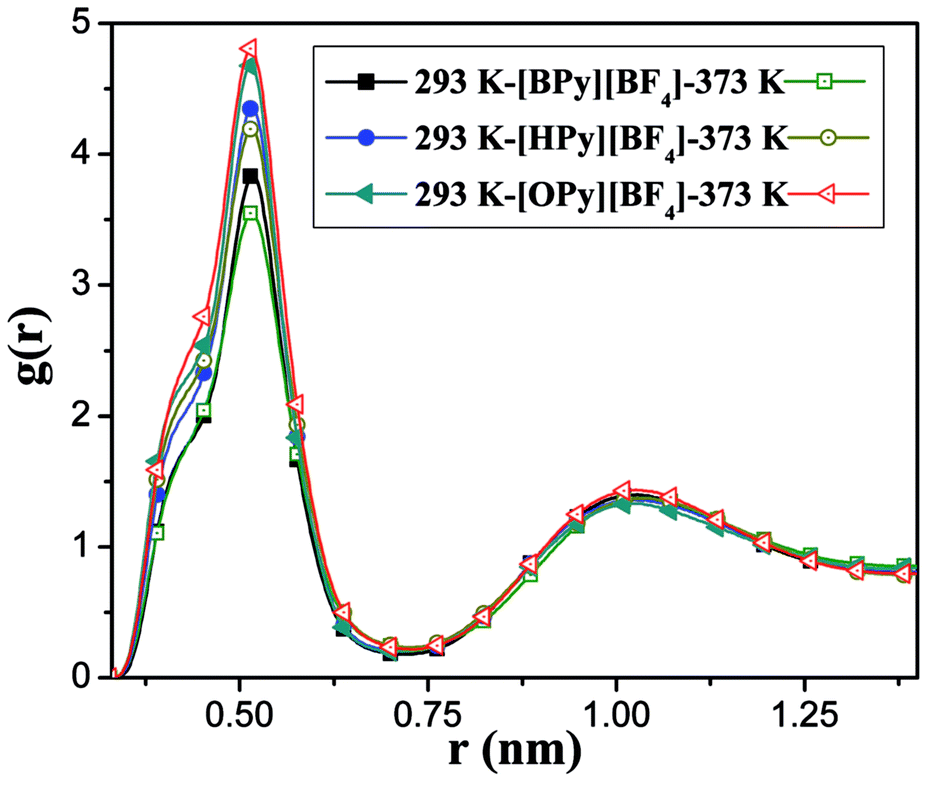
To comprehensively study the temperature dependence of the microstructure of the polar region, we analyze the RDFs of the center-of-mass (COM) between the pyridine ring of the cation and the anion.43 As shown in Fig. 5, the COM RDFs are observed at 293 K and 373 K. More COM RDFs are presented in Fig. S2 of the ESI.† The position of the highest peak is at 0.52 nm, which is the first shell. This position indicates that the maximum probability of the anion around the head is at approximately 0.52 nm. The second peak at 1.05 nm, which is the second shell, is relatively weak. With the increase in the temperature, the peaks of [BPy][BF4] and [HPy][BF4] are reduced, and the second peaks basically remain unchanged. This result suggests that the rise of the temperature weakens the interaction between the cations and the anions of these two ILs. By contrast, the maximum peak of [OPy][BF4] increases, and the second peak slightly increases. The structural change of [OPy][BF4] obviously shows a slight difference from those of [BPy][BF4] and [HPy][BF4] with the change in the temperature. This difference is explained in the next section detailing the coordination number (CN).
 | ||
| Fig. 5 Center-of-mass RDFs for anions around the pyridine ring of cations. | ||
Fig. 5 shows that with the increase of the alkyl chain length, the height of the first peak of the RDFs increases, and the width widens. This condition illustrates that the interaction between the cation and the anion strengthened because of the increase in the alkyl chain length. However, all the positions of the peaks show almost no changes, where the atomic number density being significantly larger than the average.
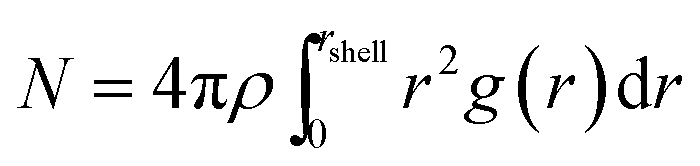 | (2) |
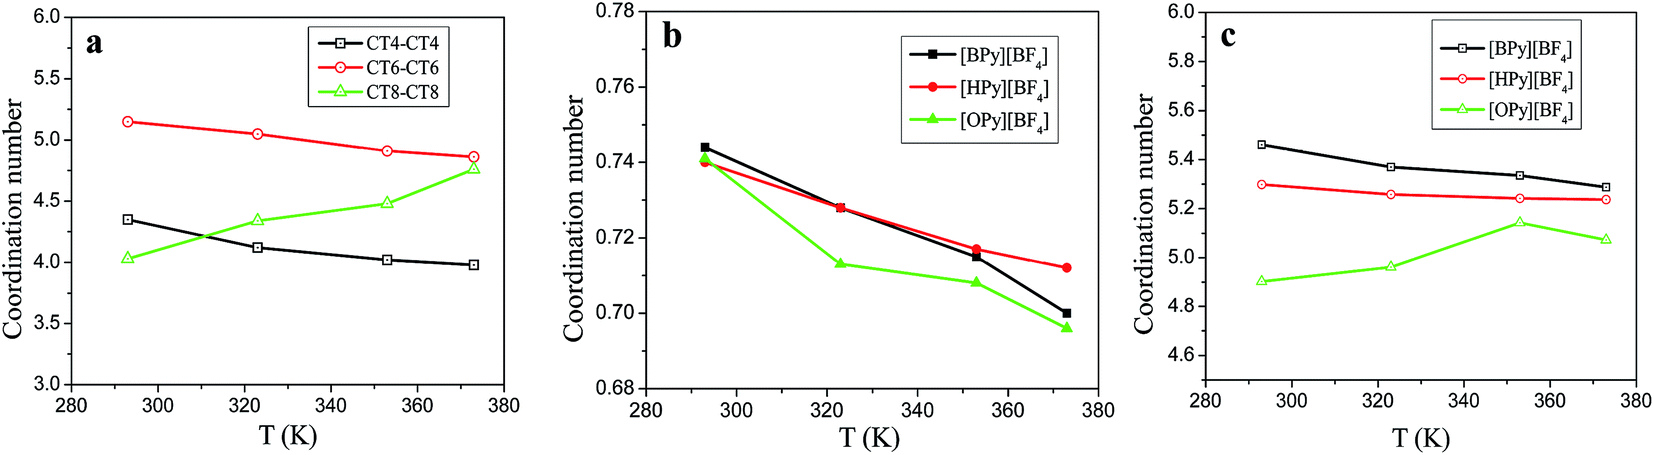
Fig. 6(a) shows the CNs of the terminal carbon atom CTn of the tail for the three ILs. With the increase in the temperature, the CNs of CT4–CT4 and CT6–CT6 decrease, and the CNs of [HPy][BF4] become larger than those of [BPy][BF4] at the same temperature. However, the CNs of CT8–CT8 increase obviously. As shown in Fig. 6(b), with the increase in the temperature, the CNs of the F atoms around the HA1 atom decrease, and the curve of [BPy][BF4] falls rapidly. According to Fig. 6(a) and (b), with the change in the temperature, the CNs for HA1–F and CT8–CT8 of [OPy][BF4] obviously differ from those of [BPy][BF4] and [HPy][BF4]. This result indicates that the longer tails of [OPy][BF4] may induce changes in the local structure because the three ILs show a similar composition, except for the different alkyl chains.
 | ||
| Fig. 6 Coordination numbers of tails CTn–CTn (a), HA1–F (b), and pyridine ring–anion (c) for the three ILs under different temperatures. | ||
To further realize this change induced by the temperature, we calculate the CNs for the pyridine ring–anion (heads) on the basis of the RDFs of COM of the pyridine ring–anion. As shown in Fig. 6(c), the coordination ability of the head of [BPy][BF4] is the strongest in all temperature ranges. With the increase in the temperature, the CNs of the heads of [BPy][BF4] and [HPy][BF4] decrease, whereas the CNs of [OPy][BF4] increase. That is, the CNs of both heads and tails of [OPy][BF4] increase with the rise in the temperature, while the volume expands and the density decreases.
Generally, as the alkyl chain lengths increase, the number density should decrease correspondingly to reduce coordination ability gradually. The abnormality of [OPy][BF4] is explained as follows. [OPy][BF4] has a relatively long alkyl chain, which favors the formation of large clusters.46 For [OPy][BF4], the rise in temperature causes the aggregation degree of the polar and nonpolar regions to increase, which in turn results in the increase of the RDFs and CNs. Meanwhile, the gaps between the large clusters increase with the rise in the temperature. Therefore, the volume of the system still expands, and the density decreases.
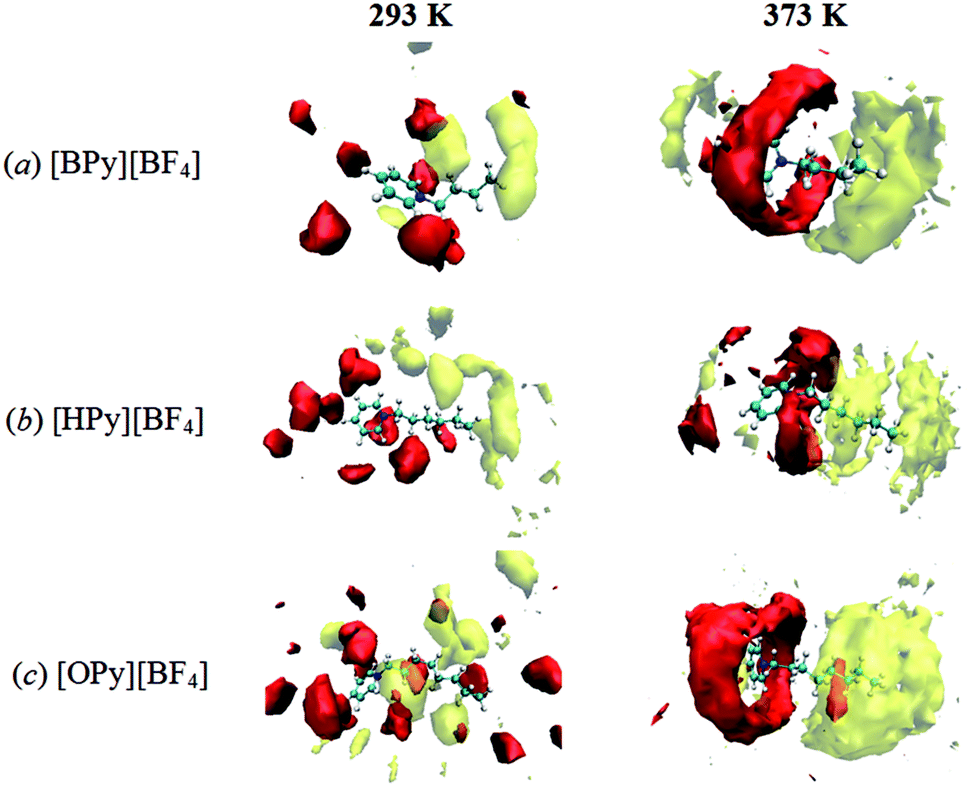 | ||
| Fig. 7 Spatial distributions of anions around cations in red color and those of CTn around cations in yellow color at 293 K (left, the isovalues are 35 for red and 45 for yellow) and 373 K (right, the isovalues are 20 for red and 25 for yellow). | ||
The RDFs and SDFs show that the anions are mainly distributed around the cationic pyridine ring. This distribution is due to the strong electrostatic interactions and hydrogen bond between HA1 on the rings and F on [BF4]−. CTn (n = 4, 6, 8) is mainly distributed around the tail of the alkyl chain for the VDW interaction. Under the same low temperature, the anions are distributed widely with the increase of the alkyl chain length. Under the same high temperature, the aggregation of the polar and nonpolar regions could be observed clearly with the increase of the chain length.
Furthermore, the probabilities of the anions around the pyridine ring increase with the rise in the temperature, as observed by comparing the SDFs at 293 K and 373 K in Fig. 7. A similar phenomenon could be observed for the CTn around the tail. This temperature effects are not only observed for the long chain [OPy][BF4] but also for the other ILs. More SDFs of the anions around the pyridine ring are shown in Fig. S3 of ESI.† These changes cannot be observed from the site–site RDFs; thus, SDFs can present the overall structural changes of ILs. In addition, the rise in the temperature causes the cations and anions to translate and rotate rapidly, which in turn reduces viscosity.24,49 Specifically, a high temperature within the ranges of this study is advantageous to the aggregation of polar regions as well as nonpolar regions, as indicated by the following microscopic dynamics results. This unusual characteristic has not been observed in conventional solvents, which could help us understand the particular solute–solvent behavior in ILs.50 The aggregation behavior with increasing temperature maybe results in different local solvation structure in polar and nonpolar regions owing to different solute–solvent interactions. In ILs, the appropriate temperature will be important to the diffusion, dissolution and reaction of solute.
3.3 Microscopic dynamics
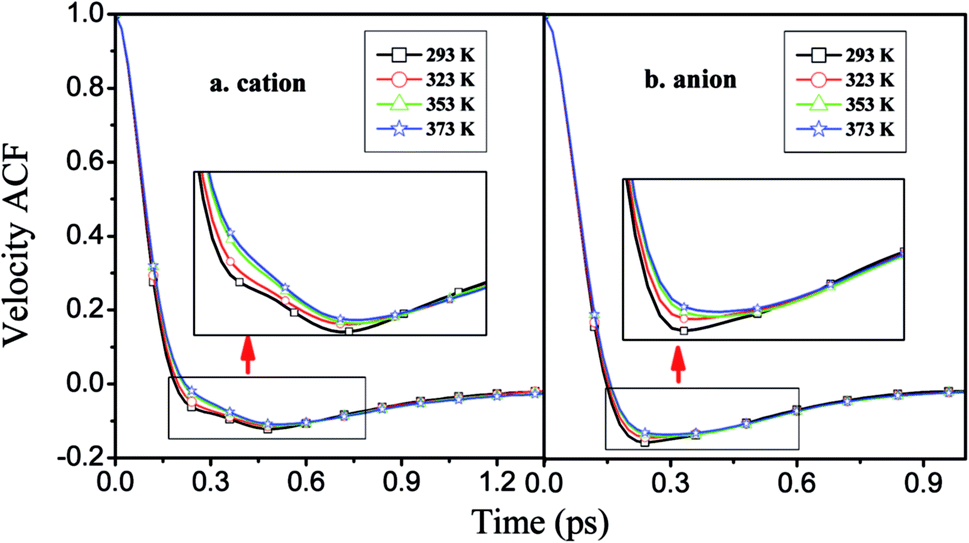 | ||
| Fig. 8 Velocity autocorrelation functions of the cations and anions of [HPy][BF4] under different temperatures. | ||
As shown in Fig. 9, the attenuation of the VACFs for [BPy]+ is the fastest at each temperature. As the alkyl chain length increases, the negative part increases. This result indicates that reversing the direction of the motion in ILs with long alkyl chains is increasingly difficult because of the high viscosities.24 The anionic VACFs of the ILs change slightly at the same temperature because of their small scale (Fig. S5 in ESI†). The temperature shows certain effects on the translational motion. In the next section, we explore rotational movement.
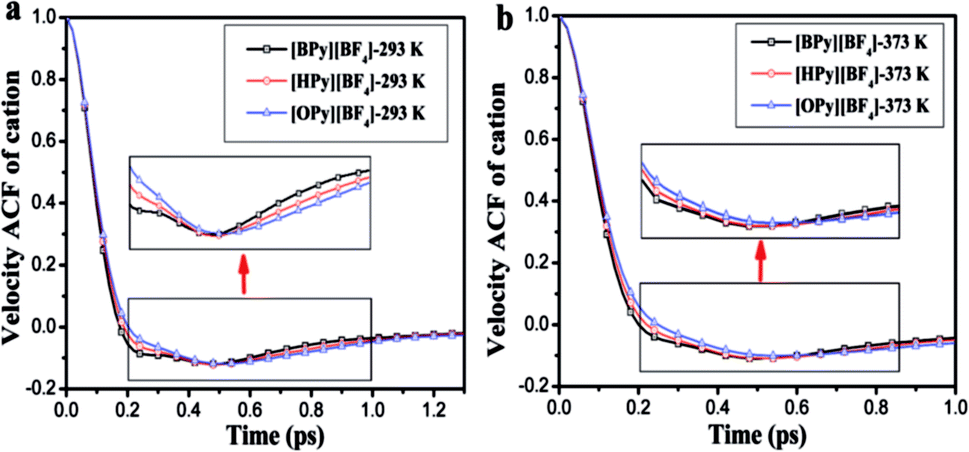 | ||
| Fig. 9 Comparison of the velocity autocorrelation functions of cations with different alkyl chain lengths at 293 K (a) and 373 K (b). | ||
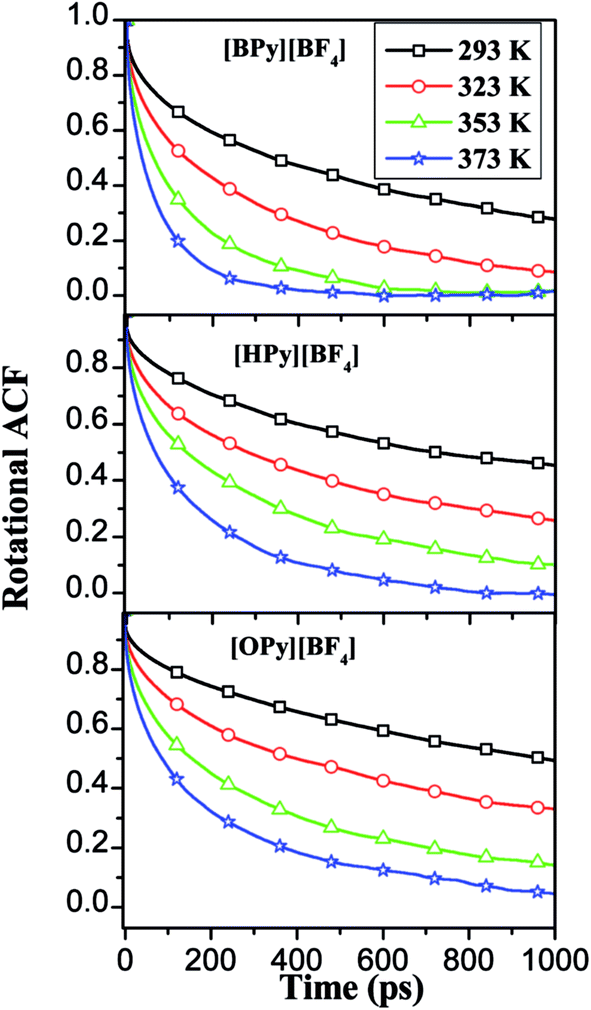 | ||
| Fig. 10 RACFs of perpendicular line in the pyridine ring under different temperatures for the three ILs. | ||
The relaxation times are fitted from the curves in Fig. 10 to a double exponential decay,53 as shown in eqn (3).
 | (3) |
| ILs | τ1 (ps) (a) | τ2 (ps) | ||||||
|---|---|---|---|---|---|---|---|---|
| 293 K | 323 K | 353 K | 373 K | 293 K | 323 K | 353 K | 373 K | |
| [BPy][BF4] | 30.89 (0.267) | 20.85 (0.306) | 10.41 (0.298) | 5.37 (0.270) | 957.92 | 432.79 | 181.61 | 92.77 |
| [HPy][BF4] | 41.28 (0.210) | 34.66 (0.301) | 20.05 (0.317) | 11.44 (0.306) | 1607.90 | 906.31 | 460.54 | 206.54 |
| [OPy][BF4] | 45.57 (0.197) | 38.34 (0.277) | 31.02 (0.354) | 24.39 (0.403) | 2083.70 | 1158.50 | 578.04 | 355.16 |
 , where θ(r,t) represents the Heaviside step function.17 When the two associated particles are combined, θ(r,t) gets a value of 1, and when the two particles depart, the value becomes zero. NC is the number of selected particles, and NA is the number of associated particles that are bound to the selected particles. Here, we choose HA1–B to study the association in the polar region. If the distance is within the minimum of the first coordination shell of their RDFs, HA1 and B are deemed associated. Similarly, the association in the nonpolar region is determined by comparing the distance of CTn–CTn (n = 4, 6, 8) with their RDF minimum at the first coordination shell.
The temperature dependence effects on the association dynamics of [HPy][BF4] in the polar and nonpolar regions are compared in Fig. 11 in terms of TCFs. Other ILs can be found in Fig. S6–S8 of the ESI.† Evolving over time, the TCFs first drop fast and then decay slowly. The long-time decay of HA1–B is extremely slow under low temperature, thus indicating the strong interactions between the cations and the anions. As the temperature increases, the TCFs of the three pyridinium ILs decay quickly and gradually approach zero within an adequate time. Conversely, the association time of the nonpolar regions is shorter than that of the polar regions. This result indicates a relatively fast association dynamics for the alkyl chain because the tails are associated because of the VDW interactions, which are weaker than the Coulomb interactions in the polar regions.55
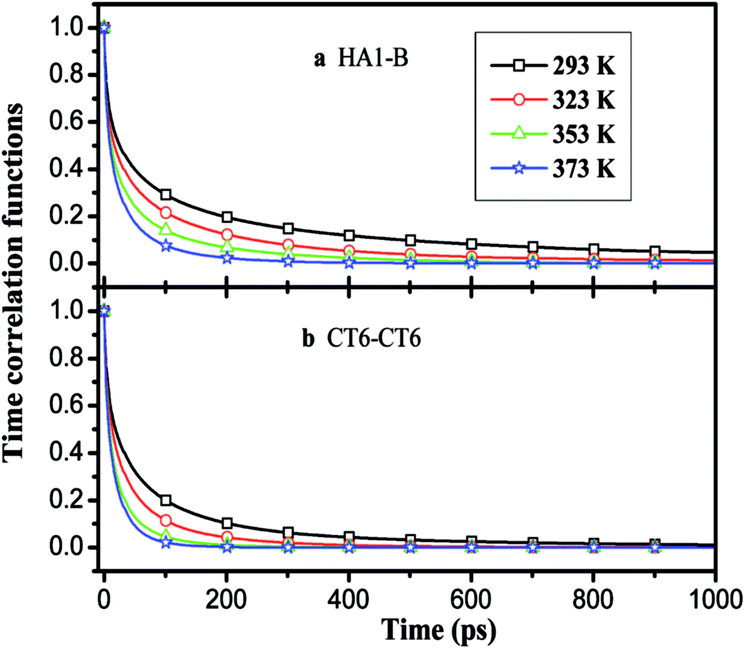 | ||
| Fig. 11 Time correlation functions of HA1–B (a) and ending carbon CT6–CT6 (b) for [HPy][BF4] at different temperatures. | ||
As shown in Fig. 12, with the increase of the alkyl chain length, the tendency of the function to decay to zero accelerates. The attenuation of [OPy][BF4] is the fastest. The comparison of Fig. 12(a) and (b) shows that the attenuation time is longer at 293 K than at 373 K. The TCFs of the three ILs are not zero in 1 ns at 293 K, whereas all the functions decay to zero in about 0.5 ns at 373 K. Hence, temperature exerts a significant effect on ion association. Although the temperature increase leads to its reduction within the average association time, the aggregation degree of the polar regions increases for the quick interchange of anions and cations among the ion pairs.
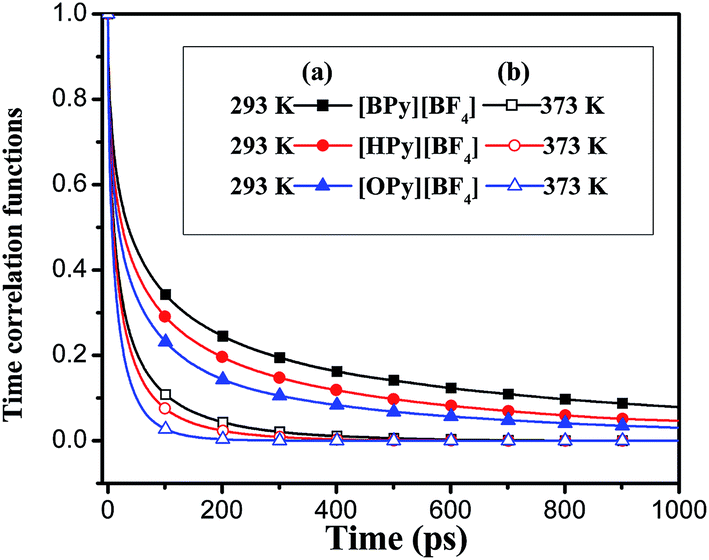 | ||
| Fig. 12 TCFs of HA1–B of three ILs with different alkyl chain lengths at 293 K ((a) the solid symbol) and 373 K ((b) the hollow symbol). | ||
4. Conclusion
A systematic study is conducted on the local structure and the microscopic dynamics of three types of ILs. The influence of temperature on the structures of ILs is obvious. For [OPy][BF4] with one longer alkyl chain, some particularity is observed in its structural changes when the temperature rises. Such particularity is reflected by the RDFs and SDFs. Most of the site–site RDFs decrease with the increase in the temperature, except for the tail of [OPy][BF4]. The SDFs indicate an increase in aggregation at a high temperature for both the polar and the nonpolar regions in the pyridinium ILs. The anions are mainly distributed around the pyridine rings, and the tails of the cations gather together.In microscopic dynamics, as the temperature increases, the molecular thermal motion becomes fast and the correlation declines. The resulting VACFs show that a high temperature and long alkyl chain cause ions to easily reverse the direction of their motion. Over time, the rotation of the pyridine rings decays rapidly with the increase in the temperature. This outcome leads to a decrease in the correlation and relaxation time of rotation. We also study how temperature influences the association in the polar and nonpolar regions on the basis of TCFs. With the increase in the temperature, the association dynamics decrease. At the same temperature, the association time of [OPy][BF4] is the shortest for its longest chains in the three ILs. Under the same system, the association time for the polar region is longer than that for the nonpolar region. These results will be helpful to understand the particular solute–solvent behaviors in ionic liquids.
Acknowledgements
This work was supported by the National Natural Science Foundation of China (No. 21173002, 61475001, 21103040 and 21673003) and the Science Foundation of the Education Committee of Anhui Province of China (No. KJ2010A145).References
- R. D. Rogers and K. R. Seddon, Science, 2003, 302, 792–793 CrossRef PubMed.
- Z. Liu, S. Huang and W. Wang, J. Phys. Chem. B, 2004, 108, 12978–12989 CrossRef CAS.
- Ł. Marcinkowski, A. Kloskowski, J. Czub, J. Namieśnik and D. Warmińska, J. Chem. Thermodyn., 2015, 88, 36–43 CrossRef.
- T. Pal and R. Biswas, J. Phys. Chem. B, 2015, 119, 15683–15695 CrossRef CAS PubMed.
- N. Deenadayalu, I. Bahadur and T. Hofman, J. Chem. Eng. Data, 2011, 56, 1682–1686 CrossRef CAS.
- K. C. Badgujar and B. M. Bhanage, Bioresour. Technol., 2015, 178, 2–18 CrossRef CAS PubMed.
- H. Olivier-Bourbigou, L. Magna and D. Morvan, Appl. Catal., A, 2010, 373, 1–56 CrossRef CAS.
- D. Wei and A. Ivaska, Anal. Chim. Acta, 2008, 607, 126–135 CrossRef CAS PubMed.
- G. Quijano, A. Couvert and A. Amrane, Bioresour. Technol., 2010, 101, 8923–8930 CrossRef CAS PubMed.
- N. Deenadayalu, I. Bahadur and T. Hofman, J. Chem. Thermodyn., 2010, 42, 726–733 CrossRef CAS.
- V. Govinda, P. M. Reddy, I. Bahadur, P. Attri, P. Venkatesu and P. Venkateswarlu, Thermochim. Acta, 2013, 556, 75–88 CrossRef CAS.
- R. Hayes, G. G. Warr and R. Atkin, Chem. Rev., 2015, 115, 6357–6426 CrossRef CAS PubMed.
- M. Liang, A. Kaintz, G. A. Baker and M. Maroncelli, J. Phys. Chem. B, 2012, 116, 1370–1384 CrossRef CAS PubMed.
- C. Chiappe and C. S. Pomelli, Phys. Chem. Chem. Phys., 2013, 15, 412–423 RSC.
- P. Henritzi, A. Bormuth, F. Klameth and M. Vogel, J. Chem. Phys., 2015, 143, 164502 CrossRef PubMed.
- G. W. Meindersma, A. R. Hansmeier and A. B. D. Haan, Ind. Eng. Chem. Res., 2010, 49, 7530–7540 CrossRef CAS.
- P. K. Sahu, S. K. Das and M. Sarkar, J. Phys. Chem. B, 2014, 118, 1907–1915 CrossRef CAS PubMed.
- Y. Wang, M. R. Shimpi, S. Sarman, O. N. Antzutkin, S. Glavatskih, L. Kloo and A. Laaksonen, J. Phys. Chem. B, 2016, 120, 7446–7455 CrossRef CAS PubMed.
- E. J. Maginn, J. Phys.: Condens. Matter, 2009, 21, 373101 CrossRef CAS PubMed.
- M. Sha, H. Dong, F. Luo, Z. Tang, G. Zhu and G. Wu, J. Phys. Chem. Lett., 2015, 6, 3713–3720 CrossRef CAS PubMed.
- G. E. Logotheti, J. Ramos and I. G. Economou, J. Phys. Chem. B, 2009, 113, 7211–7224 CrossRef CAS PubMed.
- K. R. Ramya, P. Kumar and A. Venkatnathan, J. Phys. Chem. B, 2015, 119, 14800–14806 CrossRef CAS PubMed.
- D. Tomida, S. Kenmochi, K. Qiao, T. Tsukada and C. Yokoyama, Fluid Phase Equilib., 2013, 340, 31–36 CrossRef CAS.
- B. Mokhtarani, A. Sharifi, H. R. Mortaheb, M. Mirzaei, M. Mafi and F. Sadeghian, J. Chem. Thermodyn., 2009, 41, 323–329 CrossRef CAS.
- M. Larriba, S. García, P. Navarro, J. García and F. Rodríguez, J. Chem. Eng. Data, 2012, 57, 1318–1325 CrossRef CAS.
- I. V. Voroshylova and V. V. Chaban, J. Phys. Chem. B, 2014, 118, 10716–10724 CrossRef CAS PubMed.
- J. N. A. C. Lopes and A. A. H. Pádua, J. Phys. Chem. B, 2006, 110, 19586–19592 CrossRef PubMed.
- X. Wu, Z. Liu, S. Huang and W. Wang, Phys. Chem. Chem. Phys., 2005, 7, 2771–2779 RSC.
- B. Hess, C. Kutzner, D. van der Spoel and E. Lindahl, J. Chem. Theory Comput., 2008, 4, 435–447 CrossRef CAS PubMed.
- H. J. C. Berendsen, D. van der Spoel and R. van Drunen, Comput. Phys. Commun., 1995, 91, 43–56 CrossRef CAS.
- G. Bussi, D. Donadio and M. Parrinello, J. Chem. Phys., 2007, 126, 014101 CrossRef PubMed.
- H. J. Berendsen, J. V. Postma, W. F. van Gunsteren, A. R. H. J. DiNola and J. R. Haak, J. Chem. Phys., 1984, 81, 3684–3690 CrossRef CAS.
- U. Essmann, L. Perera, M. L. Berkowitz, T. Darden, H. Lee and L. G. Pedersen, J. Chem. Phys., 1995, 103, 8577–8593 CrossRef CAS.
- B. Hess, H. Bekker, H. J. Berendsen and J. G. Fraaije, J. Comput. Chem., 1997, 18, 1463–1472 CrossRef CAS.
- D. L. Cheung, S. J. Clark and M. R. Wilson, Chem. Phys. Lett., 2002, 356, 140–146 CrossRef CAS.
- I. Bahadur and N. Deenadayalu, J. Solution Chem., 2011, 40, 1528–1543 CrossRef CAS.
- W. Jiang, Y. Wang and G. A. Voth, J. Phys. Chem. B, 2007, 111, 4812–4818 CrossRef CAS PubMed.
- G. Zhu, Y. Wang, L. Zhang, Y. Luo, M. Sha and X. Xu, J. Mol. Liq., 2015, 203, 153–158 CrossRef CAS.
- V. Lesch, Z. Li, D. Bedrov, O. Borodin and A. Heuer, Phys. Chem. Chem. Phys., 2016, 18, 382–392 RSC.
- C. Knight, C. M. Maupin, S. Izvekov and G. A. Voth, J. Chem. Theory Comput., 2010, 6, 3223–3232 CrossRef CAS PubMed.
- H. Sun, B. Qiao, D. Zhang and C. Liu, J. Phys. Chem. A, 2010, 114, 3990–3996 CrossRef CAS PubMed.
- I. Bandrés, R. Alcalde, C. Lafuente, M. Atilhan and S. Aparicio, J. Phys. Chem. B, 2011, 115, 12499–12513 CrossRef PubMed.
- S. Li, G. Feng, J. L. Bañuelos, G. Rother, P. F. Fulvio, S. Dai and P. T. Cummings, J. Phys. Chem. C, 2013, 117, 18251–18257 CAS.
- Y. Chen, N. L. Doltsinis, R. C. Hider and D. J. Barlow, J. Phys. Chem. Lett., 2012, 3, 2980–2985 CrossRef CAS PubMed.
- I. Morrow Timothy and J. Maginn Edward, J. Phys. Chem. B, 2002, 106, 12807–12813 CrossRef.
- J. Wang, H. Wang, S. Zhang, S. Zhang and Y. Zhao, J. Phys. Chem. B, 2007, 111, 6181–6188 CrossRef CAS PubMed.
- K. Singer, J. V. L. Singer and A. J. Taylor, Mol. Phys., 1979, 37, 1239–1262 CrossRef CAS.
- W. Humphrey, A. Dalke and K. Schulten, J. Mol. Graphics, 1996, 14, 33–38 CrossRef CAS PubMed.
- T. Kavitha, P. Attri, P. Venkatesu, R. R. Devi and T. Hofman, J. Phys. Chem. B, 2012, 116, 4561–4574 CrossRef CAS PubMed.
- T. Chan, H. Li and K. Li, J. Phys. Chem. B, 2015, 119, 15718–15728 CrossRef CAS PubMed.
- D. Roy, S. Liu, B. L. Woods, A. R. Siler, J. T. Fourkas, J. D. Weeks and R. A. Walker, J. Phys. Chem. C, 2013, 117, 27052–27061 CAS.
- S. Bouazizi and S. Nasr, J. Mol. Liq., 2011, 162, 78–83 CrossRef CAS.
- M. E. Siwko, S. J. Marrink, A. H. de Vries, A. Kozubek, A. J. S. Uiterkamp and A. E. Mark, Biochim. Biophys. Acta, Biomembr., 2007, 1768, 198–206 CrossRef CAS PubMed.
- T. Chang, L. Dang, R. Devanathan and M. Dupuis, J. Phys. Chem. A, 2010, 114, 12764–12774 CrossRef CAS PubMed.
- T. A. Lima, V. H. Paschoal, L. F. Faria, M. C. Ribeiro and C. Giles, J. Chem. Phys., 2016, 144, 224504 CrossRef PubMed.
Footnote |
| † Electronic supplementary information (ESI) available. See DOI: 10.1039/c6ra26866h |
| This journal is © The Royal Society of Chemistry 2017 |