 Open Access Article
Creative Commons Attribution 3.0 Unported Licence
Stability, rheological property and oil-displacement mechanism of a dispersed low-elastic microsphere system for enhanced oil recovery
Hongbin Yang *ab,
Wanli Kang*ab,
Hairong Wua,
Yang Yua,
Zhou Zhub,
Pengxiang Wangb,
Xiangfeng Zhangb and
Bauyrzhan Sarsenbekulyb
aEnhanced Oil Recovery Research Institute, China University of Petroleum (Beijing), Beijing 102249, People's Republic of China. E-mail: hongbinyang@upc.edu.cn; kangwanli@126.com
bSchool of Petroleum Engineering, China University of Petroleum (East China), Qingdao 266580, People's Republic of China
First published on 23rd January 2017
Abstract
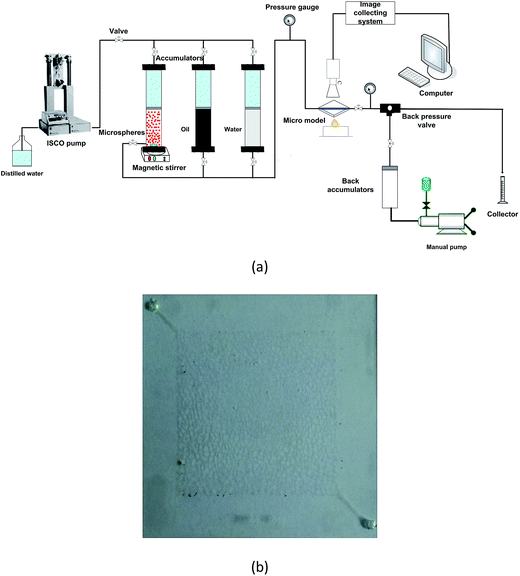
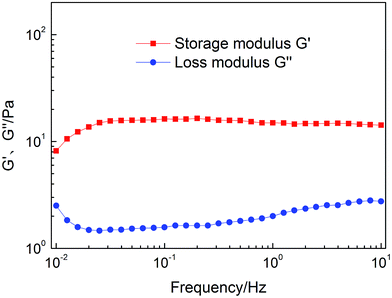
A dispersed low-elastic microsphere system, consisting of low-viscoelastic microspheres and polymers, is a novel suspension system for enhanced oil recovery in heterogeneous reservoirs. In this study, experiments were performed to characterize the morphology, viscoelasticity, and swelling performance of the synthetic low-elastic microspheres. The stability and rheological property of the dispersed low-elastic microsphere system was investigated using a Turbiscan Lab Expert stability analyzer and an MCR301 rheometer. In the flow and displacement experiments, the parallel-sandpacks model and microscopic visualization models were used to study the oil-displacement effect and micromigration mechanism of the low-elastic microspheres. The experimental results showed that the storage modulus (G′) of the synthetic low-elastic microspheres was only 23.6 Pa and they also had a good swelling property in the simulated formation water. The parallel-sandpacks test and micromodel test indicated that the dispersed low-elastic microsphere system was a promising agent for both conformance control and improved oil recovery in heterogeneous reservoirs. Moreover, the low-elastic microspheres had good deformation and shear resistance performances. Five transport behaviors, such as deformable passing through, partition passing through, blockage, adhesion, and directly passing through, of low-elastic microspheres in a porous medium have been put forward. This study not only provides an understanding of the properties of the dispersed low-elastic microsphere system but also supplies theoretical support for the mechanism of improving oil recovery for the dispersed low-elastic microsphere system.
1. Introduction
With the development of mature oilfields, the phenomenon of water breakthrough among oil wells and water wells is becoming more and more serious. And, the injection of water for oil recovery is not effective. Thus, there is a large amount of oil remaining in the reservoirs. As the number of newly discovered reservoirs decreases, it is more and more important to improve the oil recovery of mature oilfields. According to the previous reports, reservoir heterogeneity is one of the most important factors for low-oil recovery and water breakthrough.1,2 Reservoirs with induced fractures or high permeability channels, commonly called thief zones or streaks due to extensive water flooding, are quite common in mature reservoirs. Many methods, including polymer flooding, alkaline-surfactant-polymer flooding, foam flooding, and gel treatments, have been applied to mitigate water breakthrough and to improve oil recovery.Many polyacrylamide polymer gels have been used to reduce the water cut by sealing the thief zone and redistributing the water drive to enhance the oil recovery of heterogeneous oilfields.3–8 Although in situ polyacrylamide polymer gels are economically attractive, they have some inherent negative effects on the treatment of wells caused by the formation temperature, salinity, shearing, adsorption, diluted formation water, chromatographic separation effect or other environmental factors. Considering the abovementioned negative effects, preformed gels have been proposed for conformance control and improving oil recovery. The preformed gels are formed at surface facilities before injection, whereby they are injected into the reservoir in the form of particles. These particle gels can tolerate high salinity and high temperature, but are slightly sensitive to pH and H2S reservoir conditions.9–11 Preformed gels can be divided into microgels, preformed particle gel (PPG), and Bright Water according to their particle size, swelling ratio, and swelling time. In 2001, Chauveteau et al. prepared a type of microgel using a terpolymer of acrylamide containing 2% acrylates and 2% sulfonated groups as a monomer and zirconium(IV) lactate as a cross-linker.12 The diameter of typical microgels was 1–3 μm. Zaitoun et al. researched the migration of microgels in a porous medium and found that there was no sign of continuous plugging in high permeability or fractural reservoirs.13 Furthermore, both Choi et al. and Benson et al. reported that a high filtration retention of polyelectrolyte microgels occurred in mid-permeability rocks. This problem was solved by the pre-addition of citric acid. However, low-pH conditions could increase the polymer adsorption near the wellbore and impose additional chemical costs.14,15 Bright Water was proposed by both Pritchett et al. and Frampton et al. The diameter of this gel system varied from dozens of microns to a few hundred microns. The gel system was prepared by the reversed phase emulsification polymerization of acrylamide and its derivatives with both labile and stable cross-linkers. Unfortunately, due to poor thermal stability and a limited application range, Bright Water was not widely used in a pilot.16,17 PPG was initiated by Petro China in 1996, and was prepared by a solution polymerization method, followed by crushing and sieving to the desired particle size using acrylamide and N,N′-methylenebisacrylamide as the monomer and cross-linker, respectively. The particle size of PPG ranges from millimeters to micrometers. Millimeter-size PPG has been successfully used in more than 5000 wells in China for deep profile control performance.18 PPGs were also employed by Halliburton and Occidental to control CO2 breakthrough in CO2 flooding areas.19 PPG can tolerate high salinity and high temperature and is thus can support the development of oilfields with strong heterogeneity, a high water-cut, and large porous channels.20,21 However, the application of PPG is limited to reservoirs with fractures or fracture-like channels because of its large size.22 In addition, PPGs have no defined shape and are easily broken after swelling in fractures.
In the early 21st century, a new chemical agent called a viscoelastic microsphere was proposed and has attracted extensive interest from researchers.23–25 Some pilot tests were performed in Shengli, Jidong, and Dagang Oilfields in China and a good effect of water control and enhanced oil recovery was obtained.26–29 The viscoelastic microsphere used in petroleum engineering was prepared by inverse phase polymerization, with a particle size ranging from several nanometers to hundreds of micrometers based on the pore characteristics of the target layer in underground conditions. Viscoelastic microspheres are a viscoelastic plugging agent with a 3D structure, and can absorb much more water as compared to their own mass, ranging from several to hundreds of times more, and furthermore, it is hard to release the absorbed liquids even under high pressure.30,31 However, despite the many advantages it has, there are still some problems in the practical application in oilfields. The high rigidity of industrial viscoelastic microspheres leads to a poor deformability. Consequently, industrial viscoelastic microspheres are retained around the near-wellbore area. After absorption and swelling, they might be sheared and broken, limiting the blocking effect. Hence, a kind of viscoelastic microsphere that can be flexible during injection and resistive to shearing after swelling is in urgent need to meet the requirements of injection and blocking.
Although the deformability is one of the most important properties for successful water control and enhanced oil recovery, few studies have investigated the effect of the storage modulus (G′) and loss modulus (G′′) of viscoelastic microspheres on the profile control and oil-displacement behavior. Moreover, the stability and rheological properties of the dispersed low-elastic microsphere system have not been comprehensively researched before. The stability of the dispersed low-elastic microsphere system plays a decisive role in deep profile control. If the stability is poor, the purpose of deep profile control would not be achieved easily as viscoelastic microspheres can easily adsorb in near the wellbore and plug the injection channel near the wellbore. The assessment method for stability of the dispersion system is a direct observation of the particle sedimentation of the dispersion system by the naked eye; for example, the bottle test method.32 This method is simple and popular, but the results of this method are qualitative and there are certain subjective factors that need to be taken into consideration. Currently, optical analysis instruments have been used to analyze the stability of the suspension system. The TURBISAN Lab Expert type stability analyzer is one kind of such instrument, which uses multiple light scattering techniques to study the stability. It can analyze microscopic phenomena of emulsions, suspensions, foam liquids, and other dispersion systems quickly. Besides, it can analyze the rate of sedimentation or flotage and changes in internal phase particle size quantitatively. It has been widely used to analyze the stability of coal-water slurry, pesticides, food, crude oil emulsions, and others.33–36 Surprisingly, the stability of the dispersed swellable viscoelastic microspheres system has not been reported yet. Polymer microspheres are different from conventional rigid particles in that the morphology of polymer microspheres can change with the imposition of a weak external force. The dispersed polymer microsphere system is known as a complex fluid. The rheology of the dispersed system can reflect the change in internal structure of the fluid. The rheological measurement of the dispersed system has been an effective method to detect their complex structure. Research into the rheology of the dispersed system has mainly focused on issues around agricultural chemicals, papermaking, and the food industry. The rheology of the dispersed polymer microspheres is particularly complicated because of the charge on the surface of the microspheres and the swelling property.37,38 Currently, very few reports about the rheological properties of the dispersed polymer microspheres system have been taken.
In the present work, a low-elastic microsphere with a storage modulus (G′) of 23.6 Pa was prepared through inverse suspension polymerization. The macroscopic features and internal structure were characterized, then the swelling and viscoelasticity of microspheres in simulated formation water were studied. A Turbiscan Lab Expert type stability analyzer and MCR301 rheometer were used to investigate the stability and rheological property of the dispersed low-elastic microsphere system. The micro-migration mechanism and oil-displacement mechanism were then studied using one micromodel and a series of parallel-sandpacks models. On the basis of these results, we propose a dispersed viscoelastic microsphere system and put forward five transport behaviors of low-elasticity microspheres in a porous medium. This research provides theoretical support for the further study of the dispersed viscoelastic microsphere system. The mechanism of improving oil recovery is proposed.
2. Experimental section
2.1 Materials
The materials applied were as follows: acrylamide (AM, purity above 98.5%), acrylic acid (AA, purity above 99.7%), ammonium persulfate (APS, purity above 98.0%), dispersants (Span80 & Tween60), ammonium chloride (NH4Cl, purity above 99.5%), polyethylene glycol (PEG-200), sodium hydroxide (NaOH, purity above 98%), N,N′-methylenebisacrylamide (MBA, purity above 99.0%), anhydrous ethanol (CH3CH2OH, purity above 99.5%), and acetone (CH3COCH3, purity above 99.5%). All the reagents were used without any purification. Hydrolyzed polyacrylamide (HPAM, relative molecular mass 27.4 × 10⁶) was supplied by Dagang Oilfield (China), while aviation kerosene was purchased from the market. Deionized water was used for the preparation of all the aqueous solutions. The oil used in this study was from Dagang Oilfield (China) and was dehydrated crude oil. The composition of the simulated formation water used in the study is shown in Table 1.| Composition | Na+/K+ | Ca2+ | Mg2+ | Cl− | CO32− | HCO3− | SO42− | Total |
|---|---|---|---|---|---|---|---|---|
| Concentration, mg L−1 | 2043 | 39 | 36 | 1337 | 135 | 3126 | 10 | 6726 |
2.2 Preparation of low elastic microspheres
The low-elastic microspheres were prepared by inverse suspension polymerization. Typically, 0.6 g of dispersants [m(Span80)![[thin space (1/6-em)]](https://www.rsc.org/images/entities/char_2009.gif) :
:![[thin space (1/6-em)]](https://www.rsc.org/images/entities/char_2009.gif) m(Tween60) = 1
m(Tween60) = 1![[thin space (1/6-em)]](https://www.rsc.org/images/entities/char_2009.gif) :
:![[thin space (1/6-em)]](https://www.rsc.org/images/entities/char_2009.gif) 1] and 60 g of aviation kerosene were put in a 250 mL four-necked flask equipped with a mechanical stirrer, a dropping funnel, a reflux condenser, and a nitrogen catheter. Meanwhile, the mechanical stirrer was started at a speed of 380 rpm under nitrogen atmosphere to make the dispersants dissolve. Then, the mixed solutions (20 g) with AM, APS, MBA, NH4Cl, PEG-200, and NaOH (6 g of AM, 0.0006 g of MBA, 0.2 g of 15 wt% APS, 0.34 g of 15 wt% NH4Cl, 0.005 g of PEG-200, and 0.254 g of 15 wt% NaOH) were added drop-wise into the oil phase at the speed of 2 mL min−1. The temperature of the thermostat water bath was raised up to 69 °C after dropping off. After reaction for 6 h at this temperature, the resulting product was cooled and filtered and then dried at 80 °C for 48 h. In this way, low-elastic microspheres were obtained.
1] and 60 g of aviation kerosene were put in a 250 mL four-necked flask equipped with a mechanical stirrer, a dropping funnel, a reflux condenser, and a nitrogen catheter. Meanwhile, the mechanical stirrer was started at a speed of 380 rpm under nitrogen atmosphere to make the dispersants dissolve. Then, the mixed solutions (20 g) with AM, APS, MBA, NH4Cl, PEG-200, and NaOH (6 g of AM, 0.0006 g of MBA, 0.2 g of 15 wt% APS, 0.34 g of 15 wt% NH4Cl, 0.005 g of PEG-200, and 0.254 g of 15 wt% NaOH) were added drop-wise into the oil phase at the speed of 2 mL min−1. The temperature of the thermostat water bath was raised up to 69 °C after dropping off. After reaction for 6 h at this temperature, the resulting product was cooled and filtered and then dried at 80 °C for 48 h. In this way, low-elastic microspheres were obtained.
2.3 Microscopic characterization of the low-elasticity microspheres
An XSJ-2 optical microscope (Chongqing Optical Instrument Co., Ltd., China) was used to observe the morphology of the low-elastic microspheres before and after swelling. FEI Quanta 200 FEG (FEI Company, Holland) was used to observe the internal structure of the low-elastic microspheres after swelling.A Rize2006 laser particle size analyzer (Jinan Runzhi Technology Co., Ltd., China) was used to analyze the particle size before and after swelling. The initial particle size was measured in anhydrous ethanol solution, while the swollen particle size was measured in Dagang Oilfield simulated formation water at 50 °C. In the particle size distribution curves, D50 was used to express the average particle size of the microspheres before and after swelling. D50 is the particle size from the cumulative distribution curve for a probability of 50%.
2.4 Swelling property and viscoelasticity of the low-elastic microspheres
 | (1) |
2.5 Stability of the dispersed low-elastic microsphere system
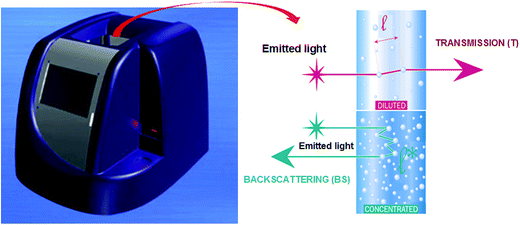
The stability of the dispersed low-elastic microsphere system was evaluated using a Turbiscan Lab Expert type stability analyzer manufactured by Formulation (France). Fig. 1 presents the measurement principle diagram from the Turbiscan Lab Expert type stability analyzer. This instrument was based on multiple light scattering. The transmittance (T) and backscattering (BS) of a pulsed near-infrared light (λ = 880 nm) were monitored by two synchronous optical detectors. The intensities of the reflected transmitted light and back-scattered light vary with the height of the sample. The scanning curve also reflected microscopic characteristics of the particle size growth or the migration of the colloidal or dispersed phase at a given time. The analysis of stability was carried out according to variations in the profiles of transmittance (T) or backscattering (BS). The stability of the dispersed low-elastic microsphere system was evaluated by TSI (Turbiscan Stability Index) with the help of Turbiscan Easy Soft. TSI was calculated by eqn (2):
 | (2) |
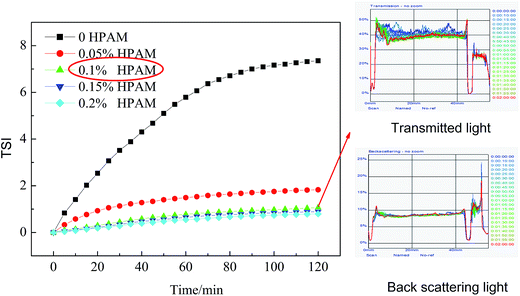
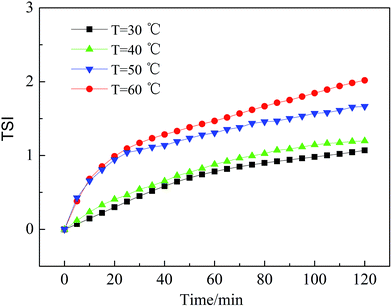
TSI takes into account all the processes taking place in the sample (particle coalescence and settling process), so it is mainly used for the quantitative evaluation of dispersion stability. The larger the TSI value, the less stable the dispersed system. In this study, 20 mL of different dispersed low-elastic microsphere systems were placed into cylindrical glass tubes and submitted to analysis by the Turbiscan Lab Expert type stability analyzer. Two detectors were used to scan along the height of the different dispersed low-elastic microsphere systems sealed in the tubes at different temperatures for 2 h.
2.6 Rheological properties of the dispersed low-elastic microsphere systems
The temperature was controlled at a constant 50 °C. Rheological properties of different low-elastic microspheres systems were measured using a steady shear model and using the Physica MCR301 Rheometer (Anton Paar, Austria). A cylinder measuring system with an inner diameter of 26.666 mm was used. The steady shear measurement was conducted with a shear rate from 0.001 to 4000 s−1.2.7 Profile control and oil-displacement experiments
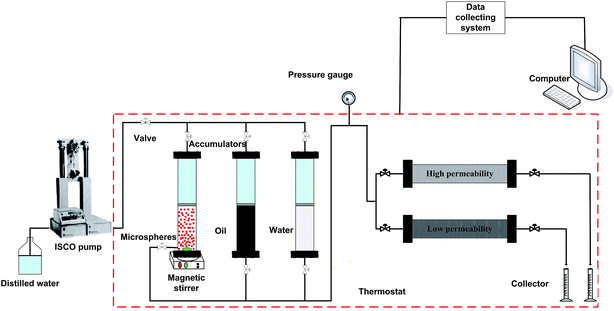
Sandpacks were prepared at the ambient temperature of 25 °C. Fresh sand was used for each test to ensure the same wettability. The porosity was measured using the weight method, while the permeability measurement was conducted using Darcy's law of single water flow. In the dispersed low-elastic microsphere flow tests, brine was first injected into the parallel sandpacks, followed by 0.4 PV polymer flooding, at a concentration of 1000 mg L−1, using an ISCO pump, at a rate of 0.5 mL min−1. After that, water flooding was performed, followed by applying the dispersed low-elastic microsphere system, using an ISCO pump, at a rate of 0.5 mL min−1. After 0.4 PV dispersed low-elastic microspheres were injected, brine was injected in order to see the variation in the flow rates of the two sandpacks. The brine injection rate during these experiments was the same as that of the dispersed low-elastic microsphere system injection. The data for the pressures and effluent volumes of the two sandpacks were recorded.
3. Results and discussion
3.1 Morphology and microstructure characterization of the low-elastic microspheres
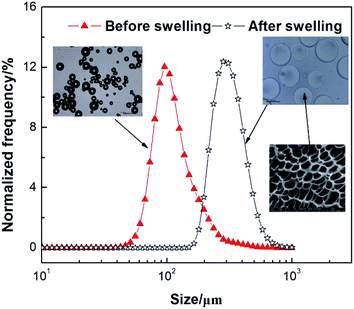
Fig. 4 gives the particle size analysis of the low-elastic microspheres before and after swelling at room temperature. It can be observed that the average particle sizes of the low-elastic microspheres before and after swelling are 100.5 μm and 295.8 μm. As can be seen from Fig. 4, the low-elastic microspheres are spherical particles and can swell many times due to absorbing a lot of water. As the low-elastic microspheres contact with water, the water molecules can go into the internal network under the action of inside and outside osmotic pressure, stretching the molecular chain of the network structure and enlarging the volume absorbed by the low-elastic microspheres. The three-dimensional (3D) network structure with pore sizes ranging from 1.29 μm to 2.95 μm can be seen clearly from the ESEM image (Fig. 4). The investigated microstructure confirms the swelling mechanism of the low-elastic microspheres.3.2 Viscoelasticity and swelling property of the low-elastic microspheres
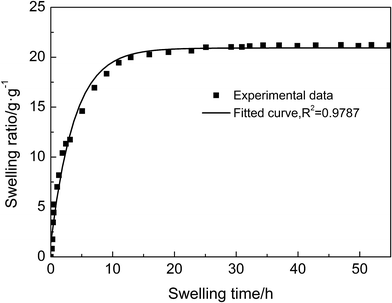
| SRt = SRe(1 − e−t/τ) | (3) |
The data obtained from the equilibrium water absorbency and the swelling rate was fitted into eqn (3) to obtain the rate parameter and power parameter SRe. The rate parameter and power parameter for the superabsorbent were found to be 3.24 h and 21.92 g g−1, respectively. Because the rate parameter τ is a measure of the resistance to water permeation, the relative value (3.24 h) reflects the water absorption rate.
3.3 Stability of dispersed low-elastic microsphere systems
3.4 Rheological properties of the dispersed low-elastic microsphere system
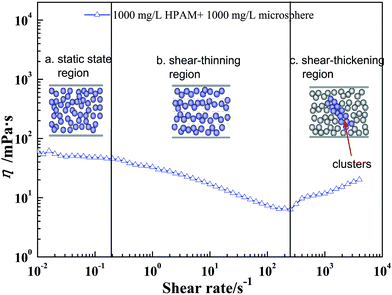
Fig. 9 shows the apparent viscosity of the dispersed system with the increase of shearing rate at different polymer concentrations. As Fig. 9 shows, there is a critical shear rate (γc) with the increase in shear rate. The apparent viscosity of the dispersed low-elastic microspheres system decreases with the increase in shear rate in the case of γ < γc, but the opposite is true when γ > γc. The former is classed as shear-thinning, and the latter shear-thickening. At low shear rates, low-elastic microspheres in the dispersed system have a tendency to move away from each other due to repulsive inter-particle electrostatic or Brownian forces, which stabilizes the dispersed system and helps maintain a low viscosity. As the shear rate increases, the hydrodynamic forces increase, which makes the low-elastic microspheres move closer. When the hydrodynamic lubrication forces become greater than the repulsive forces, the low-elastic microspheres aggregate into clusters. These aggregates limit the flow, and this can explain the strong increase of viscosity observed at a critical shear rate.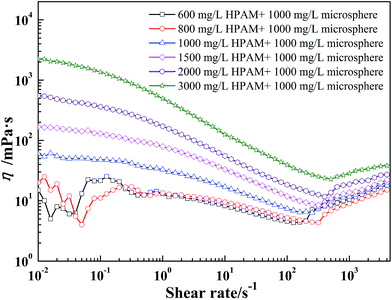 | ||
| Fig. 9 The apparent viscosity of the dispersed system with the increase in shear rate at different polymer concentrations. | ||
The shear-thickening behavior is the result of the microstructure change and the interaction of the internal forces of the dispersed system. Fig. 10 shows a schematic diagram of the shear-thickening property. According to the multilayer structure theory of Hoffmann,39 the whole dispersed system shows an ordered layer structure at a low shear rate, where low-elastic microspheres flow in their respective layer separately. With the increase in shear rate, low-elastic microspheres only transform and orientate in their respective layers under shear, which leads to a shear-thinning behavior. The hydrodynamic force is the primary force in the dispersed system, which urges the isolated low-elastic microspheres to aggregate again and to form unsteady clusters separated by the dispersion medium. The clusters grow larger as the hydrodynamic force increases, as a result of which, the resistance effect on the system increases, thus showing an increase in the apparent viscosity.40–42
3.5 Oil-displacement mechanism of the dispersed low-elastic microsphere system
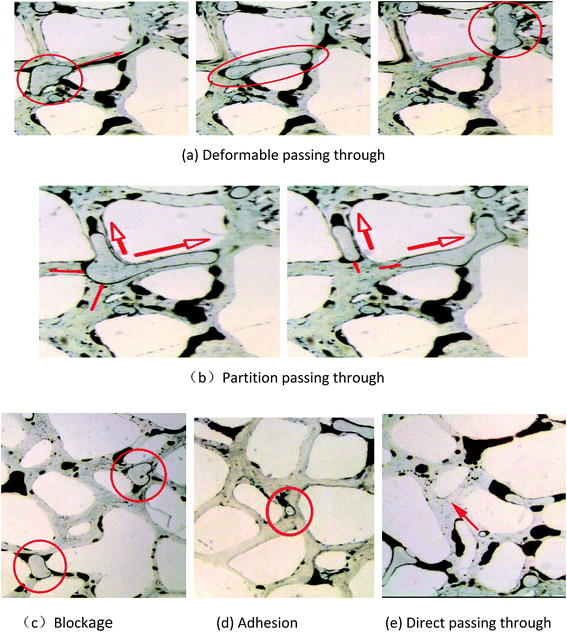
3.5.1.1 Deformable passing through. When the low-elastic microspheres are blocked in the pore throat, if the differential pressure of the driving fluid is high enough, it will squeeze the microspheres, and the swollen microspheres will dehydrate, shrink, and deform, such that they can then pass through the pore throat. When the deformed microspheres pass through the pore throat, they will absorb water again, and reform to their original sizes, as shown in Fig. 11(a).
3.5.1.2 Partition passing through. When the microspheres are plugged in the pores, if the differential pressure is high enough and the rate of compression is much larger than the rate of shrinkage, then the low-elastic microspheres will be cut off into smaller ones by the pore throat under the action of the pressure, as shown in Fig. 11(b).
3.5.1.3 Blockage. The low-elastic microspheres cannot move forward and so plug at the entrance of the pore throat when the diameter of the microspheres is larger than the pore throat size, because the differential pressure is not high enough to push the microspheres through the pore throat, as shown in Fig. 11(c).
3.5.1.4 Adhesion. When the low-elastic microspheres are too small, and the pressure is not sufficient to overcome the force of surface adsorption in porous media particles, the low-elastic microspheres will adhere and be retained on the surface of the porous medium, with these low-elastic microspheres mainly located between the main channels, as shown in Fig. 11(d).
3.5.1.5 Direct passing through. Here, the low-elastic microspheres are smaller than the pore throat diameter, and the pressure is greater than the force of the surface adsorption in porous media particles, as shown in Fig. 11(e).
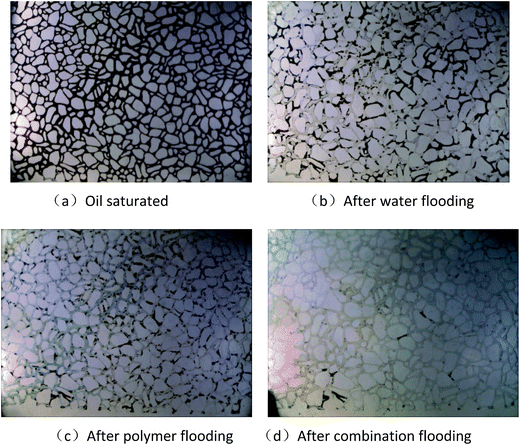
3.5.2.1 Oil-displacement effect and oil-displacement mechanism. As shown in Fig. 12, due to a high water-oil mobility ratio, the swept volume of water flooding is small and water preferentially accesses large pores and a fingering phenomenon occurs, whereas small holes are not swept and a lot of remaining oil is hence distributed there. The remaining oil is mainly distributed in small pores in a low permeability zone, with less large pores, as shown in Fig. 12(a). Polymer flooding can reduce the mobility ratio effectively due to the high viscosity of the polymer, so that it increasing the swept volume and decreases the remaining oil by spreading it into the small pores, as shown in Fig. 12(b). Compared with polymer flooding and water flooding, combination flooding (dispersed low-elastic microsphere system) performs better in oil displacement, because the microspheres can effectively block the large pores and make the liquid flow change direction, which means it can be spread to the low permeability zone better, as shown in Fig. 12(c).
According to the definition of oil-displacement efficiency, the microscopic oil-displacement efficiency ER can be expressed as:
 | (4) |
The auxiliary line and area method were used to quantitatively characterize the oil-displacement efficiency after different flooding simulations. According eqn (4), we calculated the microscopic oil-displacement efficiency after water flooding and polymer flooding as 51.82% and 69.37%, while the microscopic oil-displacement efficiency after combination flooding was up to 91.24%. By comparing the distribution of the remaining oil and the microscopic oil-displacement efficiency after different flooding simulation, we can see the effect of oil displacement, whereby: combination flooding > polymer flooding > water flooding.
Analyzing the microscopic oil-displacement data, which was obtained in microscopic visualization oil-displacement experiments, allowed us to summarize the flooding mechanism of the dispersed low-elastic microsphere system by the following aspects: (1) selective blocking mechanism; (2) deep flow steering mechanism; (3) microsphere elastic deformation flooding mechanism; (4) mechanism of polymer flooding.
(1) Selective blocking mechanism. In the microscopic model, a water channel can form after water flooding. This has a low flow resistance, so that when the dispersed low-elastic microsphere system is injected, it is easier to migrate into these large pores. Low-elastic microspheres fill the large pores and rarely enter the small pores, increasing the flow resistance of the large pores and blocking the high permeability zone effectively, thus reducing the permeability.
(2) Deep flow steering mechanism. After entering the large pores, the dispersed low-elastic microsphere system can migrate forward given the larger injection pressure differential. It can pass through directly when the size of the low-elastic microsphere is smaller than the large pore diameter. When the particle size of the low-elastic microsphere is greater than the pore diameter, it can be deformed or cut off at a sufficient pressure, and then it will continue to migrate to the deep zone. After the deep formation pressure differential decreases, the smaller microspheres are adsorbed on the pore. It is possible to generate additional flow resistance of the fluid by changing the flow line, so that it spreads the formation better, as shown in Fig. 11(c) and (d). As for the larger size particles, the reduced pressure difference with the deep reservoir is not enough to push through the low-elastic microspheres through the smaller pores, which will block the large pores, thereby reducing the permeability, and then the liquid flow will turn into low permeability formations, increasing the spread area and enhancing the oil recovery, as shown in Fig. 11(b).
(3) Deformation displacement mechanism. When the particle size of the low-elastic microspheres was larger than the pore diameter, the low-elastic microspheres deformed into the pores elastically under the effect of fluid force and the microspheres were stretched. After passing through the pores, the action of squeezing and stretching from the pore disappears and the microspheres expand to their normal size in the process of shape restoration, and then migrate to the remaining oil zone that could not be swept before to push them out, as shown in Fig. 11(c).
(4) Mechanism of polymer flooding. The dispersed low-elastic microsphere system with good shear-thickening ability can effectively decrease the water-oil mobility ratio in the progress of flooding and enhance the sweep efficiency. Due to the solvation and hydrolysis of the polymer in the combination system, the molecules entangled in the water can form a random coil. As a viscoelastic solution, the polymer solution can be stretched due to the structure of the pores when passing through the pore throat, and then re-curled when the stretching effect disappears. During this process, the polymer molecules can strip the residual oil in the pore throat.
From the research into the micro-migration mechanism and oil-displacement mechanism of the dispersed polymer microsphere system, we know that the micro-migration mechanism of polymer microspheres with different storage moduli is the integrative reflections of different transport behaviors. However, the transport behaviors of high elastic microspheres are mainly broken up by passing through blockages and by direct passing through. Because of the fragility of the swollen high elastic microspheres, deformable passing through and partition passing through are hard to find in the transport behaviors of high elastic microspheres. Also, the deformation displacement mechanism is not obvious during the oil displacement of high elastic microspheres. Thus, the dispersed low-elastic microsphere system shows good application prospects in the profile control and oil displacement of heterogeneous reservoirs.
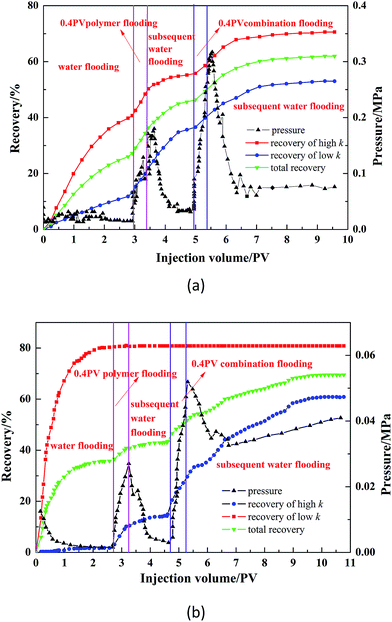
3.5.2.2 EOR capacity evaluation. The oil recovery and injection pressure of two parallel-sandpacks tests with different permeability contrasts are plotted as a function of injection volume in Fig. 13. Both of the diagrams in Fig. 13 have three curves, representing the oil recovery of high permeability sandpack (red curve), the oil recovery of low permeability sandpack (blue curve), and the total oil recovery (green curve), respectively. Another curve is the injection pressure curve (black line). The oil recovery covered all five displacement stages: initial water flooding, 0.4 PV polymer flooding, subsequent water flooding, 0.4 PV combination flooding, and subsequent water flooding.
The results of the two tests showed that the oil recovery of high permeability sandpacks was higher than those of low permeability sandpacks. The results also showed that this difference increases with the increase in permeability contrast of the two sandpacks. When the permeability contrast was 3 in Fig. 13(a), water flooding recovered 40.70% of the initial oil in place (IOIP) of the high permeability sandpack and 13.26% IOIP of the low permeability sandpack. When the permeability contrast of the two sandpacks was increased to 20.4, the oil recovery of the high permeability sandpack was about 80.83%, compared with 1.75% for the low permeability sandpack. This means that a high permeability contrast will result in high remaining oil saturation in the low permeability sandpack. The trends of the recovery curves at the end of initial water flooding showed that oil recovery in the low permeability sandpack would not catch up with the oil recovery of the high permeability pack by simply applying water flooding. Although polymer flooding was conducted, the poor oil-displacement effect was not improved so much.
The injection purpose of combination flooding was to improve the sweep efficiency of parallel sandpacks. The oil recovery curves of the two diagrams in Fig. 13 show that both recovery curves increased during the combination flooding, with the curve of the low permeability sandpack increasing much faster than that of the high permeability sandpack, indicating that the injected dispersed low-elastic microsphere system could divert the major fluid flow from the high permeability sandpack to the low permeability sandpack.
Because the majority of the injected low-elastic microspheres stayed in the high permeability sandpack, the profile control effect could still be reflected during the subsequent water flooding stage. This can be observed in the change in the oil recovery curves of the subsequent water flooding. For Fig. 13(a) and (b), with a 0.4 PV dispersed low-elastic microsphere system injection and subsequent water flooding, the cumulative oil recoveries in the low permeability sandpack were 52.99% and 60.85% IOIP, respectively, which was even slightly higher than the cumulative oil recoveries in the high permeability packs: 70.58% and 80.83% IOIP for Fig. 13(a) and (b). It should be noted that the final oil recovery in the low permeability sandpack was very close to, but still a little bit lower than, that of the high permeability sandpack. The injection pressure curve showed that the injected low-elastic microsphere system could be forced into the high permeability sandpack, resulting in a relatively high flow resistance to the injection fluid in it.
The results presented in the last two columns of Table 2 show that the incremental recoveries by the dispersed low-elastic microsphere system from the low permeability packs are larger than those from the high permeability packs, especially the permeability contrast of 20.4. The permeability contrasts are 3 and 20.4, respectively. The total incremental recoveries compared with polymer recovery are 16.35% and 26.04%, respectively. These results show that injection of the dispersed low-elastic microsphere system can effectively improve the sweep efficiency and displace more remaining oil in the low permeability zones. For a more heterogeneous model, the effect of the low-elastic microspheres on the sweep efficiency becomes more noticeable. This stems from the fact that the low-elastic microspheres not only increase the viscosity of the water phase, but also divert the flow to the upswept low permeability zones.
| Permeability contrast | Model/×10−3 μm2 | ER after water flooding/% | ER after polymer flooding/% | ER after combination flooding/% | ΔER compared with water flooding/% | ΔER compared with polymer flooding/% |
|---|---|---|---|---|---|---|
| 3 | Low k (383.7) | 13.26 | 35.65 | 52.99 | 39.73 | 17.34 |
| High k (1138.1) | 40.70 | 55.20 | 70.58 | 29.88 | 15.38 | |
| Total | 27.26 | 45.60 | 61.95 | 34.69 | 16.35 | |
| 20.4 | Low k (1100) | 1.75 | 14.93 | 60.85 | 59.1 | 45.92 |
High k (22![[thin space (1/6-em)]](https://www.rsc.org/images/entities/char_2009.gif) 400) 400) |
80.83 | 80.83 | 80.83 | 0 | 0 | |
| Total | 35.99 | 43.46 | 69.50 | 33.51 | 26.04 |
4. Conclusions
In this study, a novel dispersed low-elastic microspheres system for enhanced oil recovery in heterogeneous reservoirs was proposed. Laboratory experiments were conducted to understand the stability, rheological property, and oil-displacement mechanism of dispersed low-elastic microspheres. The major conclusions that can be drawn from this study are as follows:(1) The dispersed low-elastic system, which is formed by low-elastic microspheres and polymers, has good stability and exhibits a characteristic “shear-thickening” behavior. The stability of the dispersed system is influenced by many factors. The higher the concentration of the polymer is, the more stable the system is, with the optimal system being composed of 0.1% low-elastic microspheres and 0.1% polymer HPAM. In the weak alkaline environment, the higher the temperature is, the more stable the system is. The “shear-thickening” behavior of dispersed low-elastic microspheres system was the result of the microstructure change and the internal forces of the dispersed system.
(2) The low-elastic microspheres have good deformability in porous media. Microscopic displacement experiments showed that the transport behaviors of low-elastic microspheres in porous media are deformable passing through, partition passing through, blockage, adhesion and direct passing through, respectively. The EOR results in the micromodel test and in the parallel-sandpacks test show that the injection of the dispersed low-elastic microspheres system can effectively improve the sweep efficiency and recover more residual oil in the low permeability zones. For a larger permeability contrast model, the effect of the dispersed low-elastic microspheres system on the sweep efficiency becomes more noticeable. Thus, the oil-displacement mechanism of the dispersed low-elastic microsphere system can be summarized as follows: selective plugging mechanism, deep flow steering mechanism, deformation displacement mechanism, mechanism of polymer flooding.
Conflict of interest
The authors declare no competing financial interest.Acknowledgements
This research was financially supported by the National Natural Science Foundation of China (21273286, 51574267), the Fundamental Research Funds for the Central Universities (16CX06032A, 15CX08003A), Science Foundation of China University of Petroleum, Beijing (No. 2462015YJRC033) and Qingdao Postdoctoral Application Research Project (No. 2016222).References
- F. L. Zhao, Enhanced Oil Recovery Principles, China University of Petroleum Press, Dongying, PRC, 2000 Search PubMed
.
- H. Q. Liu and H. L. Zhang, Pet. Sci., 2006, 3, 51 Search PubMed
.
- R. B. Needham, C. B. Threlkeld and J. W. Gall, SPE4747 presented at SPE Improved Oil Recovery Symposium, 1974 Search PubMed
.
- A. M. Araghi, J. Pet. Sci. Eng., 2000, 26, 1 CrossRef
.
- D. Perez, F. E. Fragachan, A. Ramirez and J. P. Ferraud, SPE37622 presented at Drilling Conference, 2001 Search PubMed
.
- R. S. Seright, R. H. Lane and R. D. Sydansk, SPE70067 presented at Oil and Gas Recovery Conference, 2003 Search PubMed
.
- G. Zhao, C. L. Dai, Q. You, M. W. Zhao and J. H. Zhao, J. Sol-Gel Sci. Technol., 2013, 65, 392 CrossRef CAS
.
- G. Zhao, C. L. Dai, M. W. Zhao and Q. You, J. Appl. Polym. Sci., 2014, 131, 1 Search PubMed
.
- H. Zhang, S. C. Rajesh, B. J. Bai and J. L. Wang, Ind. Eng. Chem. Res., 2010, 49, 12284 CrossRef CAS
.
- B. J. Bai, M. Z. Wei and Y. Z. Liu, SPE 164511 presented at SPE Production and Operations Symposium, 2013 Search PubMed
.
- O. E. Mahmoud and B. J. Bai, SPE 164879 presented EAGE Annual Conference & Exhibition incorporating SPE Europec, 2013 Search PubMed
.
- G. Chauveteau, A. Omari, R. Tabary, M. Renard, J. Veerapen and J. Rose, SPE 64988 presented at SPE International Symposium on Oilfield Chemistry, 2001 Search PubMed
.
- A. Zaitoun, R. Tabary, D. Rousseau, T. R. Pichery and S. Nouyoux, SPE 106042 presented at International Symposium on Oilfield Chemistry, 2007 Search PubMed
.
- S. K. Choi, Y. M. Ermel, S. L. Bryant, C. Huh and M. M. Sharma, SPE 99656 presented at SPE/DOE Symposium on Improved Oil Recovery, 2006 Search PubMed
.
- I. P. Benson, L. X. Nghiem, S. L. Bryant and C. Huh, SPE 109665 presented at SPE Annual Technical Conference and Exhibition, 2007 Search PubMed
.
- J. Pritchett, H. Frampton and J. Brinkman, SPE 84897 presented at SPE International Improved Oil Recovery Conference in Asia Pacific, 2003 Search PubMed
.
- H. Frampton, J. C. Morgan, S. K. Cheung, L. Muson, K. T. Chang and D. Williams, SPE 89391 presented at SPE/DOE Symposium on Improved Oil Recovery, 2004 Search PubMed
.
- B. Bai, F. Huang, Y. Liu, R. S. Seright and Y. Wang, SPE 113997 presented at SPE Symposium on Improved Oil Recovery, 2008 Search PubMed
.
- R. Larkin and P. Creel, SPE 113305 presented at SPE Symposium on Improved Oil Recovery, 2008 Search PubMed
.
- H. Zhang and B. J. Bai, SPE J., 2011, 16, 388 CrossRef CAS
.
- A. Al-Ibadi and F. Civan, SPE 153557 presented in SPE Latin America and Caribbean Petroleum Engineering Conference, 2012 Search PubMed
.
- X. F. Jia, G. L. Lei and X. Y. Jia, Spec. Oil Gas Reservoirs, 2009, 16, 6 Search PubMed
.
- C. J. Yao, G. L. Lei, L. Li and X. M. Gao, J. Appl. Polym. Sci., 2013, 127, 3910 CrossRef CAS
.
- Z. Hua, M. Lin, Z. Dong, M. Li, G. Zhang and J. Yang, J. Colloid Interface Sci., 2014, 424, 67 CrossRef CAS PubMed
.
- P. Li, J. P. Zhang and A. Q. Wang, Macromol. Mater. Eng., 2007, 292, 962 CrossRef CAS
.
- T. Wan, R. Q. Huang, Q. H. Zhao, L. Xiong, L. Luo, X. M. Tan and G. J. Cai, J. Appl. Polym. Sci., 2013, 87, 698 CrossRef
.
- C. J. Yao, G. L. Lei, L. Li and X. M. Gao, Energy Fuels, 2012, 26, 5092 CrossRef CAS
.
- G. L. Lei and J. P. Zheng, J. China Univ. Pet., 2007, 31, 87 CAS
.
- C. Liu, X. Liao, Y. Zhang, C. Mu, T. Li, R. Qin, R. Fu, X. Bie and J. Zheng, SPE 158293 presented at SPE Annual Technical Conference and Exhibition, 2012 Search PubMed
.
- Z. Hua, M. Lin, J. Guo, F. Xu, Z. Li and M. Li, J. Pet. Sci. Eng., 2013, 105, 70 CrossRef CAS
.
- Y. C. Wu, B. Gao, X. Hou and K. D. Yao, Polym. Mater. Sci. Eng., 2008, 24, 13 Search PubMed
.
- N. Azema, Powder Technol., 2006, 165, 133 CrossRef CAS
.
- C. Lemarchand, P. Couvreur, C. Vauthier, D. Costantini and R. Gref, Int. J. Pharm., 2003, 254, 77 CrossRef CAS PubMed
.
- R. Vie, N. Azema, J. C. Quantin, E. Touraud and M. Fouletier, Colloids Surf., A, 2007, 298, 192 CrossRef CAS
.
- Y. F. Ji, W. L. Kang, L. W. Meng, L. L. Hu and H. B. Yang, Colloids Surf., A, 2014, 453, 117 CrossRef CAS
.
- M. Balastre, J. F. Argillier, C. Allain and A. Foissy, Colloids Surf., A, 2002, 211, 145 CrossRef CAS
.
- H. Yang, W. Kang, S. Liu, B. Bai, J. Zhao and B. Zhang, J. Dispersion Sci. Technol., 2015, 36, 1673 CrossRef CAS
.
- H. Yang, W. Kang, Y. Yu, Y. Lu, Z. Li, M. Wang and T. Liu, J. Appl. Polym. Sci., 2015, 132, 42278 Search PubMed
.
- R. L. Hoffmann, J. Rheol., 1998, 42, 111 CrossRef
.
- B. J. Maranzano and N. J. Wagner, J. Chem. Phys., 2002, 117, 10291 CrossRef CAS
.
- H. Watanable, M. L. Yao, K. Osaki, T. Shikata, H. Niwa and Y. Morishima, Rheol. Acta, 1998, 37, 1 CrossRef
.
- B. J. Maranzano and N. J. Wagner, J. Rheol., 2001, 45, 1205 CrossRef CAS
.
| This journal is © The Royal Society of Chemistry 2017 |

