 Open Access Article
Creative Commons Attribution 3.0 Unported Licence
High-efficiency catalytic performance over mesoporous Ni/beta zeolite for the synthesis of quinoline from glycerol and aniline†
An Lia,
Chen Huanga,
Cai-Wu Luoa,
Wen-Jun Yia and
Zi-Sheng Chao *ab
*ab
aCollege of Chemistry and Chemical Engineering, Key Laboratory of Chemometrics & Chemical Biological Sensing Technologies, Ministry of Education, Hunan University, Changsha, 410082, China. E-mail: zschao@yahoo.com; Fax: +86-731-88713257; Tel: +86-731-88713257
bCollege of Materials Science and Engineering, Changsha University of Science & Technology, Changsha, 410114, China
First published on 31st January 2017
Abstract
A green route for the vapor-phase synthesis of quinoline from glycerol and aniline was developed in this work, employing Ni/mesoporous beta zeolite (denoted as Ni/Hβ-At) as a catalyst. The mesoporous beta zeolite was prepared by alkaline treatment. Various influencing factors were systematically investigated. Both mesopores and the type of acid sites of the catalyst played important functions in catalytic activity for the synthesis of quinoline. Mesopores facilitated the transport of bulky products from internal surface of the catalyst. Meanwhile, weak Brønsted acid sites favored the dehydration of glycerol to acrolein and the existence of Lewis acid sites could accelerate the formation of quinoline. The Ni/Hβ-At catalyst exhibited the highest catalytic activity; and as high as a 71.4% yield of quinoline was obtained under the optimized reaction conditions. An enhanced ability of anti-deactivation was also displayed, due to the existence of mesopores on the Ni/Hβ-At catalyst facilitating the transport of bulky products and restraining the deposition of the coke. Meanwhile, it was found that the coke was main reason leading to catalyst deactivation and its performance was basically regenerated. The catalytic properties were slightly lower after 3 reaction–regeneration cycles. Finally, a feasible reaction pathway was proposed on the basis of the various products.
1. Introduction
Quinoline and quinoline derivatives constitute an important category of heterocyclic compounds and are widely used as pharmaceuticals, fungicides, herbicides, corrosion inhibitors and functional chemicals.1–5 However, the traditional liquid-phase routes suffer from several limitations, such as, volatile organic solvents, expensive or toxic feedstocks and complicated recycling of catalysts.6–12 Hence, the development of vapor-phase synthesis is of great interest. Although many vapor-phase syntheses of quinolines have been reported, most of them are not environment-friendly and uneconomical. For instance, saturated/unsaturated aldehydes or acetones reacted with anilines to produce quinolines,13–15 in which, however, aldehydes or ketones are toxic, expensive and prone to polymerization which result in serious catalyst deactivation. The Skraup approach, as a typical quinolines synthetic route,6,16–18 presents more and more potential industrial importance especially via vapor-phase process, due to the utilization of glycerol as green raw material. It is known that glycerol is cheap, abundant, renewable and environment-friendly, and it has been currently manufactured on a large scale as the byproduct of biodiesel process. Whereas, the exceeding output of bio-glycerol has hindered further development of the biodiesel industry.19–21 Efficient utilization of bio-glycerol is of significant necessity. Therefore, the further development of vapor-phase Skraup routes, utilizing bio-glycerol as raw material to manufacture quinolines, is green, sustainable, low-cost pathway and highly desired.To date, different kinds of catalysts, such as, K10, amorphous silica-alumina, mixed metal oxides and zeolites, have been used for vapor-phase synthesis of quinolines.4,13,22,23 However, the above-mentioned catalysts suffer from low catalytic activity and stability or high transport limitation, which limited the further development of quinoline and its derivatives. This is no doubt that the development of a novel and high-performanced catalyst is highly necessitated.
Beta zeolite-based catalysts were effective catalysts for not only the dehydration of glycerol to acrolein but also the generation of quinolines from various raw materials.14,24 The can be attributed to the advantages associated with beta zeolite, such as adjustable acid sites, unique shape selectivity, excellent hydrothermal stability, and especially appropriate pore size matching with quinoline molecule size. Nevertheless, its single micropores impose diffusion limitations and restrict the transport of bulky products (like quinolines) from the active sites in its internal surface. These drawbacks preclude practical applications in synthesis quinolines reactions. One strategy is preparation of beta zeolites with mesopores to facilitate diffusion to the internal active sites. In recent years, mesoporous structured beta zeolites, which has advantages of both micropores and mesopores, have been considerably used in various bulky molecular reactions, such as, conversion of synthesis gas to C5–C11 isoparaffins, isomerization of α-pinene or glucose, alkylation of benzene with isopropanol to cumene, benzoylation of naphthalene and desulfurization.25–30 They exhibited superior catalytic performance than the single microporous beta zeolite-base catalysts. For example, 100% conversion of α-pinene with 85.4% selectivity of desired products was achieved by mesoporous beta catalyst, whereas only 20.3% conversion was obtained by the single microporous beta catalyst under the same reaction conditions. The mesoporous structured beta zeolite can be achieved in various methods, such as by post-synthesis treatment, by using surfactants as soft templates or crystallization of amorphous aluminosilicates deposited onto hard templates.28–32 Among these methods, the alkaline post-treatment have been proved to improve the porosity of beta zeolite via selective extraction of silicon atoms from the framework without distinct change of the acidity and crystallinity. Moreover, this method is more simple, feasible and effective methods, which can be suitable for mass production without the complicated synthesis procedures and the employment of expensive templates. However, to the best of our knowledge, mesoporous beta catalysts have never been reported in the application of vapor-phase synthesis of quinolines.
In this work, we reported a green and economic route for vapor-phase synthesis of quinoline from glycerol and aniline, for the first time, using modified mesoporous beta zeolite as catalyst. Under the optimized conditions, as high as 71.3% yield of quinoline was obtained over the Ni/Hβ-At catalyst. The relationship between the structure and the performance of catalyst was discussed in detail. A feasible reaction pathway was proposed on the basis of various products.
2. Experimental
2.1. Chemicals
All the chemicals of analytic purity were commercially available and provided as follows: aniline, glycerol and ethanol (A.R., Sinopharm Chemical Reagent Co., Ltd.); nickel nitrate, sodium hydroxide and urea (A.R., Xilong Chemical Co., Ltd.). Besides, beta zeolite (Hβ, Si/Al = 25; Nankai University Catalyst Factory) was calcined at 550 °C for 4 h to remove the absorbed water and any residual organics prior to used directly as the catalyst and in the subsequent process of other catalysts.2.2. Catalyst preparation
All the above-described catalysts were first pressed into disks, crushed, and sieved to 30–40 mesh before use.
2.3. Catalysts characterization
X-ray diffraction (XRD) was performed with a Bruker D8-Advance X-ray diffractometer, under the following conditions: Cu target Kα ray (λ = 1.54187 Å); scanning voltage 40 kV, scanning current 40 mA; scanning speed 0.2 s, scanning step 0.02°.Fourier transform infrared (FT-IR) spectroscopy was recorded on a Varian 3100 spectrometer equipped with a DTGS detector. The catalyst was first mixed with KBr (the weight ratio of catalyst/KBr = 1/100) by thoroughly grounding, and then, the mixture was pressed into the sample holder and mounted in the detection chamber of the spectrometer, before the FT-IR determination. The data was recorded at a scanning number of 32 and a resolution of 2 cm−1.
N2-physisorption was conducted on a Quantachrome Autosorb-1 instrument at liquid-N2 temperature. Before measurement, the specimen was in situ outgassed in the instrument at 300 °C for 12 h under a vacuum of 10−8 Torr. The specific surface area was calculated by using the multipoint BET equation, with the correlation coefficient being above 0.9999. The micropore area and volume were estimated by the “t-plot” micropore analysis method. The total pore volume was calculated at relative pressure of P/P0 = 0.99, assuming full surface coverage with nitrogen. The pore size distribution was determined by the BJH model employing desorption isotherm.
Temperature programmed desorption of NH3 (NH3-TPD) was determined on a Micromeritics Autochem II 2920 instrument equipped with a thermal conductivity detector (TCD). The catalyst was first pretreated at 400 °C for 30 min in a flow of helium (99.99%) with a flow rate of 60 mL min−1, followed by cooling to 100 °C. Then, ammonia was repeatedly pulse-injected in a stream of 10% NH3/He with a flow rate of 50 mL min−1 until its saturation adsorption over the catalyst had been achieved. After purging with helium at 100 °C for 1.0 h, ammonia was desorbed by heated the catalyst from 100 °C to 800 °C at a rate of 10 °C min−1.
Thermogravimetry (TG) profiles were recorded on a Diamond instrument (Perkin Elmer Corp.). The catalyst was heated from room temperature to 800 °C in an air stream at a heating rate of 5 °C min−1. The flow rate of air was 30 mL min−1.
2.4. Catalytic performance evaluation
Catalytic performance test was carried out in a fixed-bed stainless steel reactor (i.d. 8 mm) under atmospheric pressure at suitable reaction temperature. The reaction equipment for vapor-phase synthesis of quinoline was homemade and its schematic diagram was shown in Fig. S1.† The typical operated procedures of catalyst evaluation were as follow: initially, the flows of glycerol aqueous solution and nitrogen (10 mL min−1) were mixed in preheater at 260 °C; similarly, the flows of aniline and nitrogen (10 mL min−1) were mixed in another preheater at 260 °C. Then, the vaporized aniline and glycerol aqueous solution were respectively fed into the reactor via the carried gas of nitrogen, and subsequently mixed on the top of catalyst bed and reacted on the catalyst at suitable reaction temperature. The liquid product mixtures were first diluted with ethanol, passing through a connecting tube enwrapped with thermal insulation jacket, and then introduced into the condenser for the separation and collection of gas and liquid product mixtures.The liquid products mixtures was analyzed by a Varian Saturn 2200/CP-3800 gas chromatography-mass spectrometry (GC-MS) equipped with two CP8944 capillary columns (VF-5, 30 m × 0.25 mm × 0.25 μm), which were connected to a mass detector and a flame ionization detector (FID) for the quantitative and qualitative identifications, respectively. The gas product mixtures were also conducted on a on a PE Clarus500 GC instrument equipped with a thermal conductivity detector (TCD) and a HAYESEP DB 100/120 packed column (30 ft × 1/8 in. × 0.85 in. SS). In the qualitative analysis of liquid products mixture, 3-nitrotoluene was added as internal standard. The yield of quinoline was calculated based on the converted aniline.
| Yield (mol%) = conversion × selectivity × % |
3. Results and discussion
3.1. Catalyst characterization
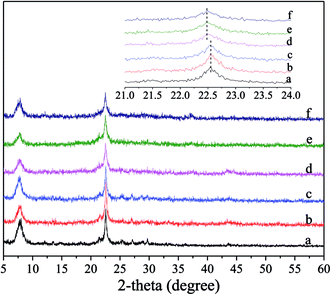
Fig. 1 shows the XRD patterns for the fresh and deactivated catalysts, in which the content of Ni supported on Ni/Hβ and Ni/Hβ-At catalysts is ca. 10 wt%. For the fresh catalysts, all the XRD patterns are characteristic of Hβ zeolite and contain no diffraction peaks of Ni species for Ni-containing catalysts, implying that the original structure of Hβ zeolite is retained well after alkali treatment and that Ni species are highly dispersed on Hβ zeolite with very small dimension. Ha and Hong et al.33,34 showed that zeolites containing fewer framework Al atoms per unit cell showed a slight contraction in each cell parameter relative to low Si/Al ratio zeolites. Aouali et al.35 found that the removal of silicon from the zeolites framework resulted in an increase of the unit cell parameters since the framework Si/Al ratio was decreased. Thus, the desilication and dealumination would theoretically cause the expansion and contraction of zeolite framework, respectively. As a result, the characteristic peak would shift slightly toward lower or higher angle.36,37 Based on the enlargement of the predominant peaks in the XRD patterns, the diffraction peaks over Hβ-At and Ni/Hβ-At catalysts shift towards a lower angle, relative to that of the parent Hβ one. It indicates that the expansion of the Hβ zeolite framework have occurred for the Hβ-At and Ni/Hβ-At catalysts. This result confirms that desilication has occurred during the alkali treatment to the parent Hβ zeolite. The diffraction intensity of the fresh catalysts shows an order of Hβ = Ni/Hβ > Hβ-At = Ni/Hβ-At. This trend occurs because the framework of zeolite is destructed to a certain extent after alkali treatment. Furthermore, for the deactivated catalysts, their diffraction intensities have almost no decrease relative to their corresponding fresh catalysts; thus, the framework structure of Ni/Hβ and Ni/Hβ-At catalysts are considerably stable and difficult to be destructed at high reaction temperature.Fig. 2 shows the FT-IR spectra of the fresh and deactivated catalysts. For the fresh catalysts, all the spectra exhibit the characteristic vibrations of beta zeolite framework. The bands at ca. 1225, 1087 and 797 cm−1 are characteristic of SiO4 tetrahedron units and can be assigned to the external asymmetric, internal asymmetric and external symmetric stretching vibrations of Si–O–T linkages for TO4 (T = Si and/or Al) tetrahedral.38–40 The bands at ca. 1225 and 1087 cm−1 reportedly shifted towards lower wavenumbers with decreasing Si/Al ratio of zeolite, due to the slightly lower mass of silicon as compared to that of aluminum.40 The bands at 1225 and 1087 cm−1 have moved to 1222 and 1083 cm−1 for Hβ-At and Ni/Hβ-At catalysts, respectively, relative to parent Hβ one, indicating the decrease in framework Si/Al ratio. The band at 943 cm−1 is sensitive to the framework Si/Al ratio and its intensity decreases when framework desilication occurs.41–43 It can be seen that the band intensity at 943 cm−1 slightly decreases for the Hβ-At and Ni/Hβ-At catalysts compared with those of the Hβ and Ni/Hβ ones. The results further confirm the deduction from the above XRD characterization that alkali treatment to Hβ zeolite leads to desilication. Besides, the bands at ca. 568 and 524 cm−1 are typical characteristic for beta zeolite,43,44 which are presumably assigned to the double six-ring (D6R) and double four-ring (D4R) lattice vibrations of external linkage.45,46 The band at ca. 460 cm−1 can be attributed to the internal T–O bending vibration of TO4 tetrahedron.47 Furthermore, for the deactivated catalysts, the whole-band intensity decreases, to varying extent, particularly at ca. 568 and 524 cm−1. The phenomenon is consistent with the report that the whole-band intensity in FT-IR spectra of ZnO-FHZSM-5-At-acid catalyst decreases obviously after deactivation.48 The decrease is presumably attributed to the deposition of the coking on the surface of catalyst. Particularly, the drastic decrease of intensity at ca. 568 and 524 cm−1 may be due to the interaction between the coking located in micropore with the nearby double-ring structure of zeolite.
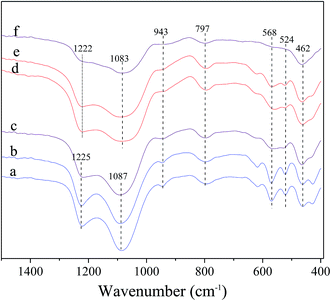 | ||
| Fig. 2 FT-IR spectra of the fresh and deactivated catalysts. (a) Hβ; (b) Ni/Hβ; (c) deactivated Ni/Hβ; (d) Hβ-At; (e) Ni/Hβ-At; (f) deactivated Hβ-At. | ||
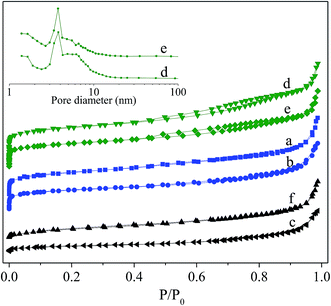
Fig. 3 shows N2-adsorption/desorption isotherm for the fresh and deactivated catalysts and corresponding pore size distributions analyzed by BJH method employing desorption isotherm. For the fresh catalysts, the isotherms rise steeply at extremely low relative pressure, showing for the existence of microporous. A pronounced hysteresis loop at P/P0 > 0.4 is present for Hβ-At and Ni/Hβ-At but almost absence for the Hβ and Ni/Hβ, inferring that alkaline treatment to the parent Hβ successfully generates mesopores. This occurrence is due to the removal of silicon species from the external framework of the parent Hβ zeolite to generate mesopores to a certain extent during alkaline treatment. For the deactivated Ni/Hβ and Ni/Hβ-At catalysts, a notable difference can be noted that their isotherm maintains a flat rising trend at low relative pressure and the hysteresis loop at P/P0 > 0.4 disappeared completely relative to those for corresponding fresh ones. These results indicate that the microporous and mesoporous of the deactivated catalysts have almost disappeared.
The detailed textural properties of various catalysts are listed in Table 1. Compared to the pure Hβ, the Hβ-At possesses a larger Vmeso, Vtotal and Sext, but smaller Vmic, Smic and SBET. This is due to the fact that the desilication resulted in generating the extra-framework species, thereby, blocking or covering the pore structure. When the Ni species is supported on the Hβ and Hβ-At respectively, their textural values, including Vmeso, Vmic, Vtotal, Sext, Smic, SBET, as well as Dmic, decrease to different degree. For the deactivated Ni/Hβ and Ni/Hβ-At catalysts, SBET and Vtotal decrease sharply, relative to the fresh ones. Meanwhile, their micropores disappear completely. The variation is possible due to blocking mesopores and micropores by coking substances with prolonging to the reaction time.
| Catalysts | SBET (m2 g−1) | Sext (m2 g−1) | Smic (m2 g−1) | Vtotal (cm3 g−1) | Vmic (cm3 g−1) | Vmeso (cm3 g−1) | Dmic (nm) | Dmes (nm) |
|---|---|---|---|---|---|---|---|---|
| a Note: SBET, Sext and Smic refers to specific surface area, external surface area and micropore surface area, respectively, and SBET = Sext + Smic; Vtotal and Vmic refers to total pore volume and micropore volume, respectively; Dmic refers to micropore pore size calculated by the SF method; Dmes refers to average mesopore pore size calculated by the BJH method; the pure Hβ and Ni/Hβ are inapplicable in the estimation of average mesopore size by the BJH method due to its microporous characteristic. DERefers to the catalyst deactivation after reacting for 6 h. | ||||||||
| Hβ | 483.7 | 168.2 | 315.5 | 0.40 | 0.15 | 0.25 | 0.61 | — |
| Hβ-At | 419.0 | 227.0 | 193.0 | 0.51 | 0.11 | 0.40 | 0.61 | 4.81 |
| Ni/Hβ | 389.7 | 107.8 | 281.9 | 0.39 | 0.15 | 0.24 | 0.60 | — |
| Ni/Hβ-At | 339.4 | 189.2 | 150.2 | 0.48 | 0.09 | 0.39 | 0.59 | 4.76 |
| Ni/HβDE | 53.6 | 53.6 | 0 | 0.09 | 0 | 0.09 | ||
| Ni/Hβ-AtDE | 65.1 | 65.1 | 0 | 0.18 | 0 | 0.18 | — | — |
Fig. 4 shows the NH3-TPD profiles for the fresh and deactivated catalysts. For the fresh catalyst, the T1 peak at ca. 142 °C is present for all catalysts and assigned to weak acid sites relating to the terminal acid silanol groups.24,49 The T2 peak at ca. 277 °C is identified evidently over Hβ and Hβ-At but virtually absent over Ni/Hβ and Ni/Hβ-At; which can be ascribed to strong Brønsted acid sites relating to the bridging Si–(OH)–Al groups. The T3 peak at ca. 448 °C is highly distinct over Ni/Hβ and Ni/Hβ-At; by contrast, the peak is absent over Hβ and Hβ-At. This peak is attributed to Lewis acid sites deriving from Ni attached to Hβ zeolite with certain interactions. For the deactivated Ni/Hβ-At catalyst, two peaks containing the weak peak (T1) at ca. 142 °C and the broad peak (T4) at the range of 430–580 °C are present. The former peak belongs to the residual weak acid sites. The latter one is presumably related to the signal of the coking at the high desorbed temperature, because the T4 peak disappears and the T3 reoccurs after regeneration of the deactivated Ni/Hβ-At catalyst.
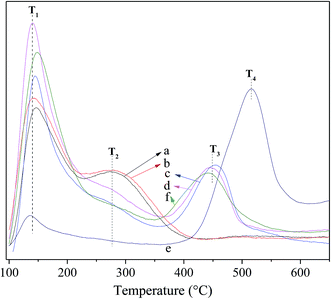 | ||
| Fig. 4 NH3-TPD profiles for the fresh and deactivated catalysts. (a) Hβ; (b) Hβ-At; (c) Ni/Hβ; (d) Ni/Hβ-At; (e) deactivated Ni/Hβ-At; (f) regenerated Ni/Hβ-At. | ||
Table 2 summarizes the strength and concentration of acid sites, which corresponds respectively to the temperature at the maximum (Ti) and integral area (Ai) of the peaks. After alkaline treatment, the resulting Hβ-At shows increase slightly in concentrations of strong acid sites and change neglectable in that of strong Brønsted acid sites, relative to the parent Hβ. This increase is due to the fact that alkaline treatment leads to desilication; and as a result, more terminal acid silanol groups are formed. When Ni is supported on Hβ and Hβ-At, respectively, concentration of weak acid sites increases and that of strong Brønsted acid sites almost disappears over Ni/Hβ and Ni/Hβ-At. This is due to that Ni species attaching on zeolite create Lewis acid sites, and meanwhile Ni-exchange to protons of bridging Si–(OH)–Al groups partially result in a distinct decrease in strong Brønsted acid sites. Furthermore, the concentration of weak acid sites increases after the addition of Ni to Hβ or Hβ-At. This occurs probably due that some Ni species dispersed on zeolite generate metal hydrate cation Ni(H2O)n2+ due to the electrostatic field of metal cations.50,51 Subsequently, the splitting of water molecule occurs to form Ni(OH)+; and as a result, new Brønsted acid sites form from this process, as shown in eqn (1) and (2).
| Ni2+ + H2O → Ni(H2O)n2+ | (1) |
| Ni(H2O)n2+ → NiOH+ + H+ | (2) |
| Catalyst | Tia (°C) and Aib (mmol g−1) for various desorption peaks | ||||||
|---|---|---|---|---|---|---|---|
| T1 | A1 | T2 | A2 | T3 | A3 | Atotal | |
| a Ti refers to the temperature at the maximum of desorption peak i.b Ai refers to the integral area of desorption peak i, and it means also the concentration of acid site corresponding to the desorption peak i; Atotal stands for the sum of the concentration of various acid site, i.e., Atotal = ∑Ai. DERefers to the catalyst deactivation after reacting for 6 h. RGRefers to the regeneration for the deactivated catalyst. | |||||||
| Hβ | 146.0 | 0.86 | 277.2 | 0.16 | — | — | 1.02 |
| Hβ-At | 141.2 | 0.91 | 277.2 | 0.18 | — | — | 1.09 |
| Ni/Hβ | 145.0 | 0.91 | 277.2 | 0.03 | 454.0 | 0.38 | 1.32 |
| Ni/Hβ-At | 140.7 | 1.21 | 277.2 | 0.03 | 443.3 | 0.27 | 1.51 |
| Ni/Hβ-AtDE | 135.8 | 0.19 | — | — | — | — | 0.19 |
| Ni/Hβ-AtRG | 148.0 | 1.12 | 277.2 | 0.01 | 443.4 | 0.26 | 1.39 |
These new Brønsted acid sites should be related to weak Brønsted acid sites, according to the study of Guzman et al.52 Therefore, the addition of Ni species to zeolite increases both Lewis acid sites and weak acid sites. For deactivated Ni/Hβ-At catalyst, concentration of original weak acid sites decreases distinctly and that of Lewis acid sites almost disappear. The result may be due that the substances cover acid sites and subsequently block all micropores and some mesopores with increasing reaction time. This finding can be confirmed by the above N2 adsorption–desorption, because the specific surface area remains just 65.1 m2 g−1 and microporous surface area entirely disappears for deactivated Ni/Hβ-At catalyst. Moreover, microporous volume indeed disappears and mesoporous volume decreases distinctly from 0.39 to 0.18 cm3 g−1. After regeneration of deactivated Ni/Hβ-At catalyst at 550 °C for 4 h in air atmosphere, the concentration and strength of original weak acid sites and Lewis acid sites almost recover, whereas that of the additional acid sites (T4) disappears. Meanwhile, the regenerated Ni/Hβ-At shows virtually high catalytic activity similar to that of fresh Ni/Hβ-At (see Fig. 8(II)). Thus, the results indicate that catalyst deactivation originates by the deposition of coking substances rather than structure damage of the catalyst.
3.2. Catalytic performance evaluation
Table 3 shows catalytic performance of various catalysts for vapor-phase synthesis of quinoline from aniline and glycerol. Meanwhile, the productivity of quinoline in terms of weight time yield also displays in Table S1.† When Hβ and Hβ-At are employed as catalyst, respectively, aniline conversion, quinoline selectivity and yield increase over Hβ-At relative to that over Hβ. This enhanced catalytic activity over the Hβ-At is mainly attributed to the existence of mesopores facilitating diffusion of bulky products (such as quinoline) from internal surface of catalyst. When Ni species are supported on Hβ or Hβ-At, quinoline selectivity and yield increase distinctly over Ni/Hβ or Ni/Hβ-At, respectively. It is known that the addition of Ni to zeolite not only generates Lewis acid sites but also eliminates strong Brønsted acid sites, as shown by the above characterization results. It indicates Lewis acid sites are preferable active sites on quinoline selectivity over the strong Brønsted acid sites. This occurs probably due that side reactions (such as acrolein polymerization) are readily occurred over strong Brønsted acid sites while the aromatization process (Scheme 1) could be accelerated via the synergistic effect of Lewis acid sites (Ni as acid center) and acid–base sites.53 In addition, the valuable byproducts of alkylquinolines (including 2- and 4-methylquinoline) and 3-methylindole are also produced. Considering that we entered single starting material of glycerol into the reactor under standard operating condition, intermediate products (including 3-hydroxypropanal, acrolein, hydroxyacetone and acetaldehyde) were well-detected by mass spectrum analysis. Thus, it infers that those byproducts are generated from different intermediates reacting with aniline. For instance, 2- and 4-methylquinoline may be synthesized from aniline and acetaldehyde.14 3-Methylindole may originate from the reaction of aniline and hydroxyacetone.54 In conclusion, both mesopores and type of acid sites over catalyst play important role in catalytic activity for synthesis of quinoline, and as high as 71.4% yield of quinoline is achieved over the Ni/Hβ-At catalyst.| Catalyst | Aniline conversion (%) | Selectivity (%) | Quinoline yield (%) | |||
|---|---|---|---|---|---|---|
| Quinoline | Alkylquinolinea | 3-Methylindole | Otherb | |||
| a Alkylquinoline: 2- and 4-methylquinoline.b Other: ethylquinoline, diemethylquinoline, indole, ethylaniline, N-ethylaniline, coking and etc. Reaction condition: catalyst weight = 1.0 g; LHSV (aniline) = 0.13 h−1, reaction temperature = 470 °C; molar ratio of aniline/glycerol = 1/4; concentration of glycerol = 20 wt%; TOS = 2 h. | ||||||
| Hβ | 93.3 | 54.2 | 5.4 | 5.0 | 35.4 | 50.6 |
| Ni/Hβ | 95.0 | 64.5 | 6.1 | 2.9 | 26.5 | 61.2 |
| Hβ-At | 97.1 | 57.3 | 5.9 | 5.8 | 31.0 | 55.6 |
| Ni/Hβ-At | 96.0 | 74.3 | 6.8 | 4.3 | 14.6 | 71.4 |
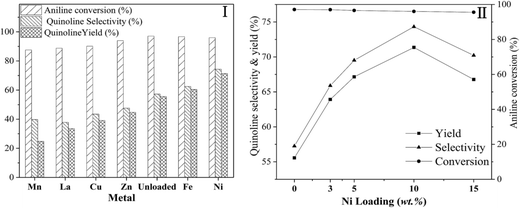
Fig. 5 shows the effect of different metal (I) and the loading amount of Ni (II) supported on Hβ-At, with the loading amount of different metal (I) supported on Hβ-At of 10 wt%.
(1) Different metal. Quinoline yield over these catalysts containing metal species shows an order Ni > Fe > Zn > Cu > La > Mn. Among all the catalysts, the introduction of Mn, La, Cu and Zn to Hβ-At, to varying extent, decreases quinoline selectivity and yield in this reaction relative to the parent Hβ-at catalyst. On the contrary, quinoline yield over Ni/Hβ-at and Fe/Hβ-At are higher than that of Hβ-At, with the highest quinoline yield obtained over Ni/Hβ-At. As active component in catalysts, nickel is widely applied in hydrogenation/dehydrogenation reaction.55–58 For instance, Liang et al. proposed that dehydrogenation could be accelerated via the synergistic effect of Ni active species and acid–base sites.58 Moreover, some researchers thought that the cooperation of Lewis acid sites (Ni as the acid center) and Brønsted acid sites over the Ni/HZSM-5 catalyst contributes to the aromatization process.53 Therefore, according to the reaction mechanism on synthesis quinoline from aniline and glycerol (Scheme 1), the addition of Ni on Hβ-At could contribute to aromatization process and particularly enhance the dehydrogenation process from 1,2-dihydrogenquinoline to quinoline. As a result, the yield of quinoline increases evidently over the Ni/Hβ-At catalyst.
(2) Loading amount of Ni. Aniline conversion change little with increasing Ni loading weight from 0 wt% to 15 wt%. By contrast, quinoline selectivity and yield first increase and then decrease gradually, reaching to their largest values at 10 wt% Ni loading weight. It indicates that an appropriate amount of Ni species attached on zeolite can increase quinoline yield effectively.
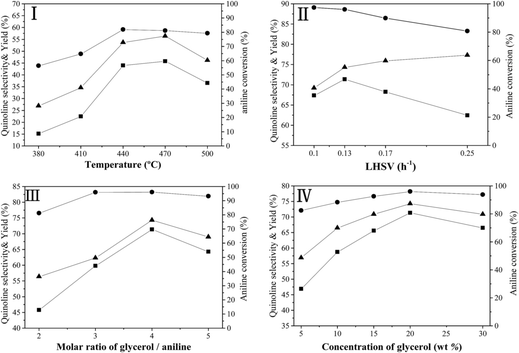
Fig. 6 illustrates the effect of reaction conditions for vapor-phase synthesis of quinoline over the Ni/Hβ-At catalyst, including temperature (I), liquid hourly space velocity (LHSV) of aniline (II), molar ratio of glycerol/aniline (III) and concentration of glycerol (IV). These reactions have been conducted according to a procedure of condition gradual optimization, which is described as follows: initially, the temperature is varied to achieve its optimized value while maintaining the others conditions constant; then, the LHSV, molar ratio of glycerol/aniline and concentration of glycerol are sequentially optimized by replacing the other conditions with their optimized values. The above effect of reaction conditions can be interpreted as follows:
(1) Reaction temperature. On one hand, aniline conversion is ca. 56% at 320 °C. With the increase of temperature, aniline conversion increase rapidly, reaching ca. 81% as its maximum at 440 °C, and then decreases slightly. On the other hand, quinoline selectivity and yield first increase with the elevation of temperature, achieving ca. 56% and 46%, respectively, as their maximums at 470 °C, and then decreases evidently. This occurs due that generation of quinoline requires two steps from glycerol and aniline, as shown by eqn (3) and (4).
 | (3) |
 | (4) |
First, the dehydration of glycerol generates intermediate acrolein; then, acrolein further reacts with aniline to yield quinoline.23 According to the previous literatures, relative low reaction temperature at approximately 280 °C to 350 °C favors glycerol dehydration to acrolein,59,60 whereas high reaction temperature about 400 °C to 500 °C is preferred for the generation of quinoline.14,23 Thus, a relatively low reaction temperature promotes the former step but restricts the latter one. As a result, low aniline conversion and quinoline selectivity are obtained at low reaction temperature. However, at excessively higher reaction temperature (beyond 500 °C), the concentration of acrolein decreases distinctly and then further restrain quinoline yield. In conclusion, the reaction temperature profoundly affects quinoline selectivity and yield, and the optimized reaction temperature is 470 °C in this reaction.
(2) LHSV of aniline. With the increase of LHSV, quinoline yield increases, reaching the highest value at the LHSV = 0.13 h−1, and then decreases. The residence time of the reactants on the catalyst decreases with the elevation of LHSV. If the LHSV is lower, the residence of reactants on surface of catalyst becomes longer, and then the reaction is conducted more completely. However, more side reactions also occur because the long staying of intermediate acrolein on the surface of catalyst increases the chances of acrolein polymerization to generate coking substance, which can block pore channel of catalyst and further restrain the effective diffusion of bulky products from catalyst surface. Therefore, although aniline conversion increases, quinoline selectivity decreases, further reducing quinoline yield. If the LHSV is too higher, the contact time between the reactants and catalyst is shorter, indicating that active sites of catalyst cannot perform more effectively catalytic function in this reaction, due to hurried movement of the reactants from catalyst surface. Accordingly, the increase of LHSV value promotes quinoline yield; however, an excessively high LHSV value exerts a negative influence on quinoline yield.
(3) Molar ratio of glycerol/aniline. With the increase of the molar ratio of glycerol/aniline from 2 to 4, aniline conversion increases from ca. 81% to 96%, arriving to its maximum, and then decrease slightly. Quinoline selectivity and yield exhibit a similar tendency relative to aniline conversion. This phenomenon is due accompanied generation of other intermediate compounds (such as, hydroxyacetone, 3-hydroxypropionaldehyde and acetaldehyde) during glycerol dehydration. On one hand, either acrolein itself or acrolein with other intermediates suffers from polymerization to generate the coking substances at high reaction temperature. On the other hand, other active intermediates besides acrolein also participate in the reaction with aniline to generate other heterocyclic aromatic compounds, such as alkylquinolines and alkylindole. Accordingly, the increase in the molar ratio of glycerol/aniline increases the concentration of generated acrolein, and in turn, that of the quinoline, arriving to its maximum yield at the molar ratio of glycerol/aniline = 4. Whereas the molar ratio of glycerol/aniline exceeds 4, an excessively high concentration of generated acrolein may lead to a larger extent of the side reactions in acrolein polymerization or/and its copolymerization with other active intermediate compounds. Thus, an optimized molar of glycerol/aniline (=4) was obtained in our reaction.
(4) Concentration of glycerol. With the increase of glycerol concentration, aniline conversion, quinoline selectivity and yield increase evidently, reaching to their largest values at 20 wt% glycerol aqueous solution, and then, decreases to varying degree. The above results may be due to the increased glycerol concentration increasing the opportunity for contact between aniline and generated acrolein. Therefore, the positive reaction accelerates, and quinoline yield increases. However, at excessively high glycerol concentration (beyond 20%), generated acrolein themselves can accelerate polymerization; and meanwhile, more side reactions between aniline and other intermediate products occur. Thus, quinoline yield decreases at excessively high concentration of glycerol aqueous concentration.
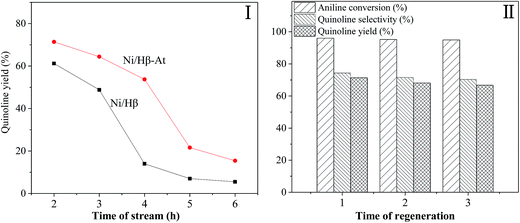
Fig. 7 shows the stability of the Ni/Hβ and Ni/Hβ-At catalysts (I) and the regenerability of Ni/Hβ-At (II).
(1) Stability. For Ni/Hβ-At, quinoline yield is 71.36% at TOS = 2 h, and then decreases generally from 64.39% to 48.71% with prolonging the reaction time from 3 h to 4 h. The decreasing trend accelerates rapidly with further increasing reaction time to 5 h. Finally, 15% yield of quinoline is obtained for the longest reaction time of 6 h employed in this work. In contrast, quinoline yield over Ni/Hβ is 61.22% at TOS = 2 h, and decreases by increasing reaction time to 3 h. With further prolonging reaction time from 3 h to 4 h, quinoline yield decreases violently from 48.81% to 13.98%. Finally, only 6.99% and 5.53% quinoline yields are obtained respectively at TOS = 5 h and 6 h. Therefore, catalytic activity and the life of Ni/Hβ-At are higher than these of Ni/Hβ. The result indicates that Ni/Hβ-At possesses stronger ability of anti-deactivation than the Ni/Hβ. The enhanced ability of anti-deactivation benefits from the existence of mesopores on Ni/Hβ-At, which imposes the transport of bulky products from internal surface of catalyst and restraining the deposition of carbon.
(2) Regenerability of Ni/Hβ-At. Although the serious catalyst deactivation occurs with prolonging reaction time, the catalytic activity of the deactivated Ni/Hβ-At can recover near to that of the fresh one via calcining at 550 °C for 4 h in the presence of air. The result further verifies that catalyst deactivation is reversible deactivation in this reaction, which is caused by deposition of coking substances rather than devastating the structure of catalyst.
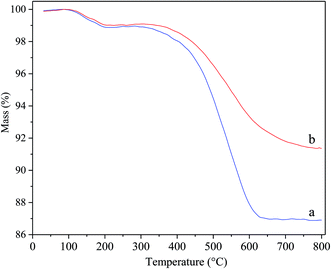
Fig. 8 displays the thermogravimetric profiles over deactivated Ni/Hβ and Ni/Hβ-At. In the recorded profiles, the weight loss prior to 300 °C is attributed to the desorption of water, and the decrease in weight from 300 °C to 800 °C is caused by burning off the coking substances. The rate of weight loss in deactivated Ni/Hβ-At is lower than that in deactivated Ni/Hβ, further implying that the former possesses stronger anti-deactivated ability by imposing the transport of bulky products from internal surface of catalyst and restraining the deposition of carbon due to the existence of mesopores.
Table 4 shows the result about a comparison of the yield of desired quinoline between in this work and those reported in the patents and literatures.13,14,23 One can see that, among various synthetic routes, the yield of quinoline is the highest; and its route is green and economic in this work, relative to other routes utilizing allyl alcohol, acrolein or aldehydes as raw materials. Considering the abundant sources, high yield of quinoline and desired regeneration of catalyst, this green synthetic route developed in this work for synthesis of the desired quinoline, co-employing mesoporous Ni/Hβ-At as catalyst with simple preparation and low cost, presents the potential importance of industrial manufacture.
| Reagents | Catalysts | Yield/% | Ref. |
|---|---|---|---|
| a CH2O: formaldehyde; MeCHO: acetaldehyde.b The yield of 8-methylquinoline referring to the reaction of different reagents with ortho-toluidine. | |||
| Allyl alcohol | Al2O3/SiO2 | 1b | 13 |
| Acrolein | Al2O3/SiO2 | 15b | 13 |
| Acetaldehyde | BEA* zeolite | 16 | 14 |
| CH2O/MeCHOa | Al2O3/SiO2 | 67b | 13 |
| Glycerol | CuO–ZnO/Al2O3 | 65 | 23 |
| Glycerol | Ni/HBeta-At | 71.4 | In this work |
3.3. Reaction mechanism
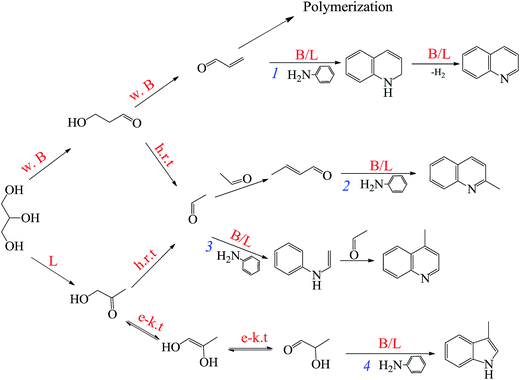
As shown eqn (3) and (4), the generation of quinoline from aniline and glycerol requires two steps, involving glycerol dehydrating to acrolein and subsequent condensation of aniline and acrolein over active sites. Therefore, acrolein generated from glycerol dehydration is essential intermediate during this reaction, and the degree of glycerol to acrolein significantly affects quinoline yield. On one hand, in the former step, the strength and type of acid sites on solid acid catalyst perform a crucial function in formation of intermediate acrolein. For instance, Brønsted acid sites (especially weak/moderately Brønsted acid sites) were effective active and selective sites of acrolein,37,61–64 whereas strong Brønsted acid sites readily result in acrolein polymerization simultaneously.65 Contrarily, Lewis acid sites could catalyze glycerol dehydration to produce hydroxyacetone.61 On the other hand, for the latter step, the addition of Lewis acid sites can effectively promote the formation of quinoline on the basis of the catalytic evaluation (Table 3), probably due to the synergistic influence of Lewis acid sites (Ni as the acid center) and Brønsted acid sites to promote the aromatization process.53,58 Besides, it is noted that hydroxyacetone and 3-hydroxypropanal could be cracked to generate acetaldehyde at high reaction temperature.66,67Thus, the proposed catalytic mechanistic pathways relating to forming quinoline and other valuable heterocycle byproducts from aniline and glycerol are provided in Scheme 1. The formation of quinoline is that glycerol firstly dehydrates to generate acrolein mainly over the weak Brønsted acid sites on the catalyst, followed by reacting with aniline to yield quinoline over the Brønsted and/or Lewis acid sites on the catalyst through Michael addition process, intramolecular aromatization and dehydrogenation reactions (pathway 1).23 Furthermore, 2- and 4-methylquinoline derive from the reaction of aniline and acetaldehyde, whereas their reaction routes are different. As reported by Brosius et al.,14 2-methylquoniline is produced from the Michael addition of aniline with the α,β-unsaturated aldehyde crotonaldehyde (generated from the condensation of acetaldehyde) and subsequent ring-closing electrophilic aromatic substitution (pathway 2). By contrast, 4-methylquinoline originates from the reaction between aniline and acetaldehyde to form enamine, which subsequently reacts with another acetaldehyde to yield product via intramolecular electrophilic aromatic substitution (pathway 3). Besides, a certain amount of hydroxyacetone is produced from glycerol dehydration over Lewis acid sites on catalyst. According to the report of Cui et al.,68 hydroxyacetone was readily transformed to 2-hydroxyl-1-propanal via enol–keto tautomerism, followed by forming a Schiff's base via N-alkylation of aniline and subsequent intramolecular aromatization to produce 3-methylnidol (pathway 4).
In conclusion, the reaction pathways of the above products are affected sensitively by strength and type of acid sites of catalyst. Weak Brønsted acid sites favor the dehydration of glycerol to acrolein, whereas Lewis acid sites retard the former step (eqn (3)) but accelerate the latter one (eqn (4)) via the synergistic effect with Brønsted acid sites. Therefore, the mesoporous Ni/Hβ-At catalyst, possessing abundant weak Brønsted acid sites and appropriate Lewis acid sites, exhibits brilliant catalytic activity on synthesis of quinoline from aniline and glycerol.
4. Conclusions
A green route for vapor-phase synthesis of quinoline from glycerol and aniline are developed in this work. The reaction process consists of dehydration of glycerol to acrolein and subsequent condensation of acrolein and aniline to quinoline, which are affected significantly by the texture and acid properties of the catalyst. The main points are summarized as follows:Mesopores are successfully generated by alkaline treatment on Hβ zeolite via desilication from the framework of zeolite, which can facilitate the transport of bulky products (such as quinoline) from internal surface of catalyst. The addition of Ni species on zeolite eliminates strong Brønsted acid sites and produces Lewis acid sites. Both mesopores and type of acid sites over catalyst play crucial function in catalytic activity for synthesis of quinoline.
The Ni/Hβ-At catalyst with mesopores structure, possessing abundant weak Brønsted acid sites and appropriate Lewis acid sites, exhibits the highest catalytic activity; and as high as 71.4% yield of quinoline is achieved under the optimized reaction conditions. Meanwhile, an enhanced ability of anti-deactivation of the Ni/Hβ-At catalyst is displayed, because the existence of mesopores facilitates the transport of bulky products from internal surface of catalyst and restrains the deposition of the coke. Catalyst deactivation is caused mainly by the deposition of coking substances rather than structure damage of the catalyst; and the desired catalytic property is obtained after 3 reaction–regeneration cycles.
Acknowledgements
This work was supported by the National Natural Science Foundation of China (Grant 21376068), Program for New Century Excellent Talents in University, the Ministry of Education of P. R. China, and the Program for Fu-Rong Scholar in Hunan Province, P. R. China.References
- D. G. Markees, V. C. Dewey and G. W. Kidder, J. Med. Chem., 1970, 13, 324–326 CrossRef CAS PubMed.
- A. A. Alhaider, M. A. Abdelkader and E. J. Lien, J. Med. Chem., 1985, 28, 1394–1398 CrossRef CAS PubMed.
- M. Isobe, T. Nishikawa, N. Yamamoto, T. Tsukiyama, A. Ino and T. Okita, J. Heterocycl. Chem., 1992, 29, 619–625 CrossRef CAS.
- M. Campanati, A. Vaccari and O. Piccolo, Catal. Today, 2000, 60, 289–295 CrossRef CAS.
- V. V. Kouznetsov, L. Y. V. Mendez and C. M. M. Gomez, Curr. Org. Chem., 2005, 9, 141–161 CrossRef CAS.
- Z. H. Skraup, Monatsh. Chem., 1880, 1, 316–318 CrossRef.
- O. Doebner and W. V. Miller, Bioresour. Technol., 1881, 14, 2812–2817 Search PubMed.
- W. J. Boyle and F. Mares, Organometallics, 1982, 1, 1003–1006 CrossRef CAS.
- Y. Tsuji, K. T. Huh and Y. Watanabe, J. Org. Chem., 1987, 52, 1673–1680 CrossRef CAS.
- C. S. Cho, J. S. Kim, B. H. Oh, T. J. Kim, S. C. Shim and N. S. Yoon, Tetrahedron, 2000, 56, 7747–7750 CrossRef CAS.
- B. C. Ranu, A. Hajra and U. Jana, Tetrahedron Lett., 2000, 41, 531–533 CrossRef CAS.
- H. Yalgin, D. Luart and C. Len, J. Flow Chem., 2016, 6, 80–85 CrossRef.
- C. H. Mcateer, R. D. Davies and J. R. Calvin, US Pat., 5,700,942, 1997.
- R. Brosius, D. Gammon, F. Vanlaar, E. Vansteen, B. Sels and P. Jacobs, J. Catal., 2006, 239, 362–368 CrossRef CAS.
- S. Kamiguchi, I. Takahashi, H. Kurokawa, H. Miura and T. Chihara, Appl. Catal., A, 2006, 309, 70–75 CrossRef CAS.
- H. Saggadi, D. Luart, N. Thiebault, I. Polaert, L. Estel and C. Len, Catal. Commun., 2014, 44, 15–18 CrossRef CAS.
- H. Saggadi, D. Luart, N. Thiebault, I. Polaert, L. Estel and C. Len, RSC Adv., 2014, 4, 21456–21464 RSC.
- H. Saggadi, I. Polaert, D. Luart, C. Len and L. Estel, Catal. Today, 2015, 255, 66–74 CrossRef CAS.
- M. Ayoub and A. Z. Abdullah, Renewable Sustainable Energy Rev., 2012, 16, 2671–2686 CrossRef CAS.
- J. Calero, D. Luna, E. D. Sancho, C. Luna, F. M. Bautista, A. A. Romero, A. Posadillo, J. Berbel and C. Verdugo-Escamilla, Renewable Sustainable Energy Rev., 2015, 42, 1437–1452 CrossRef CAS.
- T. K. Amin, N. A. S. Amin and H. Hezaveh, Renewable Sustainable Energy Rev., 2014, 40, 28–59 CrossRef.
- M. Campanati, P. Savini, A. Tagliani, A. Vaccari and O. Piccolo, Catal. Lett., 1997, 47, 247–250 CrossRef CAS.
- B. M. Reddy and I. Ganesh, J. Mol. Catal. A: Chem., 2000, 151, 289–293 CrossRef CAS.
- B. O. D. Costa, M. A. Peralta and C. A. Querini, Appl. Catal., A, 2014, 472, 53–63 CrossRef.
- J. Jin, X. Ye, Y. Li, Y. Wang, L. Li, J. Gu, W. Zhao and J. Shi, Dalton Trans., 2014, 43, 8196–8204 RSC.
- C. Yin, D. Tian, M. Xu, Y. Wei, X. Bao, Y. Chen and F. Wang, J. Colloid Interface Sci., 2013, 397, 108–113 CrossRef CAS PubMed.
- F. Tian, Y. Wu, Q. Shen, X. Li, Y. Chen and C. Meng, Microporous Mesoporous Mater., 2013, 173, 129–138 CrossRef CAS.
- Y. Wu, F. Tian, J. Liu, D. Song, C. Jia and Y. Chen, Microporous Mesoporous Mater., 2012, 162, 168–174 CrossRef CAS.
- F. Tian, X. Yang, Y. Shi, C. Jia and Y. Chen, J. Nat. Gas Chem., 2012, 21, 647–652 CrossRef CAS.
- K. Cheng, J. Kang, S. Huang, Z. You, Q. Zhang, J. Ding, W. Hua, Y. Lou, W. Deng and Y. Wang, ACS Catal., 2012, 2, 441–449 CrossRef CAS.
- J. C. Groen, S. Abelló, L. A. Villaescusa and J. Pérez-Ramírez, Microporous Mesoporous Mater., 2008, 114, 93–102 CrossRef CAS.
- D. Verboekend, G. Vilé and J. Pérez-Ramírez, Cryst. Growth Des., 2012, 12, 3123–3132 CAS.
- B. H. Ha, J. Guidot and D. Barthomeuf, J. Chem. Soc., Faraday Trans., 1979, 75, 1245–1253 RSC.
- Y. Hong and J. J. Fripiat, Microporous Mater., 1995, 4, 323–334 CrossRef CAS.
- L. Aouali, J. Teanjean, A. Dereigne, P. Tougne and D. Delafosse, Zeolites, 1988, 8, 517–522 CrossRef CAS.
- C. W. Luo and Z. S. Chao, RSC Adv., 2015, 5, 54090–54101 RSC.
- C. W. Luo, C. Huang, A. Li, W. J. Yi, X. Y. Feng, Z. J. Xu and Z. S. Chao, Ind. Eng. Chem. Res., 2016, 55, 893–911 CrossRef CAS.
- A. Vimont, F. Thibault-Starzyk and J. C. Lavalley, J. Phys. Chem. B, 2000, 104, 286–291 CrossRef CAS.
- I. Othman, R. M. Mohamed, I. A. Ibrahim and M. M. Mohamed, Appl. Catal., A, 2006, 299, 95–102 CrossRef CAS.
- L. Shirazi, E. Jamshidi and M. R. Ghasemi, Cryst. Res. Technol., 2008, 43, 1300–1306 CrossRef CAS.
- F. Goovaerts, E. F. Vansant, P. De Hulsters and J. Gelan, J. Chem. Soc., Faraday Trans., 1989, 85, 3687–3694 RSC.
- M. Maache, A. Janin, J. C. Lavalley, J. F. Joly and E. Benazzi, Zeolites, 1993, 13, 419–426 CrossRef CAS.
- I. Kiricsi, C. Flego, G. Pazzuconi, W. O. Parker Jr, R. Millini, C. Perego and G. Bellussi, J. Phys. Chem., 1994, 98, 4627–4634 CrossRef CAS.
- J. Perez-Pariente, J. A. Martens and P. A. Jacobs, Appl. Catal., 1987, 31, 35–64 CrossRef CAS.
- P. A. Jacobs, H. K. Beyer and J. Valyon, Zeolites, 1981, 1, 161–168 CrossRef CAS.
- A. Corma, M. T. Navarro, F. Rey, J. Rius and S. Valencia, Angew. Chem., 2001, 113, 2337–2340 CrossRef.
- C. S. Blackwell, J. Phys. Chem., 1979, 83, 3251–3257 CrossRef CAS.
- C.-W. Luo, X.-Y. Feng, W. Liu, X.-Y. Lia and Z.-S. Chao, Microporous Mesoporous Mater., 2016, 235, 261–269 CrossRef CAS.
- Y. T. Kim, K. D. Jung and E. D. Park, Microporous Mesoporous Mater., 2010, 131, 28–36 CrossRef CAS.
- P. Tynjälä and T. T. Pakkanen, J. Mol. Catal. A: Chem., 1996, 110, 153–161 CrossRef.
- Q. Shu, B. Yang, H. Yuan, S. Qing and G. L. Zhu, Catal. Commun., 2007, 8, 2159–2165 CrossRef CAS.
- A. Guzman, I. Zuazo, A. Feller, R. Olindo, C. Sievers and J. A. Lercher, Microporous Mesoporous Mater., 2005, 83, 309–318 CrossRef CAS.
- C. Yin, R. Zhao and C. Liu, Energy Fuels, 2003, 17, 1356–1359 CrossRef CAS.
- Y. Chen, C. H. Xu, C. Q. Liu, X. Li, J. Y. Liu, Y. Cao and J. Yang, Heteroat. Chem., 2013, 24, 263–270 CrossRef CAS.
- J. A. Anderson, L. Daza, S. Damyanova, J. L. G. Fierro and M. T. Rodrigo, Appl. Catal., A, 1994, 113, 75–88 CrossRef.
- E. Heracleous, A. F. Lee, K. Wilson and A. A. Lemonidou, J. Catal., 2005, 231, 159–171 CrossRef CAS.
- A. Kantürk Figen, Int. J. Hydrogen Energy, 2013, 38, 9186–9197 CrossRef.
- G. Liang, L. He, H. Cheng, W. Li, X. Li, C. Zhang, Y. Yu and F. Zhao, J. Catal., 2014, 309, 468–476 CrossRef CAS.
- Y. T. Kim, K. D. Jung and E. D. Park, Appl. Catal., A, 2011, 393, 275–287 CrossRef CAS.
- R. Liu, T. F. Wang and Y. Jin, Catal. Today, 2014, 233, 127–132 CrossRef CAS.
- P. Lauriol-Garbey, J. M. M. Millet, S. Loridant, V. Bellière-Baca and P. Rey, J. Catal., 2011, 281, 362–370 CrossRef CAS.
- Y. L. Gu, N. Y. Cui, Q. J. Yu, C. Y. Li and Q. K. Cui, Appl. Catal., A, 2012, 429–430, 9–16 CrossRef CAS.
- L. G. Possato, R. N. Diniz, T. Garetto, S. H. Pulcinelli, C. V. Santilli and L. Martins, J. Catal., 2013, 300, 102–112 CrossRef CAS.
- S.R. Ginjupalli, S. Mugawar, P. Rajan N, P.K. Balla and V. R. C. Komandur, Appl. Surf. Sci., 2014, 309, 153–159 CrossRef.
- X. Zhang, C. W. Luo, C. Huang, B. H. Chen, D. G. Huang, J. G. Pan and Z. S. Chao, Chem. Eng. J., 2014, 253, 544–553 CrossRef CAS.
- E. Tsukuda, S. Sato, R. Takahashi and T. Sodesawa, Catal. Commun., 2007, 8, 1349–1353 CrossRef CAS.
- L. Cheng and X. P. Ye, Catal. Lett., 2009, 130, 100–107 CrossRef CAS.
- Y. X. Cui, X. S. Zhou, Q. Sun and L. Shi, J. Mol. Catal. A: Chem., 2013, 378, 238–245 CrossRef CAS.
Footnote |
| † Electronic supplementary information (ESI) available. See DOI: 10.1039/c6ra26736j |
| This journal is © The Royal Society of Chemistry 2017 |


