
 Open Access Article
 This Open Access Article is licensed under a
 Creative Commons Attribution 3.0 Unported Licence
Dynamic formation of nanostructured particles from vesicles via invertase hydrolysis for on-demand delivery†
Wye-Khay Fong *ab,
Antoni Sánchez-Ferrera,
Francesco Giovanni Ortellia,
Wenjie Suna,
Ben J. Boydbc and
Raffaele Mezzenga*a
*ab,
Antoni Sánchez-Ferrera,
Francesco Giovanni Ortellia,
Wenjie Suna,
Ben J. Boydbc and
Raffaele Mezzenga*a
aETH Zürich, Department of Health Sciences & Technology, 8092 Zürich, Switzerland. E-mail: raffaele.mezzenga@hest.ethz.ch
bDrug Delivery, Disposition & Dynamics, Monash Institute of Pharmaceutical Sciences, Monash University, 381 Royal Parade, Parkville, Victoria 3052, Australia. E-mail: khay.fong@monash.edu
cARC Centre of Excellence in Convergent Bio-Nano Science and Technology, Monash Institute of Pharmaceutical Sciences, Monash University (Parkville Campus), 381 Royal Parade, Parkville, Australia
First published on 16th January 2017
Abstract
The unique multicompartmental nanostructure of lipid-based mesophases can be triggered, on-demand, in order to control the release of encapsulated drugs. In this study, these nanostructured matrices have been designed to respond to a specific enzyme, invertase, an enzyme which catalyses the hydrolysis of sucrose. The effect of two sugar esters upon the phase behaviour of two different lipids which form cubic phases, phytantriol and monolinolein, was investigated. Factors affecting the hydrolysis of the sucrose headgroup are discussed in terms of the molecular structure of the sugar surfactant and also its ability to incorporate into the lipid bilayer. By hydrolysing the incorporated sugar esters, a dynamic change in mesophase nanostructure from vesicles to a cubic phase was observed. This phase change resulted in the triggered release of an encapsulated model drug, fluorescein. This investigation demonstrates, for the first time, that changes on a molecular level by subtly controlling the hydrophilic and hydrophobic features of an amphiphilic additive at the interface by enzymatic hydrolysis can result in a global change in the system and so paves the way towards the design and development of lipid-based matrices which are responsive to specific enzymes for the controlled delivery of pharmaceutically active molecules or functional foods.
Introduction
Nanostructured lipid-based lyotropic liquid-crystalline (LLC) materials are promising advanced materials for use in drug delivery, biosensing, foodstuff and protein crystallisation.1–6 The unique multicompartmental structure of some of these mesophases, particularly the bicontinuous cubic (V2) and inverse hexagonal (H2) mesophases, allows for the encapsulation, protection and controlled release of a wide range of hydrophilic, hydrophobic and amphiphilic substrates.7–11 This feature is attributed to the nanostructure of the LLC mesophase as the dimensions and geometry of the aqueous channels and lipidic domains determine the rate of release of encapsulated active molecules.12,13 Additionally, the interaction between the encapsulated drug and the lipidic interface can retard or accelerate the release rate.14,15In order to exert exact spatiotemporal control over the release rate, research has focussed upon altering intramolecular interactions as a means to change the packing of the amphiphiles. The alteration of lipid packing can be achieved by introducing molecules which alter the packing of the lipidic molecules, whereby molecules with a larger hydrophobic portion promote the formation of structures with increased negative curvature16–18 and those which have an influence on the hydrophilic part promote the swelling and/or formation of structures with less negative curvature.19–21 By engineering parts of the amphiphile in order to specifically alter the phase behaviour, selective phase transitions can be achieved.22,23 Changing the external environment of lipidic matrices, such as an increase in pressure, can also result in selective phase transitions.24,25 Exposure to a stimulus can result in the specific alteration of the global physicochemical properties of the matrix such as viscosity.26 Most importantly, for application in active drug delivery, dynamic release of encapsulated drug from these nanostructured matrices has been demonstrated using temperature,27 pH,28 light activation of photothermal nanoparticles29,30 and a magnetic field,31,32 whereby the application of the external stimulus has induced a phase transition and consequent alteration of the release rate that reflects the change in nanostructure.33
Lipidic mesophases are thermodynamically stable and consequently can be dispersed into sub-micron particles with preserved internal nanostructure and colloidal stability commonly imparted by block copolymers, proteins and particles.34–37 Particles which have an internal nanostructure of V2 and H2 are called cubosomes and hexosomes respectively. These nanostructured particles retain the interfacial properties of the parent bulk phase, with the added benefit of having a lower viscosity to enable easier administration in drug delivery applications. Additionally, the properties of the stabiliser can be used to influence the biocompatibility of the particles.38,39 One limitation of these dispersed systems is that they exhibit burst release for small molecule additives.40 In order to avoid this phenomenon, the on-demand manipulation of these systems from a slow releasing to a fast releasing nanostructure is proposed. The selective modification of the colloidal nanostructure has been achieved by selective material transfer between different lipidic particles,41 the presence of different ionic species42,43 and pH,44,45 thus demonstrating the potential of these nanostructured colloids as stimuli responsive materials for drug delivery.
Towards site selective drug release, enzyme sensitive systems are of interest where over-expressed disease-associated enzymes are utilized to trigger drug release.46,47 Enzymes are macromolecular biological catalysts, which accelerate specific chemical reactions. Recently, we have demonstrated the use of enzymes to change the mesophase structure. By mimicking the naturally occurring digestion process that occurs within digestive systems,48–50 it has been shown that an emulsion of an indigestible lipid (phytantriol) and a digestible lipid (tributyrin) could be digested back to form a cubic phase upon addition of a lipase51 (Fig. 1), whereby amphiphilic molecules re-establish themselves within the lipidic and aqueous domains of the lipidic mesophase according to their physicochemical properties.52
 | ||
| Fig. 1 The hydrolysis of tributyrin, a triglyceride which is a substrate of lipase, from a phytantriol based emulsion results in the formation of nanostructured particles (cubosomes) over time, as shown by time resolved SAXS and cryoTEM.51 | ||
The purpose of this study is to demonstrate that nanostructured dispersions can be specifically designed to respond to targeted enzymes in order to trigger the release of encapsulated drugs. Lipidic mesophases were designed to respond to invertase, an enzyme which hydrolyses sucrose at the α-1,4-glycosidic bond, resulting in an equimolar mixture of fructose and glucose,53 as shown in Scheme 1. Sugar-based amphiphiles are known to modify the interfacial behaviour of lipidic membranes, as they have been utilised to target lectins associated with cancer states.54–57 This study investigates the incorporation of sugar esters into phytantriol (PHYT) and monolinolein (MLO) matrices in order to form vesicles which could be selectively transformed into nanostructured particles (cubosomes) in response to the hydrolysis of the sucrose head group by invertase.
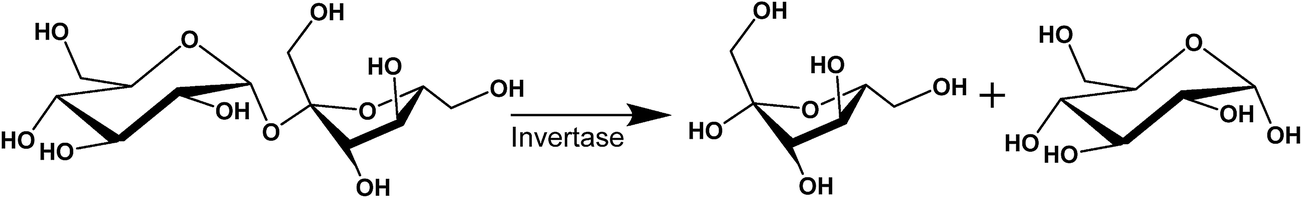 | ||
| Scheme 1 The invertase-catalysed hydrolysis of sucrose in the presence of water to form fructose and glucose. | ||
Experimental procedures
Materials
Sodium acetate, sucrose, acetic acid (min. 99.8%), methanol, dichloromethane, chloroform, invertase from baker’s yeast (S. cerevisiae) and fluorescein were purchased from Sigma (St. Louis, Missouri, United States). Lipase Amano G50 was a generous gift from Amano Enzyme Inc. (Nagoya, Japan). Phytantriol (PHYT) was a generous gift from DSM (Heerlen, Netherlands). Pluronic® F127 Prill was obtained from BASF Corporation (Ludwigshafen, Germany). Sucrose laurate (L-1695, containing 80% of monoester) and sucrose stearate (S-1670 containing 75% of monoester) were gifted by Mitsubishi Kagaku Foods Corporation (Tokyo, Japan). Commercial grade monolinolein (MLO), Dimodan U/J® was generously provided by Danisco (Copenhagen, Denmark), and was used as received.Preparation of bulk mesophases and nanostructured dispersions
Briefly, lipid mixtures were produced by dissolving the required quantities of lipid (PHYT or MLO) and sugar ester with a 2![[thin space (1/6-em)]](https://www.rsc.org/images/entities/char_2009.gif) :1 mixture of chloroform and methanol. Solvent was then evaporated under vacuum in a round bottom flask for 2 h. For bulk phases, an aliquot of the dry lipid mixture was then weighed into glass tubes and an excess of 64 mM acetate buffer, pH 5.0, was then added to ensure the formation of the mesophase under excess water conditions. This pH was chosen as it is the optimal pH at which invertase catalyses the hydrolysis of sucrose. The tubes were then stored overnight at 37 °C to equilibrate. Light microscopy and equilibrium SAXS measurements were performed on bulk mesophases in order to rapidly identify formulations of interest.
:1 mixture of chloroform and methanol. Solvent was then evaporated under vacuum in a round bottom flask for 2 h. For bulk phases, an aliquot of the dry lipid mixture was then weighed into glass tubes and an excess of 64 mM acetate buffer, pH 5.0, was then added to ensure the formation of the mesophase under excess water conditions. This pH was chosen as it is the optimal pH at which invertase catalyses the hydrolysis of sucrose. The tubes were then stored overnight at 37 °C to equilibrate. Light microscopy and equilibrium SAXS measurements were performed on bulk mesophases in order to rapidly identify formulations of interest.
Nanostructured dispersions were produced by making a mixture of lipid and sugar ester film in a round bottom flask then hydrating it with 0.5% Pluronic F127 in a pH 5.0 acetate buffer to prepare a 7.5% lipid dispersion. The coarse dispersion was then transferred into a vial and further processed with a probe sonicator (Ultraschallprozessor, Dr Kielscher GmbH) with pulsed sonication for 5 min at 20% amplitude.
Polarized optical microscopy (POM)
As a rapid screening technique, bulk mesophase samples were observed under cross polarised light with a Zeiss Axioskop 2 at 37 °C. Under these conditions, cubic mesophases are non-birefringent whereas those possessing a lamellar structure show a characteristic birefringent Maltese cross pattern.Nuclear magnetic resonance spectroscopy (NMR)
In order to evaluate the mixture composition of sucrose laurate and stearate and to determine the place where the carboxylic acid is attached to the sucrose unit, 1D 1H and 13C NMR experiments, as well as DEPT and 2D 1H-1H (COSY) and 1H-13C (HETCOR) NMR experiments, were carried out on a Bruker Advance spectrometer (Bruker BioSpin GmbH, Rheinstetten, Germany), operating at 400 MHz (1H) and 100 MHz (13C), and using D2O or DMSO-d6 as solvents and as internal standards. Example NMR spectra are presented in the ESI (Fig. SI2).†Small angle X-ray scattering (SAXS)
Equilibrium SAXS patterns were acquired using a Rigaku microfocused X-ray source of wavelength λ = 1.54 Å operating at 45 kV and 88 mA. Diffracted X-rays were collected on a gas filled 2D detector. The scattering vector q = (4π/λ)sinθ, with 2θ, the scattering angle, was calibrated using silver behenate with the q-range from 0.01 Å−1 to 0.45 Å−1. Data were collected and azimuthally averaged using the SAXSgui software to yield 1D intensity versus scattering vector, q. Viscous samples were loaded into a Linkam hot-stage between two thin mica sheets and sealed by an O-ring, with a sample thickness of ca. 1 mm. Dispersed samples were loaded into 1.5 mm quartz capillaries and sealed with epoxy glue. Measurements were performed at 37 °C.
Time resolved SAXS (TRSAXS) data for the enzymatic studies were collected on the SAXS/WAXS beamline at the Australian Synchrotron. In vitro digestion experiments were conducted in a thermostated glass digestion vessel at 37 °C.58 7 mL of dispersion was equilibrated in the digestion vessel before the remote addition of 0.5 mL of an invertase solution (10 mg mL−1) to initiate digestion. The digestion medium was pumped (10 mL min−1) through a 1.5 mm quartz capillary flow cell using a peristaltic pump and the quartz capillary was placed in the X-ray beam.59
The scattering profiles were acquired for 5 s every 10 s at an energy of 10 keV using a Pilatus 1 M detector (active area 169 × 179 mm2 with a pixel size of 172 μm) with a sample-to-detector distance of 1015 mm providing a q range of 0.01 Å−1 < q < 0.7 Å−1. The scattering images were integrated into the one-dimensional scattering function I(q) using the in-house-developed software package ScatterBrain. The q range calibration was made using silver behenate as the standard. The cubic and hexagonal phase space groups and lattice parameters were determined by the relative positions of the Bragg peaks in the scattering curves, which correspond to the reflections on planes defined by their (hkl) Miller indices.60
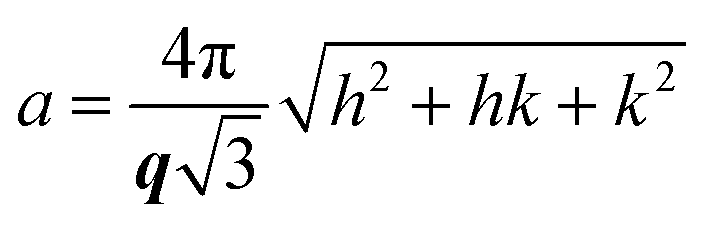
Bulk and dispersed LLC phases in excess water are readily identified using SAXS, where each phase can be identified by its specific Bragg peak positions. For the double diamond cubic phase (V2 Pn3m) the Bragg reflections occur at relative positions in q at √2:√3:√4:√6:√8:√9… and for the primitive bicontinuous cubic phase (V2 Im3m) the Bragg peaks occur at q = √2:√4:√6:√8:√10… The H2 phase is identified by reflections at 1:√3:√4…, the bilayer lamellar (Lα) phase gives Bragg peaks in the ratio of 1:2:3:4… and the L2 phase is identified by a singular characteristic broad peak. The mean lattice parameter, a, was deduced from the corresponding set of observed interplanar distances, d (d = 2π/q), using the appropriate scattering law for the phase structure. For cubic phases:
 | (1) |
 | (2) |
For the L2 phase, which shows only one broad peak, d is termed the characteristic distance.
High performance liquid chromatography (HPLC)
The digestion of a solution of sucrose laurate (31.5 mM, a concentration that reflects the amount of sugar ester in the liquid-crystalline dispersion) was analysed using high performance liquid chromatography (HPLC, Agilent 1100, Switzerland). The sucrose laurate solution was digested at 37 °C, with samples (4 mL) removed at defined time points. Upon cooling, any remaining sugar ester was extracted with chloroform. The aqueous phase was then filtered before separation of the injection volume (25 μL) with an analytical column Dionex CarboPac PA1 (2 mm × 250 mm) and a Carbopac PA1 guard column (2 mm × 50 mm), maintained at 30 °C. The elution program was 0.3 mL min−1 of 18 mM NaOH for 25 min, then 0.5 mL min−1 of 200 mM NaOH for 10 min (to eliminate possible retained anions), followed by re-equilibration with 0.3 mL min−1 of 18 mM NaOH. Retention times for glucose, fructose and sucrose were 13.4, 16.9 and 20.1 min, respectively. For the pulsed amperometric detection, the gold electrode was freshly polished and used with waveform A as per Dionex technical note 21. Before analysis, samples were spiked with 2-deoxyglucose (60 μM) as an internal standard. Calibration curves were obtained with glucose, fructose and sucrose standards relative to the internal standard signal. All data were collected and processed with Chromeleon v.6.8 (Dionex software). Example chromatograms are presented in the ESI (Fig. SI3†).Triggered drug release measured by the pressure ultrafiltration method
The mixture of PHYT and 30% SL was dispersed in fluorescein solution (1 mg mL−1) in pH 5.0 acetate buffer (64 mM). The dispersion was then separated from the free model drug solution by applying 2.5 mL of the dispersion to PD10 desalting columns (Silverwater, NSW, Australia). The separated vesicle dispersion (1 mL) was subsequently added to 20 mL of release medium, representing t = 0. The release medium for the enzyme triggered release contained 6 mg of invertase, consistent with the lipid to enzyme ratio utilised in the dynamic SAXS studies. Samples (2 mL) were removed at 1, 5, 10, 15, 30, 45 and 60 min for the measurement of released fluorescein concentration by pressure ultrafiltration. The temperature of the experiments was maintained at 37 °C using a water bath. Particle size distribution was determined before and after the release study using a Zetasizer Nano ZS (Malvern).Drug release and encapsulation efficiency were quantified by the pressure ultrafiltration method40 using an Amicon 8010 pressure ultrafiltration cell and YM10 regenerated cellulose membranes (both from Millipore Corp., Bedford, MA) with a 30 kDa cut-off and high-purity compressed air as the gas source. Drug concentration in the filtrate was measured using fluorescence (Infinite® 200 PRO series microplate reader, Tecan, Männedorf, Switzerland) at excitation and emission wavelengths of 460 nm and 515 nm, respectively. To determine the volume of solution that was required to saturate the membrane, a solution containing 0.1 mg mL−1 fluorescein in Milli-Q water (Millipore) was passed through the membrane, and fractions of four drops at a time were collected, and the volume of each fraction was determined by weight, assuming the density of water. The concentration of fluorescein in each fraction of the filtrate was determined by fluorescence, and the volume required for the concentration in the ultrafiltrate to reach 95% of the concentration in the cell was determined. This void volume was discarded and the subsequent 150 μL aliquots were collected and analysed.
Molecular simulations
Structures were drawn using HyperChem 8.0.3 software, and the semi-empirical quantum mechanics method Austin Model 1 (AM1), together with the Polak–Ribiere conjugate gradient algorithm with a root-mean-square (RMS) gradient of 0.05 kcal Å−1 mol−1, was used for the geometrical optimization of the molecules, as well as the spin-pairing restricted Hartree–Fock (RHF) operators for all neutral species. The self-consistent field (SCF) convergence limit was set at 10−5, and the accelerated convergence procedure was used. All geometrical values and some quantitative structure–activity relationship (QSAR) parameters were obtained from the quantum mechanics simulations.Results
Influence of sucrose esters on phase behaviour MLO and PHYT
Sucrose esters are known to swell the mesophase and promote the formation of vesicles at higher concentrations.13 The effect of the two sugar esters on the phase behaviour of both PHYT and MLO in excess water was determined in order to find the amount of sugar ester required to switch the nanostructure from the bicontinuous cubic (V2) to lamellar (Lα) phase, so that enzymatic attack on the hydrophilic headgroup of the sugar ester would reverse the impact on packing resulting in a vesicle to cubosome transition. The molecular structures and partial phase diagrams of these systems are shown in Fig. 2. The addition of the sucrose esters resulted in the swelling of the MLO V2 Pn3m nanostructure and then an order-to-order transition to the V2 Im3m as previously reported,13 an occurrence which was not observed in the equilibrium phase behaviour of phytantriol. The compositions that were selected for further study were one step higher than the critical concentrations of sucrose laurate which provided the lamellar phase. These formulations were PHYT + 30% sucrose laurate (PHYT + 30% SL), PHYT + 40% sucrose stearate (PHYT + 40% SS), MLO + 30% sucrose laurate (MLO + 30% SL) and MLO + 30% sucrose stearate (MLO + 30% SS).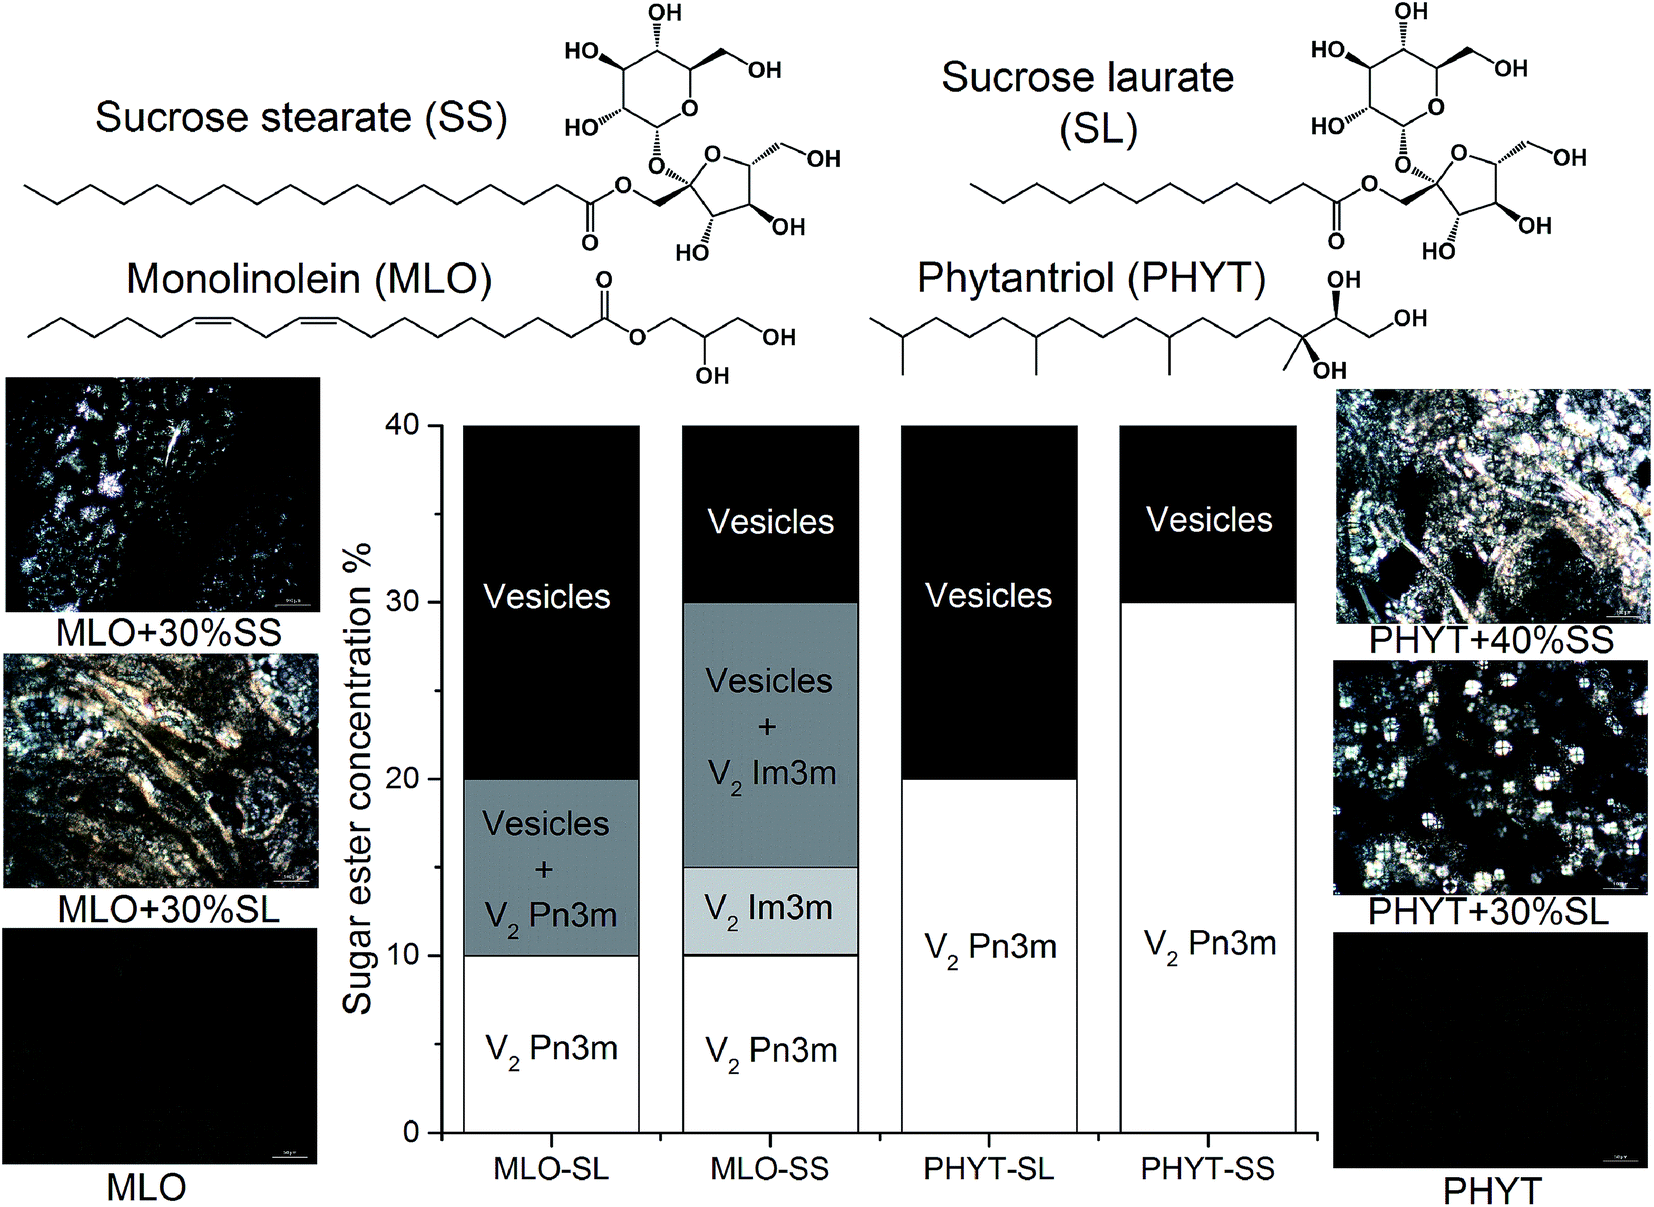 | ||
| Fig. 2 Molecular structures of the materials used in this study (top) and partial phase behaviour (at 37 °C and excess water) demonstrating the effect of the addition of sugar esters on the phase diagrams of the bulk PHYT and MLO lyotropic liquid-crystalline matrices in excess water as determined by both SAXS and POM (bottom). Representative POM images of the MLO and PHYT systems that were used in the digestion studies are on the left and right respectively. | ||
Digestion of sugar ester-doped vesicles followed using time resolved SAXS
The digestion of the different vesicle formulations by invertase was initiated by the remote addition of the enzyme solution. The resulting TRSAXS profiles of the structures present during digestion of PHYT based vesicles are shown in Fig. 3 and the MLO based vesicles in Fig. SI1.† An increase in scattering at low q is attributed to addition of invertase upon initiation of digestion. PHYT + 30% SL was the only system that demonstrated an order-to-order transition from vesicles to V2 Im3m beginning at 580 s, not returning to V2 Pn3m as indicated in the PHYT + SL + water equilibrium phase behaviour. As the sucrose headgroup of the sugar ester is hydrolysed, it is anticipated that the monosaccharide diffuses away from the interface into the aqueous domain of the PHYT + 30% SL and eventually to the surrounding solution, and the other product of digestion (monosaccharide laurate) remains at the interface in a position to modify the phase behaviour. Although the PHYT + 40% SS system appeared to be vesicles in the equilibrium study, it was not the case when utilising the synchrotron X-ray source. The system exhibited the V2 Im3m phase throughout the duration of the experiment, with a slight 3% increase in V2 Im3m peak intensity. As anticipated, the PHYT dispersion that did not contain any sugar ester displayed the V2 Pn3m phase and did not change over time upon addition of invertase solution. In contrast, the MLO based systems were not responsive to invertase digestion as no change in nanostructure or in peak intensity upon addition of invertase was observed (Fig. SI1†). | ||
| Fig. 3 TRSAXS profiles (q vs. log intensity vs. time) of PHYT based dispersions. (A) Invertase digestion of vesicles formed by PHYT + 30% sucrose laurate which demonstrated a disorder-to-order transition from vesicles to V2 Im3m. The inset highlights the timing of this phase transition. Invertase digestion of (B) vesicles formed by PHYT + 40% sucrose stearate, and (C) PHYT cubosomes. No alteration in phase behaviour was observed in panels (B) and (C). | ||
Multiply responsive dispersions – digestion with both invertase and lipase
By incorporating multiple elements into the lipidic bilayer that are responsive to different enzymes a dual responsive system can be created. In this system, the indigestible lipid is PHYT, and the two digestible elements are MLO and SL which are digested by lipase and invertase, respectively, where the three amphiphiles were added in a 1:1:1 weight ratio. Upon the addition of invertase (Fig. 4A), no phase transition was observed, however, the intensity of the peak at q = 0.131 Å−1 decreases by 6% over 2000 s. The access of invertase to the sucrose laurate headgroups could have been inhibited by the arrangement of the amphiphiles at the bilayer. Upon the subsequent addition of lipase (Fig. 4B) a phase transition was observed from vesicles to V2 Im3m at ∼700 s to the inverse micellar phase at ∼1600 s. A significant increase in scattering at low q was also observed over time, which could indicate the formation of micellar structures. These phase changes could be the result of the action of both the lipase digesting the MLO and so exposing the SL to be hydrolysed by invertase.
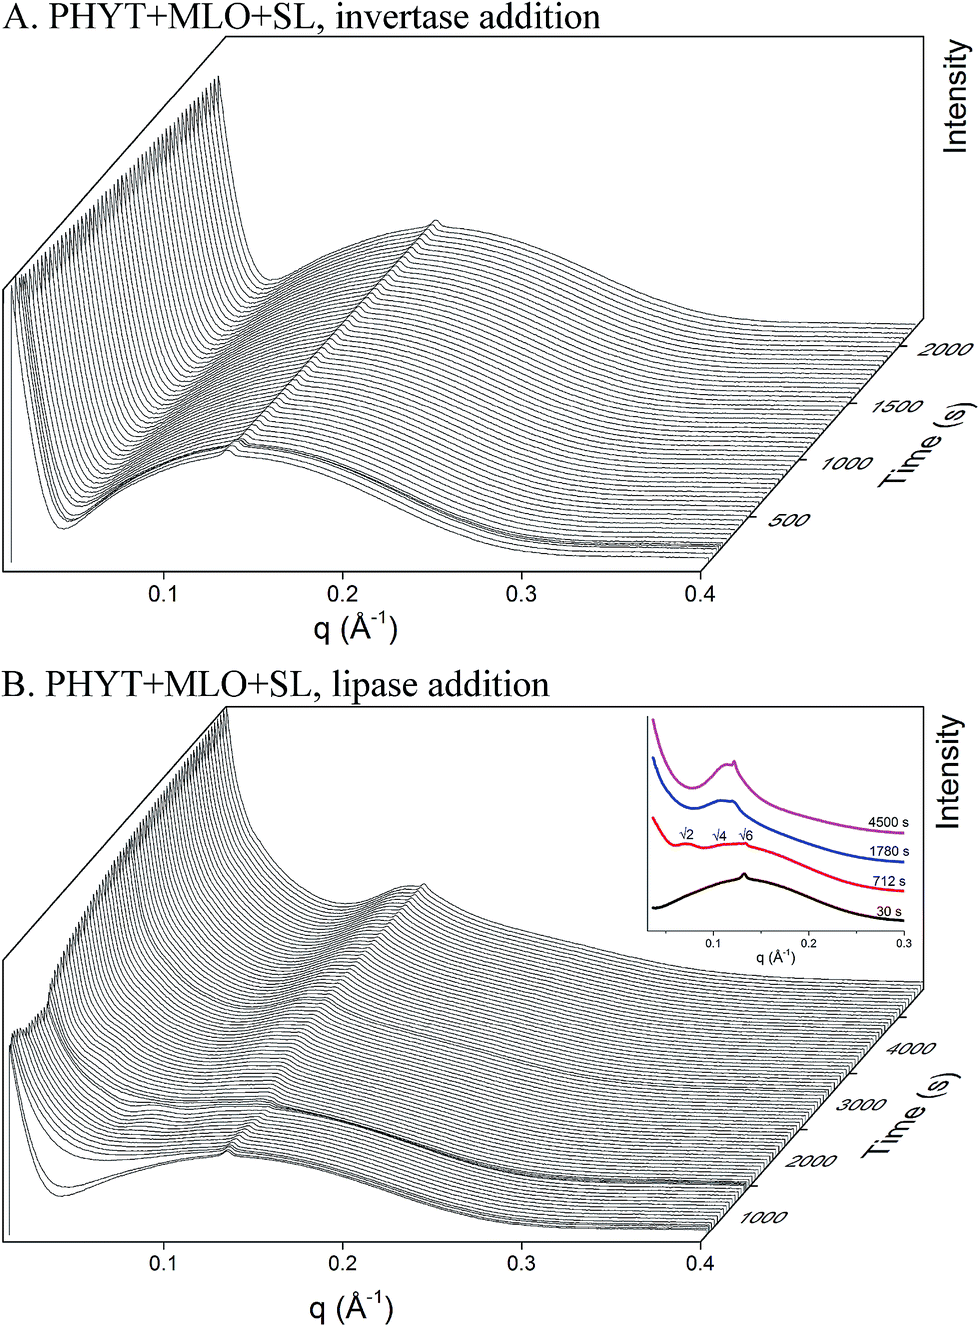 | ||
| Fig. 4 TRSAXS profiles of digestion of the multi-enzyme responsive dispersion containing PHYT + MLO + SL on exposure to (A) invertase and its subsequent exposure to (B) lipase. The inset highlights the scattering profiles at specific time points. Minimal reduction in intensity was observed upon exposure to invertase, and no overall change in nanostructure of the vesicles was observed. Upon exposure to lipase, the vesicles transitioned to V2 Im3m at ∼700 s and then formed an inverse micellar phase at ∼1600 s. | ||
Digestion kinetics of sucrose laurate in solution
Hydrolysis of the sucrose ester was complicated by the location of the substitution of the laurate tail on the sucrose moiety. Analysis of the alkyl substitutions on the sucrose headgroup by NMR found that the laurate tail is attached to different hydroxyl groups of the sucrose molecule (Table 1). In addition, the surfactant is only 80% mono-substituted and the remaining 20% di- and tri-substituted. From the HPLC analysis, the amount of fructose eventuating from the digestion was approximately only 25% of the 31.5 mM SL solution, which correlates to the amount of mono-substituted laurate chains onto the glucose moiety of the sucrose headgroup. This suggests that the alkyl tail prevents invertase from hydrolysing the sucrose laurate isomers where the laurate chain is substituted onto the fructose moiety, most likely by preventing its approach to the active site of the enzyme.| Glucose substituted 30% | C6 | 11% |
| C4 | 5% | |
| C3 | 7% | |
| C2 | 7% | |
| Fructose substituted 70% | C6′ | 14% |
| C4′ | 19% | |
| C3′ | 21% | |
| C1′ | 16% | |
| CH2OH | 41% | |
| CHOH | 59% |
In addition to the substitutions of the laurate tail, the kinetics of invertase-catalysed hydrolysis was hypothesised to be complicated by the presence of the alkyl chain. As enzymes themselves are amphiphilic in nature, the surfactant properties of the sucrose esters may affect the hydrolysis of the sucrose headgroup by invertase. The kinetics of hydrolysis of sucrose stearate is not displayed as invertase was not able to catalyse the hydrolysis of the sucrose stearate in solution due to its limited solubility, and potentially as a result of the denaturation of the enzyme due to the surfactant.61 The digestion of a 31.5 mM solution of SL was followed by HPLC (Fig. 5). Sucrose (1.04 mM) was present at t = 0, which suggests that some sucrose, hydrolysed from the parent ester, was present in the solution prior to the addition of the enzyme solution. Consequently, the concentration of glucose and a fraction of the fructose (1.04 mM) that was produced during digestion are attributed to the hydrolysis of this free sucrose and not to the digestion of the ester. Thus, only the sucrose laurate esters where the alkyl tail is attached to the glucose, is hydrolysed by invertase. By fitting the two different hydrolysis reactions that are catalysed by invertase in this solution as indicated in Fig. 5, the rates of hydrolysis of sucrose and SL were determined (Table 2). The rate of hydrolysis of the sucrose ester was found to be slower than that of the sucrose itself, potentially due to the need for the enzyme to overcome higher steric barriers to reach its substrate.
 | ||
| Fig. 5 The digestion of sucrose laurate solutions. HPLC analysis of samples taken from the digestion of 16.5 mg mL−1 sucrose laurate over time, where black squares show the evolution of glucose, red circles correspond to fructose and blue triangles to sucrose (n = 3, ±σ). These data were fitted with the equations indicated adjacent to each curve, where S0 is the initial sucrose concentration, SL0 is the initial sucrose laurate concentration (glucose-attached), and kSL and kS are the first order kinetic constants for the hydrolysis processes. | ||
| Hydrolysis reaction | Rate of hydrolysis |
|---|---|
| S0 → F + G | kS = 0.011 s−1 |
| SL0 (glucose-attached) → F + GL | kSL = 0.007 s−1 |
Invertase-triggered release study
Invertase-triggered release was demonstrated from a PHYT + 30% SL vesicle formulation, utilising fluorescein as a model drug (Fig. 6). Vesicles that were not exposed to the enzyme displayed a slow release over the course of the study. Vesicles which were exposed to invertase demonstrated a significant boost in the amount of fluorescein released, whereby 90% release was achieved after 2 min. Moreover, particle sizing recorded before and after the invertase-catalysed study showed a decrease in size, whereby before hydrolysis was initiated, the hydrodynamic diameter of the particles in the lipid dispersion was 123.5 ± 4 nm with PDI 0.196 ± 0.04, and after hydrolysis, it was 107.4 ± 2 nm with PDI 0.206 ± 0.03. This is not unexpected as the overall molecular volume of the headgroups of the particle would decrease, thus reducing the hydrodynamic diameter of the particle. Both the triggered release and the reduction in particle size are attributed to the hydrolysis of the sucrose headgroup initiating a transition from vesicles to V2 Im3m. | ||
| Fig. 6 Release of the model drug, fluorescein, over time from the untriggered PHYT + 30% sucrose laurate (red) and invertase triggered release (black), (n = 3, ±SEM). Release via invertase catalysed hydrolysis of the sucrose headgroup results in 93% release within 10 min of adding the enzyme. Release studies were performed at pH 5.0 and 37 °C. Lines are only intended to be a guide for the eye. | ||
Discussion
Sugar surfactants affect the phase behaviour of lipidic bicontinuous cubic phases, where the hydrophilicity of the sugar surfactant promotes hydration at the interface, swelling the cubic phase with increasing concentration and eventually forcing the transition to the lamellar structure.13 Pure sugar surfactants with saturated side-chains form normal, as opposed to inverse, mesophases in aqueous environments,62 and as such promote the formation of lamellar structures when incorporated into MLO and PHYT systems.19 Additionally, a difference in the phase behaviour of the mixed amphiphile systems was observed between the systems formed by the two sugar esters with the different length tails; the phase transition from the bicontinuous cubic to vesicles occurs at a lower concentration of sucrose laurate added to the main lipid compared to sucrose stearate.In comparison, the hydrolysis of the sucrose laurate to glucose laurate produced a more substantial transformation in the molecular packing. Upon exposure to invertase, the area of the sucrose headgroup is diminished which results in an increase in its CPP to 0.469 and consequently an increase in hydrophobicity. The resulting molecular shape resembles a truncated cone which is more akin to the shape of phytantriol and so is more likely to form inverse cubic phases. The small amount of conversion of the additive to the glucose laurate, up to ∼6% of the total amount of lipid in the system, was sufficient to trigger the transition from vesicles to V2 Im3m. By modifying the molecular shape of the additive to match the shape of the parent lipid, the desired nanostructure was formed.
The rationalisation of this behaviour lies in the self-assembly of lipidic amphiphiles in a bilayer which can qualitatively be described by the critical packing parameter (CPP), defined as:
 | (3) |
| CPP | V (Å3) | Lc (Å) | A0 (Å2) | |
|---|---|---|---|---|
| Sucrose laurate – glucose substituted | 0.322 | 214.6 | 14.6 | 45.6 |
| Glucose laurate | 0.469 | 214.6 | 14.6 | 31.2 |
There were two major factors in determining the ability of the enzyme to access the sucrose headgroup of the sugar ester; the positioning of the sucrose ester at the interface and the accessibility of the enzyme to the headgroup. The bulkiness of the headgroup,64 length of the alkyl tail of the surfactant,65 as well as its substitution and the molecular chirality,66,67 affect its positioning at the interface, and as a consequence, can assist or hinder the ability of the enzyme to access and hydrolyse the headgroup. The mechanism for the hydrolysis of sucrose by invertase involves the Asp-23 as a nucleophile and Glu-204 as an acid/base catalyst.68 If these active sites cannot access the molecule, hydrolysis cannot occur. It should be noted that the effect of substrate and product inhibition of the enzyme is likely to be minimal as the amount of both in the system is marginal. The longer tail of the stearate does not match the bilayer packing of the bulk lipids as it is >5 Å longer than the Lc of both PHYT and MLO, and can result in it residing more in the lipidic domain than at the interface. The shorter tail of the laurate allows it to insert optimally at the interface of the PHYT bilayer where it can most efficiently influence the packing and so be available for digestion. Thus, only the fructose substituted sucrose laurate could be accessed by the invertase at the interface.
The invertase catalysed hydrolysis of the bilayer results in the triggered release of the model drug. Drug release does not appear to exactly follow the timing of the phase change which is attributed to the dynamic rearrangement of amphiphiles from the outer membrane to inner membrane in order to find equilibrium.69 There are two main premises as to how a drug is released from liposomes upon exposure to a stimulus. Firstly, the redistribution of the membrane lipids across the bilayer can result in the cavitation of the liposomal bilayer and therefore complete burst release of the payload.47 This occurs mainly in systems that contain lipids which do not form inverse phases. The second conjecture is that the burst release of the aqueous solubilised payload from within the vesicles can also be due to the transient formation of inverse phases,70 which is the case in this system. In both cases, the uncontrolled release of hydrophilic molecules is shown. Thus, hydrophobic molecules, which must traverse from within the lipidic bilayer to the surface of the cubosome before being released, may be more suited to this type of on-demand release. In addition, molecular modelling may be used to visualise where and how the molecules sit at the interface and how they redistribute upon the application of a stimulus.
Conclusions
The use of a carbohydrate targeting enzyme to induce transformation of an on-demand nanostructured lipid-based system was demonstrated for the first time in this study. The incorporation of the digestible moiety, sucrose laurate, into a MLO or PHYT lipid bilayer resulted in the formation of vesicles. Invertase catalysed the hydrolysis of sucrose laurate incorporated into PHYT vesicles, which were dynamically converted to cubosomes with a V2 Im3m structure. Further, the use of a mixture of PHYT and MLO enabled the preparation of a dual enzyme responsive vesicle system, responsive to both invertase and lipase. Vesicles formed by PHYT and sucrose laurate were triggered to release a model drug upon exposure to invertase. This research paves the way towards the informed design of structured lipidic systems, which are responsive to specific enzymes for the controlled delivery of pharmaceutically active molecules or functional foods.Acknowledgements
Dr Wye-Khay Fong is the recipient of a Victorian Postdoctoral Research Fellowship. Prof. Ben J. Boyd is the recipient of an Australian Research Council Future Fellowship. Part of this research was undertaken on the SAXS/WAXS beamline at the Australian Synchrotron. The authors thank Samy Boulos (Laboratory of Food Biochemistry, ETH Zürich) for assistance with the HPLC studies.References
- I. D. Azmi, S. M. Moghimi and A. Yaghmur, Ther. Delivery, 2015, 6, 1347–1364 CrossRef CAS PubMed.
- C. E. Conn and C. J. Drummond, Soft Matter, 2013, 9, 3449–3464 RSC.
- A. Zabara and R. Mezzenga, J. Controlled Release, 2014, 188, 31–43 CrossRef CAS PubMed.
- R. Mezzenga, P. Schurtenberger, A. Burbidge and M. Michel, Nat. Mater., 2005, 4, 729–740 CrossRef CAS PubMed.
- E. M. Landau and J. P. Rosenbusch, Proc. Natl. Acad. Sci. U. S. A., 1996, 93, 14532–14535 CrossRef CAS.
- E. Nazaruk, R. Bilewicz, G. Lindblom and B. Lindholm-Sethson, Anal. Bioanal. Chem., 2008, 391, 1569–1578 CrossRef CAS PubMed.
- J. Clogston and M. Caffrey, J. Controlled Release, 2005, 107, 97–111 CrossRef CAS PubMed.
- A. Angelova, B. Angelov, R. Mutafchieva, S. Lesieur and P. Couvreur, Acc. Chem. Res., 2011, 44, 147–156 CrossRef CAS PubMed.
- S. Milak and A. Zimmer, Int. J. Pharm., 2015, 478, 569–587 CrossRef CAS PubMed.
- A. Chemelli, M. Maurer, R. Geier and O. Glatter, Langmuir, 2012, 28, 16788–16797 CrossRef CAS PubMed.
- A. Angelova, B. Angelov, B. Papahadjopoulos-Sternberg, M. Ollivon and C. Bourgaux, Langmuir, 2005, 21, 4138–4143 CrossRef CAS PubMed.
- S. Phan, W. K. Fong, N. Kirby, T. Hanley and B. J. Boyd, Int. J. Pharm., 2011, 421, 176–182 CrossRef CAS PubMed.
- R. Negrini and R. Mezzenga, Langmuir, 2012, 28, 16455–16462 CrossRef CAS PubMed.
- E. Nazaruk, M. Szlezak, E. Gorecka, R. Bilewicz, Y. M. Osornio, P. Uebelhart and E. M. Landau, Langmuir, 2014, 30, 1383–1390 CrossRef CAS PubMed.
- K. Lindell, J. Engblom, M. Jonströmer, A. Carlsson and S. Engström, Prog. Colloid Polym. Sci., 1998, 108, 111–118 CAS.
- L. Sagalowicz, S. Guillot, S. Acquistapace, B. Schmitt, M. Maurer, A. Yaghmur, L. de Campo, M. Rouvet, M. Leser and O. Glatter, Langmuir, 2013, 29, 8222–8232 CrossRef CAS PubMed.
- G. C. Shearman, O. Ces, R. H. Templer and J. M. Seddon, J. Phys.: Condens. Matter, 2006, 18, S1105–S1124 CrossRef CAS PubMed.
- J. M. Seddon, G. Cevc, R. D. Kaye and D. Marsh, Biochemistry, 1984, 23, 2634–2644 CrossRef CAS PubMed.
- W. K. Fong, T. L. Hanley, B. Thierry, A. Tilley, N. Kirby, L. J. Waddington and B. J. Boyd, Phys. Chem. Chem. Phys., 2014, 16, 24936–24953 RSC.
- A. I. Tyler, H. M. Barriga, E. S. Parsons, N. L. McCarthy, O. Ces, R. V. Law, J. M. Seddon and N. J. Brooks, Soft Matter, 2015, 11, 3279–3286 RSC.
- J. Engblom, Y. Miezis, T. Nylander, V. Razumas and K. Larsson, Prog. Colloid Polym. Sci., 2000, 116, 9–15 CAS.
- C. Fong, T. Le and C. J. Drummond, Chem. Soc. Rev., 2012, 41, 1297–1322 RSC.
- A. Yaghmur, L. de Campo, L. Sagalowicz, M. E. Leser and O. Glatter, Langmuir, 2006, 22, 9919–9927 CrossRef CAS PubMed.
- J. M. Seddon, A. M. Squires, C. E. Conn, O. Ces, A. J. Heron, X. Mulet, G. C. Shearman and R. H. Templer, Philos. Trans. R. Soc., A, 2006, 364, 2635–2655 CrossRef CAS PubMed.
- H. M. Barriga, A. I. Tyler, N. L. McCarthy, E. S. Parsons, O. Ces, R. V. Law, J. M. Seddon and N. J. Brooks, Soft Matter, 2015, 11, 600–607 RSC.
- S. Peng, Q. Guo, T. C. Hughes and P. G. Hartley, Langmuir, 2014, 30, 866–872 CrossRef CAS PubMed.
- W. K. Fong, T. Hanley and B. J. Boyd, J. Controlled Release, 2009, 135, 218–226 CrossRef CAS PubMed.
- R. Negrini, W. K. Fong, B. J. Boyd and R. Mezzenga, Chem. Commun., 2015, 51, 6671–6674 RSC.
- W. K. Fong, T. L. Hanley, B. Thierry, A. Hawley, B. J. Boyd and C. B. Landersdorfer, J. Controlled Release, 2016, 228, 67–73 CrossRef CAS PubMed.
- J. J. Vallooran, S. Handschin, S. Bolisetty and R. Mezzenga, Langmuir, 2012, 28, 5589–5595 CrossRef CAS PubMed.
- J. J. Vallooran, R. Negrini and R. Mezzenga, Langmuir, 2013, 29, 999–1004 CrossRef CAS PubMed.
- C. Montis, B. Castroflorio, M. Mendozza, A. Salvatore, D. Berti and P. Baglioni, J. Colloid Interface Sci., 2015, 449, 317–326 CrossRef CAS PubMed.
- W. K. Fong, R. Negrini, J. J. Vallooran, R. Mezzenga and B. J. Boyd, J. Colloid Interface Sci., 2016, 484, 320–339 CrossRef CAS PubMed.
- A. Salonen, F. Muller and O. Glatter, Langmuir, 2008, 24, 5306–5314 CrossRef CAS PubMed.
- W. Buchheim and K. Larsson, J. Colloid Interface Sci., 1987, 117, 582–583 CrossRef CAS.
- M. Nakano, T. Teshigawara, A. Sugita, W. Leesajakul, A. Taniguchi, T. Kamo, H. Matsuoka and T. Handa, Langmuir, 2002, 18, 9283–9288 CrossRef CAS.
- A. Yaghmur and O. Glatter, Adv. Colloid Interface Sci., 2009, 147–148, 333–342 CrossRef CAS PubMed.
- J. L. Zhai, T. M. Hinton, L. J. Waddington, C. Fong, N. Tran, X. Mulet, C. J. Drummond and B. W. Muir, Langmuir, 2015, 31, 10871–10880 CrossRef CAS PubMed.
- T. M. Hinton, F. Grusche, D. Acharya, R. Shukla, V. Bansal, L. J. Waddington, P. Monaghan and B. W. Muir, J. Toxicol. Res., 2014, 3, 11–22 RSC.
- B. J. Boyd, Int J Pharmaceut, 2003, 260, 239–247 CrossRef CAS PubMed.
- C. Moitzi, S. Guillot, G. Fritz, S. Salentinig and O. Glatter, Adv. Mater., 2007, 19, 1352–1358 CrossRef CAS.
- B. W. Muir, G. Zhen, P. Gunatillake and P. G. Hartley, J. Phys. Chem. B, 2012, 116, 3551–3556 CrossRef CAS PubMed.
- A. Yaghmur, P. Laggner, B. Sartori and M. Rappolt, PLoS One, 2008, 3, e2072 Search PubMed.
- S. Salentinig, L. Sagalowicz and O. Glatter, Langmuir, 2010, 26, 11670–11679 CrossRef CAS PubMed.
- G. Cevc, J. M. Seddon, R. Hartung and W. Eggert, Biochim. Biophys. Acta, 1988, 940, 219–240 CrossRef CAS.
- T. L. Andresen, D. H. Thompson and T. Kaasgaard, Mol. Membr. Biol., 2010, 27, 353–363 CrossRef CAS PubMed.
- A. Arouri, A. H. Hansen, T. E. Rasmussen and O. G. Mouritsen, Curr. Opin. Colloid Interface Sci., 2013, 18, 419–431 CrossRef CAS.
- S. Salentinig, S. Phan, J. Khan, A. Hawley and B. J. Boyd, ACS Nano, 2013, 7, 10904–10911 CrossRef CAS PubMed.
- S. Salentinig, L. Sagalowicz, M. E. Leser, C. Tedeschi and O. Glatter, Soft Matter, 2011, 7, 650–661 RSC.
- J. S. Patton and M. C. Carey, Science, 1979, 204, 145–148 CAS.
- W. K. Fong, S. Salentinig, C. A. Prestidge, R. Mezzenga, A. Hawley and B. J. Boyd, Langmuir, 2014, 30, 5373–5377 CrossRef CAS PubMed.
- L. Hong, S. Salentinig, A. Hawley and B. J. Boyd, Langmuir, 2015, 31, 6933–6941 CrossRef CAS PubMed.
- L. Michaelis and M. L. Menten, Biochem. Z., 1913, 49, 333–369 CAS.
- A. Mauceri, S. Borocci, L. Galantini, L. Giansanti, G. Mancini, A. Martino, L. Salvati Manni and C. Sperduto, Langmuir, 2014, 30, 11301–11306 CrossRef CAS PubMed.
- W. Wijagkanalan, Y. Higuchi, S. Kawakami, M. Teshima, H. Sasaki and M. Hashida, Mol. Pharm., 2008, 74, 1183–1192 CrossRef CAS PubMed.
- K. Shimada, J. A. A. M. Kamps, J. Regts, K. Ikeda, T. Shiozawa, S. Hirota and G. L. Scherphof, Biochim. Biophys. Acta, Biomembr., 1997, 1326, 329–341 CrossRef CAS.
- S. Aleandri, A. Casnati, L. Fantuzzi, G. Mancini, G. Rispoli and F. Sansone, Org. Biomol. Chem., 2013, 11, 4811–4817 CAS.
- D. B. Warren, M. U. Anby, A. Hawley and B. J. Boyd, Langmuir, 2011, 27, 9528–9534 CrossRef CAS PubMed.
- N. M. Kirby, S. T. Mudie, A. M. Hawley, D. J. Cookson, H. D. T. Mertens, N. Cowieson and V. Samardzic-Boban, J. Appl. Crystallogr., 2013, 46, 1670–1680 CrossRef CAS.
- S. T. Hyde, in Handbook of Applied Surface and Colloid Chemistry, ed. K. Holmberg, John Wiley & Sons, 2002 Search PubMed.
- X. L. Ye, X. G. Li, C. B. Shu, S. H. Cheng and Q. Wang, Colloids Surf., A, 2000, 175, 249–255 CrossRef.
- G. C. Feast, O. E. Hutt, X. Mulet, C. E. Conn, C. J. Drummond and G. P. Savage, Chemistry, 2014, 20, 2783–2792 CrossRef CAS PubMed.
- J. N. Israelachvili, D. J. Mitchell and B. W. Ninham, J. Chem. Soc., Faraday Trans. 2, 1976, 72, 1525–1568 RSC.
- G. Cevc, J. M. Seddon and D. Marsh, Faraday Discuss., 1986, 81, 179–189 RSC.
- J. Clogston, G. Craciun, D. J. Hart and M. Caffrey, J. Controlled Release, 2005, 102, 441–461 CrossRef CAS PubMed.
- B. J. Boyd, I. Krodkiewska, C. J. Drummond and F. Grieser, Langmuir, 2002, 18, 597–601 CrossRef CAS.
- B. J. Boyd, C. J. Drummond, I. Krodkiewska, A. Weerawardena, D. N. Furlong and F. Grieser, Langmuir, 2001, 17, 6100–6107 CrossRef CAS.
- A. Reddy and F. Maley, J. Biol. Chem., 1996, 271, 13953–13957 CrossRef CAS PubMed.
- P. R. Cullis and B. De Kruijff, Biochim. Biophys. Acta, 1978, 507, 207–218 CrossRef CAS.
- M. Kang, G. Huang and C. Leal, Soft Matter, 2014, 10, 8846–8854 RSC.
Footnote |
| † Electronic supplementary information (ESI) available. See DOI: 10.1039/c6ra26688f |
| This journal is © The Royal Society of Chemistry 2017 |