 Open Access Article
Membrane properties and anti-bacterial/anti-biofouling activity of polysulfone–graphene oxide composite membranes phase inversed in graphene oxide non-solvent†
V. R. S. S. Mokkapati*ab,
Derya Yuksel Koseoglu-Imercd,
Nurmiray Yilmaz-Devecie,
Ivan Mijakovica and
Ismail Koyuncucd
aDepartment of Biology and Biological Engineering, Chalmers University of Technology, Kemivagen 10, 41296, Goteborg, Sweden. E-mail: ragmok@chalmers.se
bNanotechnology Research and Application Center (SUNUM), Sabanci University, Orhanli/Tuzla, Istanbul 34956, Turkey
cDepartment of Environmental Engineering, Istanbul Technical University, 34469, Istanbul, Turkey
dNational Research Center on Membrane Technologies, Istanbul Technical University, 34469, Istanbul, Turkey
eNanoscience and Nanoengineering Department, Istanbul Technical University, 34469, Istanbul, Turkey
First published on 16th January 2017
Abstract
A new and facile method for the fabrication of polysulfone–graphene oxide composite membranes is reported, where after casting, phase inversion is carried out with graphene oxide flakes (GO) in a coagulation bath. The membranes were characterized and the morphology was analysed using scanning electron microscopy. A bacterial inhibition ratio of 74.5% was observed with membranes fabricated from a very low concentration of di-water–GO non-solvent (0.048% of GO). The membranes were successfully tested for permeate flux and fouling resistance using activated sludge filtration from an MBR system. The observed trend shows that GO can operate as a protective barrier for membrane pores against the bacterial community. To our knowledge this is the first time where the immersion precipitation mechanism was carried out in a coagulation bath with GO flakes under continuous stirring. Using this method, a very low concentration of GO is required to fabricate membranes with conventional GO composite membrane properties and better selectivity.
Introduction
Anti-bacterial activity of graphene and graphene derivatives has attracted considerable attention of the scientific community, although many controversies around this issue remain to be resolved.1 In particular, graphene oxide (GO) in combination with several polymers has been extensively studied, and is reported to be more effective in specific concentrations against certain types of bacteria.2 In addition, GO has also been surface modified3 and/or doped4 to increase its anti-bacterial performance. Recently, it has also been established that the flake size of GO plays an important role.5,6While considering the anti-bacterial activity of GO as a function, it is also equally important to consider the parameters and aspects of GO integration with the polymer. Most common method of GO integration within membrane matrix is by wet phase inversion7–9 (immersion precipitation), where after casting, the polymer solution blended with GO is phase inversed in a coagulation bath with a non-solvent. During phase inversion, the solvent from the polymer solution is removed resulting in a porous solidified membrane. The method of phase inversion also depends on the type of polymer and the solvent used to dissolve the polymer. The membrane structure after the phase inversion is the combination of phase separation and mass transfer. The two most important questions that arise during membrane formation are:
(1) What exactly happens during the phase inversion process? And (2) what is the effect of the particulates (from non-solvent which is generally di-water) on the morphology and properties of the solidified membranes?
(1) The development of asymmetric membranes has been a significant step towards the application of ultrafiltration for high filtration rates.10 The properties of the fabricated membranes can be controlled by various parameters like choice of polymer, solvent and the non-solvent.11 Phase transition is carried out due to the interchange of solvent and non-solvent by diffusion12 in which a homogenous polymer solution is transformed into two phase systems: (a) a solid polymer rich phase which forms the membrane and (b) liquid polymer poor phase which forms the pores.13,14 In this process, precipitation of the polymer is carried out by solvent loss and non-solvent penetration.
(2) In our study we present a new and facile method for the fabrication of polysulfone (PSF)–GO composite membranes where after polymer casting, films were phase inversed in GO–di-water coagulation solution rather than in only di-water. The membranes were characterized for their physical and surface properties which fared far better compared to the membranes fabricated earlier15 with much higher GO concentrations, which were phase inversed in di-water. We also discuss the effect of GO flakes ratio on the properties of these fabricated membranes.
Experimental
Materials and methods
Polysulfone (PSF) was purchased from Solvay (UdelPSU 3500, Mw = 77![[thin space (1/6-em)]](https://www.rsc.org/images/entities/char_2009.gif) 000 Da) and polyvinylpyrrolidone (PVP) (Mw = 35
000 Da) and polyvinylpyrrolidone (PVP) (Mw = 35![[thin space (1/6-em)]](https://www.rsc.org/images/entities/char_2009.gif) 000) was purchased from ISP (USA). N,N-Methyl pyrrolidine (NMP) was purchased from Sigma and used as a solvent. Graphene oxide (GO) was purchased from Graphene Supermarket Inc (USA), having a flake size of 0.5 to 5 microns with atleast 60% being one atomic layer. All chemicals in this study were used without further purification.
000) was purchased from ISP (USA). N,N-Methyl pyrrolidine (NMP) was purchased from Sigma and used as a solvent. Graphene oxide (GO) was purchased from Graphene Supermarket Inc (USA), having a flake size of 0.5 to 5 microns with atleast 60% being one atomic layer. All chemicals in this study were used without further purification.
Fabrication of bare and graphene oxide composite membranes
PSF dope solution was prepared at room temperature and the quantities were determined according to wt%. The membranes were casted using an aluminum casting knife followed by solvent evaporation and phase inversion in GO coagulation solution (except for the control membrane where the phase inversion was carried in di-water as non-solvent).Immersion precipitation method was used to fabricate the bare (polymer) and GO integrated membranes (composite). In the first step, PVP (6%, w/w) was added to the solvent (NMP) under continuous stirring for approximately 20 min until it was completely dissolved, followed by the addition of PSF pellets (16%, w/w) and left for 24 h in order to obtain homogeneous solution. PVP was used as a hydrophilic additive and pore agent and its concentration was selected as 6% (w/w) according to literature studies16–18 for the fabrication of finger-like membrane cross section. PVP increases the viscosity of the cast film and this slows down the diffusional exchange rate of the solvent (NMP) and non-solvent (di-water) during the membrane formation in the coagulation bath. So, the change in PVP concentration changes the rate of phase inversion resulting in sponge-like or finger-like cross-section membrane morphology.19
After the preparation of casting solution, the solution was kept in an ultrasonic bath for 2 h followed by membrane casting. The casting solution was flattened using a casting knife (180 microns) followed by phase inversion of the casted membrane in GO solution bath which was maintained under continuous stirring.
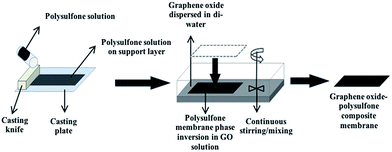
An automatic film applicator (Cambridge, UK, Sheen automatic film applicator) with a casting knife (with adjustable thickness) was used for membrane casting. A specific volume of homogeneous dope solution was poured on a glass surface followed by casting the PSF solution with a constant velocity (100 mm s−1). The film was left for 10–20 s for the solvent to evaporate, followed by placing the casted solution along with the glass plate in a coagulation bath with di-water for phase inversion. The same process was followed to fabricate GO integrated membranes, except that the phase inversion was carried out in different concentrations of GO for different membranes (Fig. 1). Graphene oxide solution concentrations: 1/60 = 0.009%, 1/40 = 0.012%, 1/20 = 0.024%, 1/10 = 0.048% (all these concentrations were calculated from the GO stock of 497 mg/100 mL). Three sets of membranes were fabricated for each GO concentration. For each membrane that was casted for a specific GO concentration, GO solution was replaced with a fresh solution to maintain the initial GO concentration. The fabricated membranes were further transferred to a bath filled with distilled water to prevent any biological growth and to evaporate the remaining solvent.
Membrane characterization methods
Permeability experiments were carried out using a dead-end stirred cell filtration system (Sterlitech, HP4750) pressurized with nitrogen gas. For all the experiments, the membranes were initially compacted at 10 bar for 1 h followed by monitoring the flux profile gravimetrically in real time. At least three different membranes were subjected to hydraulic membrane permeability at different transmembrane pressures ranging from 2–4 bar. Properties of the filtration system are indicated in Table 1.| Parameter | Value |
|---|---|
| Membrane diameter | 49 mm |
| Active membrane area | 14.6 cm2 |
| Volume | 300 mL |
| Maximum pressure | 69 bar |
| Maximum temperature | 121 °C |
Permeability is calculated using the equation:
 | (1) |
Permeability tests were carried out for at least 3 times for all the mentioned membranes with and without GO.
The contact angles of the membranes were measured on KSV Attension Theta contact angle device using sessile drop mode on dried membranes. For ensuring the accuracy of the measurement, the analysis was performed at four different locations on the membranes. The roughness values (RMS) of membranes were determined with optic profilometer (Digital Instruments). Before observations, the membranes were dried at room temperature. Membrane samples were fixed on a glass slide and scanned over 10.0 μm × 10.0 μm.
The cross-section morphologies of the resulted membranes were directly observed with SEM (Philips-XL30 SFEG) in high vacuum mode after coating with a thin layer of gold to observe the pore structure. Before the SEM analysis, the membrane samples were immersed in ethanol/water solutions at room temperature followed by step dehydration with 25, 50, 75 and 100% ethanol for 10 min. The membranes were then dried at room temperature to be ready for SEM scan.
The mechanical properties of bare and GO nanocomposite membranes were measured using SII DMS 6100 Exstar dynamic mechanical analyzer. Membranes were mounted between the grips and fastened. A cross sectional thickness measuring device was used to calculate the cross sectional area of the membranes. Data was taken every three seconds at force increments of 250 N over 20 steps for a total load of 5000 N. For each sample, measurements were performed in triplicates and the average Young's modulus values were reported.
For surface charge analysis of the membranes, streaming current measurements were performed with an electrokinetic analyser (SurPASS, Anton Paar GmbH, Austria) using a measuring cell for solid samples with a planar surface. For each measurement, membrane samples of 20 mm × 10 mm were fixed on sample holders using double sided adhesive tape. The sample holders were inserted into the adjustable-gap cell, such that the membrane surfaces were facing each other. A gap of 100 μm was set between the sample surfaces. Prior to sample mounting, the membranes were soaked in 10−3 mol L−1 KCl solution for 24 h. Before starting the measurement, the samples were thoroughly rinsed with measuring electrolyte. A 10−3 mol L−1 KCl solution was used as the background electrolyte and the pH of this aqueous solution was adjusted to 6.2 with 0.1 M HCl. The measurements were repeated twice for different membrane samples.
The attenuated total reflectance Fourier transform infrared (ATR-FTIR) spectroscopy was used to analyze the functional groups of GO on the membrane surface. The infrared spectra of the samples was recorded in the range 4000–400 cm−1 on a Perkin Elmer ATR-FTIR spectrophotometer.
The anti-bacterial properties of PSF–GO composite membranes phase inversed in graphene oxide non-solvent were investigated by culturing Escherichia coli bacteria on membrane surfaces with disc diffusion test. E. coli was firstly cultured in Luria Broth. The initial amount of E. coli was 210 CFU mL−1. The membranes were firstly washed with phosphate buffer saline (PBS) and then introduced into the bacterial medium after 2 hours. This procedure was repeated three times to ensure that all E. coli bacteria in the culture medium were bond for creating the bacterial environment on the membrane surface. Further, the membranes were placed on the agar surface (middle of the plate). These agar plates were then placed in an incubator at 37 °C for 48 h. After 48 h the agar plates were visually observed and counted for the growth of bacteria colonies.
In order to explore the activated sludge fouling resistances of bare and GO composite membranes, filtration experiments were performed using real activated sludge. Activated sludge suspension was taken from the aeration tank of laboratory scale membrane bioreactor (MBR) system. Glucose, (NH4)2SO4 and peptone, K2HPO4 and KH2PO4 were used as carbon, nitrogen and phosphorus sources, respectively. Additional trace metals and alkalinity (NaHCO3) were also supplied to the tank. The sludge characteristics are summarized in Table 2.
| Parameters | Values |
|---|---|
| a EPS: extracellular polymeric substances. | |
| MLSS concentration (mg L−1) | 10![[thin space (1/6-em)]](https://www.rsc.org/images/entities/char_2009.gif) 050 ± 136 050 ± 136 |
| Viscosity (cP) (at 25 °C) | 2.3 |
| The protein concentration of soluble EPSa (mg L−1) – sEPSp | 74.6 ± 1.8 |
| The carbohydrate concentration of soluble EPS (mg L−1) – sEPSc | 57.2 ± 2.8 |
| The protein concentration of bound EPS (mg protein per g MLSS) – bEPSp | 27.0 ± 3.2 |
| The carbohydrate concentration of bound EPS (mg carbohydrate per g MLSS) – bEPSc | 21.8 ± 2.3 |
| Average particle size (μm) | 13.7 |
Activated sludge filtrations were conducted at 3 bar and 1 h using the dead-end stirred filtration cell. The permeate flux was evaluated as gravimetrically. Filtration or fouling resistances are calculated as following;
| Rt = Rm + Rp + Rc |
| Rc = Rt − Rp − Rm |
Results and discussion
Membrane characterization
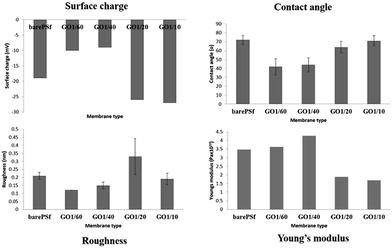
Fig. 2 graphically shows the membrane characterization results. In surface charge graph, the membranes with high GO content (1/20 and 1/10) have more negative surface charge while low GO content membranes (1/60 and 1/40) have more positive surface charge compared to bare PSF and high GO content membranes.The contact angle data shows an interesting trend where the membranes with low GO content (1/60 and 1/40) tend to be more hydrophilic compared to bare PSF and high GO content (1/20 and 1/10). Xu et al. explained that the improved hydrophilicity of GO is due to the oxygen-containing functional groups that migrate spontaneously to the membrane surface to reduce the interface energy during the phase inversion process, which makes the membrane surface more hydrophilic.20 With increasing GO concentrations there is an increase in contact angle which means that more GO within the coagulation bath caused more hydrophobic membrane surface than low GO content.
The roughness values of membranes with high GO concentration (1/20 and 1/10) are found to be higher than the membranes with low GO concentrations (1/60 and 1/40) and bare PSF membrane (ESI 2†).
The Young's modulus value of high GO concentrations (1/20 and 1/10) membranes is lower than other membranes. High GO concentration membranes show reduced mechanical membrane stability. These differences between the membranes with low and high GO concentrations showed that the GO flakes in coagulation bath changed the membranes structure and/or morphology depending on the GO ratio. The amount of dissolved GO affected the thermodynamic and kinetic of phase inversion process such as diffusional exchange rate of solvent (NMP) and non-solvent. This is explained by Meng et al.,21 that the exchange of solvent and non-solvent during the phase inversion process dramatically decreases in the presence of trace GO nanosheets within the coagulation bath. It was indicated that no or less pores were formed in the areas covered by GO nanosheets due to lack of solvent and non-solvent exchange during membrane formation. The decrease in solvent/non-solvent exchange rate changed the GO location along the membrane matrix further affecting the physical properties (surface charge, roughness, contact angle and mechanical properties) of the resulted membrane.
In our study, it can be said that GO flakes in the coagulation bath differently settled down within the membranes of low and high GO concentrations. Addition of GO slowed down the solvent–non-solvent exchange in the coagulation bath compared to only di-water coagulation bath. Increase in GO concentration decreased the exchange rate. Thus, the membrane formation slowed down with increasing GO concentration, there by increasing the thickness of the membrane skin layer due to the stacking of more GO flakes. Due to this reason, high GO concentration has resulted in higher negative surface (naturally GO has negative charge), high surface roughness (irregular stacking) and low mechanical stability (due to macro-void formation). At low GO concentrations, the exchange rate is faster and GO flakes may tend to accumulate along the membrane matrix (thin skin layer and also sub-layer) while GO flakes may settle down within the thick skin layer in high GO concentration membranes due to slow water direction through the phase inversion process.
From the FTIR spectra (ESI 1†) it can be observed that the peak intensity at 1712–1713 cm−1 increases with the increase in GO concentration. This peak is attributed to C![[double bond, length as m-dash]](https://www.rsc.org/images/entities/char_e001.gif) O and specific for GO and its dispersity which is not observed in bare PSF. The broad band between 3000 cm−1 and 3650 cm−1 attributes to O–H functional group stretching from graphene oxide surface (this band is not shown in the image as it is common for all the acquired data).15,22 The peak at 1293 cm−1 in bare PSF spectrum corresponds to the O
O and specific for GO and its dispersity which is not observed in bare PSF. The broad band between 3000 cm−1 and 3650 cm−1 attributes to O–H functional group stretching from graphene oxide surface (this band is not shown in the image as it is common for all the acquired data).15,22 The peak at 1293 cm−1 in bare PSF spectrum corresponds to the O![[double bond, length as m-dash]](https://www.rsc.org/images/entities/char_e001.gif) S
S![[double bond, length as m-dash]](https://www.rsc.org/images/entities/char_e001.gif) O asymmetric stretching while the peak at 1148 cm−1 corresponds to symmetric stretching of O
O asymmetric stretching while the peak at 1148 cm−1 corresponds to symmetric stretching of O![[double bond, length as m-dash]](https://www.rsc.org/images/entities/char_e001.gif) S
S![[double bond, length as m-dash]](https://www.rsc.org/images/entities/char_e001.gif) O. The absorption band at 1241 cm−1 is attributed to asymmetric stretching of C–O–C group.22
O. The absorption band at 1241 cm−1 is attributed to asymmetric stretching of C–O–C group.22
Membrane morphology
The cross-sectional morphologies of the bare and GO composite membranes can be seen in Fig. 3. All the fabricated membranes have an asymmetric structure with finger-like pores (due to high PVP concentration). As seen in the figure below, bottom layer macro-voids are seen in bare PSF (hole-like macro-void) and in highest GO concentration membranes (1/10) (finger-like macro-void). It is observed that high amounts of GO generate largest macro-voids (in GO 1/10 membrane), which slows down the water passage from the membranes (discussed in permeability results). It can be said that increasing GO concentrations affect the membrane morphology negatively. Higher GO concentration membranes have more GO flakes, resulting in accumulation which is observed in the bottom layer of the membrane.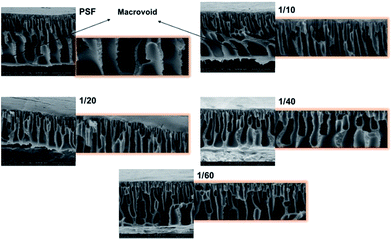 | ||
| Fig. 3 Cross section SEM images of PSF and PSF–GO composite membranes phase inversed in di-water–GO non-solvent. | ||
The formation of membranes is a dynamic process where along with phase equilibrium, kinetics of phase separation is also involved.23 The polymer solution after casting is subjected to the exchange of solvent and non-solvent, which is guided by diffusion, and ultimately resulting in the increase of non-solvent within the film. Due to the increase in non-solvent, the polymer solution becomes thermodynamically unstable leading to phase separation.23 This instability could be caused by the loss of solvent, increase in non-solvent or increase in temperature. The formation of the membranes by phase inversion takes place by nucleation and growth, which means that the time available for precipitation is an important factor.
Relation between mass transfer and rate of nucleation?
During phase inversion, the factor that determines the skin formation is the local polymer concentration in the top layer of the polymeric solution. Phase inversion can be carried out in different ways, such as vapour phase precipitation, precipitation by controlled evaporation etc. In our work we discuss only the phase inversion by immersion precipitation. During immersion, solvent depletion from the top layer is rapid, which results in the increase of polymer concentration in the top layer. This increase will generate the platform for gelation of the system, which in turn is favoured by the penetration of non-solvent.23
Does addition of additives (GO in our case) result in a denser skin and a more selective membrane?
To develop a more selective membrane three important parameters are to be specifically noted: higher initial polymer concentration, lower tendency of the non-solvent to induce liquid–liquid phase separation and lower temperature of the coagulation bath. All these three parameters favour the supersaturation in the top layer before nucleation sets in.23
Here we specifically discuss lower tendency of the non-solvent to induce liquid–liquid phase separation. According to Wijmans et al., if the non-solvent penetration in to the cast film is of lower tendency, there is a delay for the onset of gelation. In other terms, as long as there is not enough loss of solvent from the cast film, the gelation of the cast film is not achieved and supersaturation is favoured. Addition of certain additives to the coagulation bath and the choice of non-solvent serves the purpose in forming a denser skin and a more selective membrane. If sufficient solvent is added to non-solvent, microporous structure without skin is formed. So with just non-solvent and small additives, the membrane will be denser and more selective due to low solvent–non-solvent exchange rate.
For ease of description (Fig. 4) we refer to conventional phase inversed membranes as type 1 (A1 and A2) and di-water–GO phase inversed membranes as type 2 (B1 and B2).
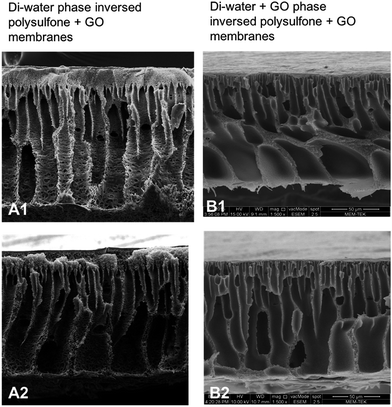 | ||
| Fig. 4 Cross section SEM images of conventional di-water phase inversed PSF–GO composite membranes (A1 and A2) vs. PSF–GO composite membranes phase inversed in di-water–GO non-solvent (B1 and B2). | ||
In Fig. 4, a comparison between the membranes which were phase inversed in di-water (type 1) and GO + di-water (type 2) can be observed. Type 1 membranes show much higher porous structure compared to the type 2 membranes (though the pore size is almost identical). This is due to the fact that by adding solvent to non-solvent, or adding some other particulates to non-solvent before phase inversion, delays the phase inversion, resulting in a thicker skin (the thickness depends on the concentration of the particulates). Fig. 4 shows the morphology of the skin of both type 1 and type 2 membranes. In type 1 membranes the cross-section images show porous skin, whereas in type 2 membranes (Fig. 4B1) the skin layer is almost non-porous.
In Fig. 5, the difference in the porosity can be clearly observed between the type 2 membranes: B1 (high GO concentration) and B2 (low GO concentration). B1 with high GO concentration has less pores compared to B2, which clearly supports the notion that the GO concentration within the coagulation bath is proportional to the density of the skin.
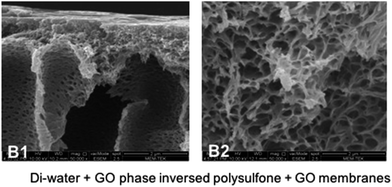 | ||
| Fig. 5 SEM (cross section) images showing the pore morphology of membranes with high (B1) and low (B2) concentrations of GO in di-water–GO non-solvent respectively. | ||
As observed in Fig. 5B1, the absence of very small pores directly under the skin layer is a result of optimal initial polymer concentration.23
In addition to the pores, if we examine the membranes on a much larger scale, one detects a lot of voids which range up to a few micrometres in length. These voids are typical for the membranes prepared by wet phase inversion and several mechanisms have been proposed for their formation.24–26 We do not discuss this mechanism here, as both the mentioned membranes in this work (di-water phase inversed and di-water–GO phase inversed membranes) were fabricated by wet phase inversion (immersion precipitation) and it is out of the scope of our work.
Further, these membranes were used successfully to study the permeability, anti-bacterial activity and permeate flux of activated sludge.
Water permeability
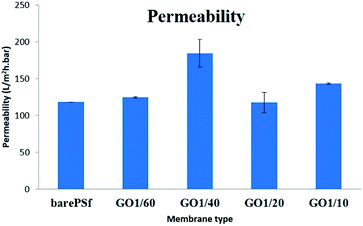
As seen in permeability graph (Fig. 6), there is an increasing trend from bare PSF to GO 1/40 but the increase of GO content decreased the membrane permeability because of denser skin layer. Initially, addition of GO increased the water permeability to 158 L m−2 h−1 bar−1 (for GO 1/40). Increase in the permeability generally is explained with increase in the surface pore size27 or porosity and the surface hydrophilicity.28 Whereas, the decrease of permeability in composite membranes is explained with lower solubility of nanoflakes with in polymer solution that hold between the polymer chains thereby clogging the pores at membrane surface and prevents the passage of water.29 In our case, the possible reason for changing permeability of GO membranes can be explained with de-mixing pattern in phase inversion. Addition of GO flakes to the coagulation bath causes delay or slows the phase inversion rate (exchange solvent/non-solvent) and this changes the thickness and morphology of the skin and sub-layer membranes. Therefore, the membranes with high GO concentration has thicker and denser skin layer, thereby resulting in lower permeability values compared to low GO concentration membranes. The reason of this is low porous sub-structure and thicker skin layer at high GO concentration. From these results, it can be concluded that the addition of optimum GO (1/40) to the coagulation bath resulted in the dominance of solvent/non-solvent de-mixing in coagulation bath and was responsible for the synergistic effect of good porous structure and hydrophilic surface with high water permeability.Anti-bacterial and anti-biofouling performance of the membranes
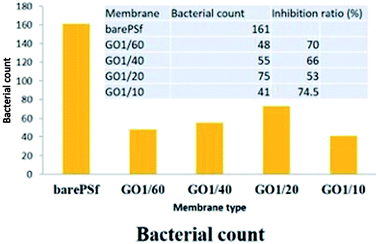
The accumulation of micro-organisms or any other living forms on a wet surface is referred to as biofouling. In membrane applications, biofouling causes the reduction of membrane performance, bio-degradation and increase in power consumption. Polymeric membranes are most commonly used in filtration applications, where, after certain period of time the membranes start fouling. Membrane modification by adding inorganic or organic fillers to the membrane matrix is very popular and a useful way for preventing the biofouling with different pore structures, surface properties, and mechanical properties of the modified membranes.30 Graphene oxide is one of the organic fillers and is used for anti-fouling31–33 or anti-biofouling activity.34 The anti-biofouling effect of GO within the membranes was explained by its hydrophilicity, negative charge, and surface smoothness.35,36 The other anti-bacterial mechanism of GO in membranes was explained with oxidative stress caused by interaction with the basal planes of GO.37In anti-bacterial tests, the bacterial growth in agar plates with GO membranes was observed to be relatively lower compared to bare PSF membrane (Fig. 8). Bacterial count is graphically represented in Fig. 7. Anti-bacterial effect by membrane and oxidative stress with reactive oxygen species (ROS) is being induced on the bacterial cells when in contact with GO membranes, thereby damaging the cell membrane. Certain parameters like the size of the GO flakes, orientation and functional groups density also play an important role. Though there are several established theories which relate to the anti-bacterial activity of GO, GO induced ROS generation theory is gaining a wide acceptance38 where when the bacterial cells come in contact with graphene oxide and/or other graphene derivatives, oxidative stress is induced by reactive oxygen species (ROS) generation. According to Mokhir et al.,39 it is the endoperoxides derived from GO that are responsible for the toxicity. GO that has been obtained by oxidation with KMnO4 contains carbon radicals,40 manganese ions41 and endoperoxides. The existence of endoperoxides have been predicted by ab initiation calculations42 as well as supported by experimental evidence.43
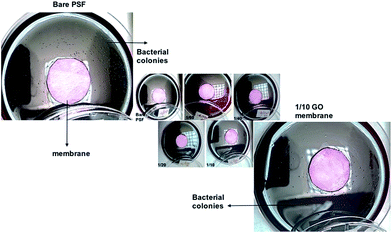 | ||
| Fig. 8 Agar plates with fabricated membranes incubated with E. coli colonies were counted after 24 h. | ||
There are two important factors that are to be considered regarding the toxicity of GO: (1) exposure of GO to UV and (2) life time of GO.
By treating GO with UV radiation the endoperoxides can be removed rendering GO to be non-toxic.39 So, in order to retain the toxicity of GO, it should not be treated with UV, or at least not for longer times.
According to Mokhir et al., the reactivity of GO gradually decreases after three weeks when stored at 4 °C. In our experiment this can be an important factor which is related to the anti-bacterial activity of GO. GO–PSF composite membranes after fabrication were stored in water for a week before characterization followed by repetitive storage times in cold room during the whole experiment. Our data in Fig. 7 suggest that the concentration of GO and anti-bacterial activity are proportional (except for 1/10). This means that the presence of endoperoxides is higher in 1/10 compared to the rest of the membranes, though not completely removed despite the membranes being stored in di-water for weeks. We attribute this to the concentration and stacking of GO flakes within the membrane.
If we compare the inhibition ratio of the GO membranes, it can be said that the increase in GO concentration decreases the inhibition ratio of GO membranes until GO 1/10. The maximum inhibition ratio was observed in highest GO concentration (1/10 GO) due to more GO flakes interaction with bacteria on the membrane surface. In 1/10 and 1/60 GO membranes, the flakes are well exposed to the bacterial environment, unlike in 1/40 and 1/20 in which the GO flakes did not enough interact with the bacteria cells.
Though our membranes were not subjected to UV and long term continuous storage under 4 °C, there is a slight inactivation of endoperoxides from GO flakes which is reflected in the anti-bacterial performance of the membranes. This is probably due to the on and off storage times of the membranes within di-water and cold room during the experimental process. Incorporation of endoperoxides within GO flakes and/or reduction of processing times of the membranes which directly avoids the cold room storage can increase the anti-bacterial activity of these membranes.
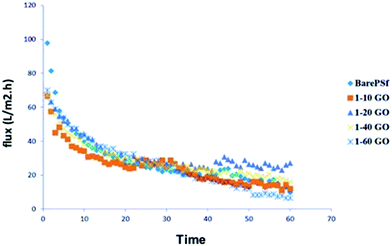
In anti-biofouling tests, real activated sludge was used because of its mixed bacterial environment. The permeate fluxes of membranes are graphically shown in Fig. 9. GO membranes show similar initial flux values while bare PSF shows higher initial flux probably due to more denser membrane layer. Whereas, the flux decline was lower in GO membranes than bare PSF, in other words, the filtration performance loss of GO membranes was lower than bare PSF. Among GO membranes, GO 1/20 and GO 1/40 membranes show better steady state flux values. GO 1/60 show the lowest steady state flux values. GO 1/20 and GO 1/40 composite membranes fared better compared to other membranes. We presume that this is due to the change in membrane surface characteristics with different ratios of GO, such as hydrophilicity, surface charge and roughness. In anti-bacterial tests, there is no pressure or filtration, so diffusion of GO would be the main factor (discussed earlier) against bacterial cells while in biofouling test, filtration is carried out with pressure so the membrane surface properties become dominant for initial bacterial attachment. High GO concentration membranes has high negative, hydrophobic and rougher surface. Hydrophobicity and rougher surfaces tend to accumulate bacterial cells very easily44 but negative surface is an important anti-biofouling parameter due to the negative surface charge of bacteria. Dominant factors for anti-biofouling among the membrane properties may vary according to the additive types. In GO membranes, the reason for the high flux of GO 1/20 membranes could probably be because of negative surface (−26 mV). Bacterial cells also have negative surface charge, which prevents the cell attachment on GO 1/20 membrane surface and so the increase in the flux value. However, increasing GO concentrations decreased the flux values due to dense membrane morphology. It can be said that the optimum GO concentration showed good anti-biofouling performance.
In order to explain the fouling phenomena of bare and GO composite membranes, resistance-in-series model was used and various filtration resistances were calculated and the results are graphically shown in the Fig. 10. Rm values of the composite membranes increased with increasing GO ratios. Membrane resistance is strongly dependent on the membrane characteristics (hydrophilicity, pore size distribution, thickness, etc.). In our experiments, Rm changed, especially with membrane hydrophilicity for GO composite membranes. The other resistance values indicated that Rp values decreased substantially with the increase in GO concentration of the composite membranes. Addition of GO increased Rc values of the membranes compared to bare PSF. The cake layer on membrane surface regulates the development of membrane biofouling45 and this phenomenon increases the cake resistance of the membranes. The bacteria and bacterial composition in activated sludge may clog the membrane pores or accumulate on the membrane surface. For GO composite membranes, these materials may mostly accumulate onto the membrane surface and stimulate an increase in cake resistance. Therefore, decrease in pore resistance (Rp) values with GO membranes can be observed, which is the main effect of severe membrane fouling. Xu et al. explained the low fouling mechanism of GO membranes with low adhesion forces between membrane and foulants where the adhesion forces were higher in bare membrane than GO membranes and so the flux of bare membranes severely declined due to the stronger adhesion force of the membrane-foulant.46 The adhesion force between the bacteria and bacterial products and the GO membranes should be weak, while it has to be strong between bacteria and bare PSF membrane. It will lead to an increase in the molecular adhesion between bacterial products and consequently, to more pore clogging in the membrane pores. The dominant factor of low pore fouling (which generally creates irreversible fouling) is the membrane surface charge. Depending on the surface charge values, GO 1/10 membrane has the highest negative surface thereby showing least pore resistance.
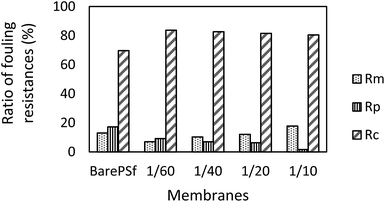 | ||
| Fig. 10 Filtration resistance data comparison between bare PSF and different concentrations of GO composite membranes. | ||
Conclusion
GO–PSF composite membranes were fabricated by wet phase inversion method (immersion precipitation) where the non-solvent was GO solution. The membranes were characterized for their physical and performance abilities. SEM characterization of these membranes revealed that they have a different pore structure compared to conventional di-water phase inversed membranes. When using our di-water–GO non-solvent phase inversion process, very low concentrations of GO are enough to reach the properties of conventional PSF–GO composite membranes. The membranes were successfully tested for anti-bacterial activity, with the best inhibition ratio of 74.5% achieved with the 1/10 GO concentration membranes (0.048% of GO). This correlates to the high hydrophilicity, more negative surface charge and low roughness of the membrane surface, along with the material properties of graphene oxide. The membranes were further tested with real activated sludge from MBR (molecular bio-reactor) system for treating waste water. With fouling resistance experiments, Rp values decreased substantially with the addition of GO to the membranes. This trend shows that graphene oxide can trade as a protective barrier for membrane pores.Acknowledgements
The authors would like to thank EC-Marie Curie Co-fund Circulation Scheme, TUBITAK (project no. 114C032) and VINNOVA (28240005) for providing financial support.Notes and references
- S. Liu, T. H. Zeng, M. Hofmann, E. Burcombe, J. Wei, R. Jiang, J. Kong and Y. Chen, ACS Nano, 2011, 5, 6971–6980 CrossRef CAS PubMed.
- C. Zhao, X. Xu, J. Chen and F. Yang, J. Environ. Chem. Ecotoxicol., 2013, 1, 349–354 CAS.
- J. Ma, J. Zhang, Z. Xiong, Y. Yong and X. S. Zhao, J. Mater. Chem., 2011, 21, 3350–3352 RSC.
- X. Wang, N. Zhou, J. Yuan, W. Wang, Y. Tang, C. Lu, J. Zhang and J. Shen, J. Mater. Chem., 2012, 22, 1673–1678 RSC.
- F. Perreault, A. Fonseca de Faria, S. Nejati and M. Elimelech, ACS Nano, 2015, 9, 7226–7236 CrossRef CAS PubMed.
- S. Liu, M. Hu, T. H. Zeng, R. Wu, R. Jiang, J. Wei, L. Wang, J. Kong and Y. Chen, Langmuir, 2012, 28, 12364–12372 CrossRef CAS PubMed.
- R. Rezaee, S. Nasseri, A. Hossein Mahvi, R. Nabizadeh, S. A. Mousavi, A. Rashidi, A. Jafari and S. Nazmara, J. Environ. Health Sci. Eng., 2015, 13, 61 CrossRef PubMed.
- D. Y. Koseoglu Imer, Desalination, 2013, 316, 110–119 CrossRef CAS.
- M. Ionita, A. M. Pandele, L. Crica and L. Pilan, Composites, Part B, 2014, 59, 133–139 CrossRef CAS.
- S. Loeb and S. Sourirajan, Adv. Chem. Ser., 1983, 38, 117 CrossRef.
- H. Strathmann and K. Kock, Desalination, 1977, 21, 241–255 CrossRef CAS.
- T.-H. Young and L.-W. Chen, Desalination, 1995, 103, 233–247 CrossRef CAS.
- R. Matz, Desalination, 1972, 11, 207 CrossRef CAS.
- H. Strathmann, K. Kock, P. Amar and R. W. Baker, Desalination, 1975, 16, 179 CrossRef CAS.
- B. M. Ganesh, A. M. Isloor and A. F. Ismail, Desalination, 2013, 313, 199–207 CrossRef CAS.
- S. Simone, A. Figoli, A. Criscuoli, M. C. Carnevale, A. Rosselli and E. Drioli, J. Membr. Sci., 2010, 364, 219–232 CrossRef CAS.
- M. A. Aroon, A. F. Ismail, M. M. Montazer-Rahmati and T. Matsuura, Sep. Purif. Technol., 2010, 72, 194–202 CrossRef CAS.
- M. Sadrzadeh and S. Bhattacharjee, J. Membr. Sci., 2013, 441, 31–44 CrossRef CAS.
- E. Fontananova, J. C. Jansen, A. Cristiano, E. Curcio and E. Drioli, Desalination, 2006, 192, 190–197 CrossRef CAS.
- Z. Xu, J. Zhang, M. Shan, Y. Li, B. Li, J. Niu, B. Zhou and X. Qian, J. Membr. Sci., 2014, 458, 1–13 CrossRef CAS.
- N. Meng, Z. Wang, Ze-X. Low, Y. Zhang, H. Wang and X. Zhang, Sep. Purif. Technol., 2015, 147, 364–371 CrossRef CAS.
- V. R. S. S. Mokkapati, D. Y. K. Imer, N. Yilmaz, V. Ozguz and I. Koyuncu, RSC Adv., 2015, 5, 71011–71021 RSC.
- J. G. WIjmans and C. A. Smolders, Synthetic Membranes: Science, Engineering and Applications, 1986, pp. 39–56 Search PubMed.
- V. T. Stannett, W. J. Koros, D. R. Paul, H. K. Lonsdale and R. W. Baker, Chemistry, 1979, 69–121 CAS.
- J. P. Craig, J. P. Knudsen and V. F. Holland, Text. Res. J., 1962, 32, 435–448 CrossRef CAS.
- V. Gröbe and K. Meyer, Faserforsch. Textiltech., 1959, 10, 214–224 Search PubMed.
- S. Zhao, Z. Wang, J. Wang and S. Wang, J. Membr. Sci., 2014, 469, 316–325 CrossRef CAS.
- H. Chen, L. Kong and Y. Wang, J. Membr. Sci., 2015, 487, 109–116 CrossRef CAS.
- L. Y. Ng, A. W. Mohammad, C. P. Leo and N. Hilal, Desalination, 2013, 308, 15–33 CrossRef CAS.
- E. M. V. Hoek, A. K. Ghosh, X. Huang, M. Liong and J. I. Zink, Desalination, 2011, 283, 89–99 CrossRef CAS.
- J. Lee, H.-R. Chae, Y. J. Won, K. Lee, C.-H. Lee, H. H. Lee, In-C. Kim and J.-min Lee, J. Membr. Sci., 2013, 448, 223–230 CrossRef CAS.
- Z. Xu, J. Zhang, M. Shan, Y. Li, B. Li, J. Niu, B. Zhou and X. Qian, J. Membr. Sci., 2014, 458, 1–13 CrossRef CAS.
- S. Zinadini, A. A. Zinatizadeh, M. Rahimi, V. Vatanpour and H. Zangeneh, J. Membr. Sci., 2014, 453, 292–301 CrossRef CAS.
- C. Zhao, X. Xu, J. Chen, G. Wang and F. Yang, Desalination, 2014, 340, 59–66 CrossRef CAS.
- H.-R. Chae, J. Lee, C.-H. Lee, I.-C. Kim and P.-K. Park, J. Membr. Sci., 2015, 483, 128–135 CrossRef CAS.
- X. Wang, X. Wang, P. Xiao, J. Li, E. Tian, Y. Zhao and Y. Ren, Colloids Surf., A, 2016, 508, 327–335 CrossRef CAS.
- M.-Y. Lim, Y.-S. Choi, J. Kim, K. Kim, H. Shin, J.-J. Kim, D. M. Shin and J.-C. Lee, J. Membr. Sci., 2017, 521, 1–9 CrossRef CAS.
- X. Zhao and K. Drlica, Curr. Opin. Microbiol., 2014, 1–6 CrossRef PubMed.
- H. Pieper, S. Chercheja, S. Eigler, C. E. Halbig, M. R. Filipovic and A. Mokhir, Angew. Chem., Int. Ed., 2016, 55, 405–407 CrossRef CAS PubMed.
- X. L. Hou, J. L. Li, S. C. Drew, B. Tang, L. Sun and X. G. Wang, J. Phys. Chem. C, 2013, 117, 6788 CAS.
- C. H. A. Wong, Z. Sofer, M. Kubesov, J. Kucera, S. Matejkov and M. Pumera, Proc. Natl. Acad. Sci., 2014, 111, 13774–13779 CrossRef CAS PubMed.
- S. Saxena, T. A. Tyson, S. Shukla, E. Negusse, H. Chen and J. Bai, Appl. Phys. Lett., 2011, 99, 013104 CrossRef.
- A. A. Vernekar and G. Mugesh, Chem.–Eur. J., 2013, 19, 16699–16706 CrossRef CAS PubMed.
- A. Krasowska and K. Sigler, Front. Cell. Infect. Microbiol., 2014, 4, 112 Search PubMed.
- D. Y. Koseoglu-Imer, B. Kose, M. Altinbas and I. Koyuncu, J. Membr. Sci., 2013, 428, 620–628 CrossRef CAS.
- Z. Xu, J. Zhang, M. Shan, Y. Li, B. Li, J. Niu, B. Zhou and X. Qian, J. Membr. Sci., 2014, 458, 1–13 CrossRef CAS.
Footnote |
| † Electronic supplementary information (ESI) available. See DOI: 10.1039/c6ra25015g |
| This journal is © The Royal Society of Chemistry 2017 |

