 Open Access Article
Creative Commons Attribution 3.0 Unported Licence
Effect of nanomaterials and electrode configuration on soil consolidation by electroosmosis: experimental and modeling studies
Heng Zhangabc,
Guoxiang Zhoub,
Jing Zhong*ac,
Zhang Shenb and
Xianming Shi *bd
*bd
aKey Lab of Structure Dynamic Behavior and Control, Harbin Institute of Technology, Ministry of Education, Harbin 150090, China. E-mail: zhongjing@hit.edu.cn
bSchool of Civil Engineering and Architecture, Wuhan Polytechnic University, Wuhan 430023, China
cSchool of Civil Engineering, Harbin Institute of Technology, Harbin 150090, China
dLaboratory of Corrosion Science & Electrochemical Engineering, Department of Civil and Environmental Engineering, Washington State University, Pullman, USA. E-mail: xianming.shi@wsu.edu
First published on 20th February 2017
Abstract
Controlling the water content in soil is crucial for the load bearing capacity of soil. In the past few decades, electroosmosis has been proved to be a versatile strategy to consolidate soil in situ. However, the efficiency of this electrochemical technique needs to be further improved for practical application. This study was designed to test the hypothesis that the incorporation of nanoparticles (NPs) during electroosmosis can significantly facilitate the migration of water molecules under an external electric field and thus improve the physical properties of the treated soil. In addition, the number of anodes per cathode was explored as another method to improve the efficiency of electroosmosis in dewatering and strengthening soil. The results from the designed laboratory experiments confirmed the benefits of increasing the number of anodes or adding positively charged SiO2@Al2O3 core–shell NPs, in increasing the dewatering rate and improving the cohesion, internal friction angle, and microstructure of the treated soil (Lake Silt). The finite element method based simulation results agreed well with the experimental observations and suggested that the NPs can promote the water migration under an electric field.
1. Introduction
The dewatering and consolidation of soil is not only crucial for foundation engineering during construction, but also for managing the long-term safety risks related to geotechnical assets. For instance, the tragic 2015 landslide of construction waste that occurred in Shenzhen, China destroyed and buried industrial buildings and workers' living quarters in the nearby industrial park, resulting in 21 deaths and a direct economic loss of over 23![[thin space (1/6-em)]](https://www.rsc.org/images/entities/char_2009.gif) 000
000![[thin space (1/6-em)]](https://www.rsc.org/images/entities/char_2009.gif) 000 RMB (approximately $3.5 million). The oversaturation of the soil foundation by water was found to be the cause of this incident.1 Each year, there are over 30
000 RMB (approximately $3.5 million). The oversaturation of the soil foundation by water was found to be the cause of this incident.1 Each year, there are over 30![[thin space (1/6-em)]](https://www.rsc.org/images/entities/char_2009.gif) 000 mudslides and landslides in China, resulting in over 800 deaths and economic loss of 4 billion RMB (approximately $650 million), mainly due to the over-saturation of soil.2 This illustrates the importance of controlling the water content in soil below some critical value, in the effort to maintain the soil's integrity or its load bearing capacity for civil engineering applications.3–5
000 mudslides and landslides in China, resulting in over 800 deaths and economic loss of 4 billion RMB (approximately $650 million), mainly due to the over-saturation of soil.2 This illustrates the importance of controlling the water content in soil below some critical value, in the effort to maintain the soil's integrity or its load bearing capacity for civil engineering applications.3–5
In engineering practice, the water content in soil is typically decreased by compression or vacuum, upon which water can be repelled out of the soil by pressure. These techniques, however, have their limitations. For the water molecules that are tightly bound to soil particles either by Van der Waal's or electrostatic interactions, it is very difficult to get rid of them solely by external force.6,7 In some cases, such as dewatering the soil under certain built infrastructure, the use of compression or vacuum is not practical. In contrast, electroosmosis has been demonstrated by extensive studies to be very effective in removing the bound water in soils.8,9 More importantly, this method enables the dewatering of soil beneath existing constructions. As such, electroosmosis is a promising approach to controlling the risk of landslides in rainy regions,10–15 where the water content in soil may increase significantly with the weather.
Various studies have examined the influence of the external electric field, electrode configuration, and electrolyte injection on the effectiveness of electroosmosis in dewatering and consolidating soils. Soil is a porous structure, the strength of which is mainly provided by the soil skeleton. Such skeleton is sensitive to the water content, which can be quantitatively studied by standard soil compression tests and mainly reflected by the indices of liquid limit and plastic limit.16 Since the electroosmosis process is induced by electric field, the potential distribution across the soil matrix has significant impact on the drainage process.17,18 Akram et al.19 proposed the concept of effective electric field, and revealed the close correlation between the most reinforced region and the effective electric field. Jones et al.20 combined the electromagnetic theory with experimental results and pointed out that optimizing the arrangement of electrodes can shorten the consolidation time. Rittirong et al.21 also reported that the effects of soil dewatering and reinforcement by electroosmosis can be significantly improved by increasing the number of anodes around cathode. Furthermore, the injection of electrolyte into soils was adopted to improve the efficiency of electroosmosis. For instance, Ozkan et al.22 injected Al3+ and PO43− ions into kaolinite during electroosmosis, which increased the soil's shear strength by 500–600%. Mohamedelhassan and Shang23 reported that using 15% CaCl2 and 10% Al2(SO4)3 of permeating solutions can improve the effectiveness of electroosmosis, and their experimental results revealed that the electrolyte played a significant role in transporting water from the anode to the cathode, which was further proven by Ou et al.24
In recent years, the nano-modification of civil engineering materials has attracted growing attention. For instance, He and Shi25 reported that the incorporation of nanoclay (montmorillonite) or nano-SiO2 at 1% by weight of cement can significantly improve the microstructure of cement mortar and reduce its chloride permeability. They also proposed multiple mechanisms by which the nanomaterial interacts with the hydration of cement particles. More importantly, the utilization of electrical force to drive charged nanoparticles (NPs) into concrete has recently emerged as a promising repair technology. Cardenas et al.26 found that colloidal NPs can be electro-kinetically injected into hardened cement paste and react with it to produce precipitates, leading to reduced permeability of the paste.
Inspired by the recent advances in concrete materials, this study is the first one that aims to demonstrate that the electrical injection of NPs into soil can significantly improve the performance of electroosmosis. The underlying assumption is that similar to concrete, soil is a porous and heterogeneous material and the injection of NPs can significantly alter the soil's microstructure and engineering properties. Note that Reddy et al.27 demonstrated the feasibility of using external electric field to enhance the transport of iron NPs into low-permeability clayey soils for the decontamination of organic contaminant. In this context, this study investigates the effects of positively charged SiO2@Al2O3 core–shell NPs and electrode configuration on soil consolidation by electroosmosis, through both laboratory experiments and modeling of electroosmosis with or without NPs.
2. Methodology
2.1 Experimental cell
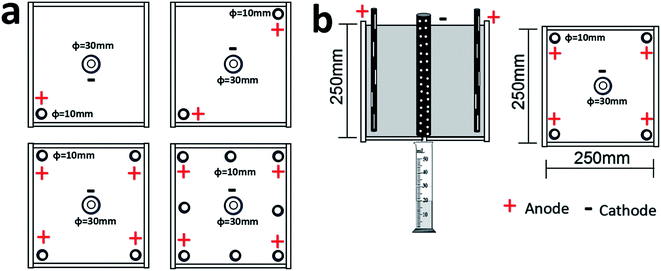
The schematic diagram of the experimental apparatus is provided in Fig. 1. The electroosmotic cell consists of square poly(methyl methacrylate) Plexiglas® with the size of 250 mm × 250 mm. The bottom plate was bored with a hole of 10 mm in diameter for drainage, which was measured by a graduated cylinder. Tubular stainless steel (Type 304) pipes were used as electrodes with holes drilled along the surface of the pipe to inject nanomaterial (anode) or to drain water (cathode) during the electroosmotic treatment of the soil. The diameters of anode and cathode were 10 mm and 30 mm respectively. Both electrodes were connected to a direct current (DC) power supply device with a potential of 20 V. All the anodes were fixed at 10 mm above the bottom plate, preventing seepage of NPs through the bottom plate.2.2 Soil specimens
The soil used in the experimental study was a lake silt obtained from a Wuhan subway excavation project. The physical properties of the soil were listed in Table 1. The liquid and plastic limits of the soil were 53.7% and 21.4%, respectively. The major components of the soil include SiO2 (60%), Al2O3 (18.6%) and Fe2O3 (7.9%) which were identified by X-ray fluorescence (XRF), along with other components (13.5%).| Physical properties | |
|---|---|
| Water content (%) | 42.7 |
| Liquid limit (%) | 53.7 |
| Plastic limit (%) | 21.4 |
| Plastic index | 32.3 |
| Specific gravity | 2.75 |
Initially, the soil was pre-dried to a constant weight, and then ground into powders. The sieve analysis revealed the following gradation of particles: <1 μm (0%), 1–2 μm (5.36%), 2–5 μm (42.9%), 5–10 μm (44.6%), 10–20 μm (7.14%), and >20 μm (0%). Subsequently, soil samples with water content of ∼53%, which corresponds to the liquid limit as proposed by Casagrande,28 were prepared by mixing distilled water with soil powders, followed by a 5 min vibration to remove bubbles. All the soil samples were placed in the experimental cells and covered by three layers of geotextiles, and then kept undisturbed for 24 h to reach more uniform moisture distribution and soil compactness.
2.3 Synthesis and characterization of positively charged nanoparticles
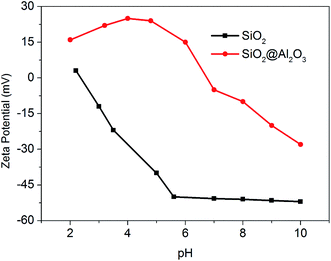
In this study, NPs with positive surface charges are required, since the NPs are injected into the anode tube before migrating to the cathode side under the external electric field. The originally negatively charged SiO2 NPs, whose size can be controlled precisely, were coated with a thin layer of Al2O3. SiO2@Al2O3 core–shell NPs were synthesized by the following two-step process. Firstly, the seed SiO2 NPs with uniform diameter of 220 nm were synthesized according to the well-established Stober method.29 For the growth of Al2O3 thin layer, 1 gram of nano-SiO2 powder was well dispersed in 40 ml of deionized (DI) water to serve as the seed, and then concentrated nitric acid was added into the suspension until the pH reached 4. Subsequently, 3 ml of 28 mg ml−1 Al2O3 suspension was added into the mixture and allowed to react for 30 min. Thereafter, the whole mixture was mixed with sufficient volume of ammonium hydroxide until the pH rose up to 6. After 3 h, the obtained suspension was washed with ethanol and ultrapure water by repeated centrifugation and further dried at 600 °C for 12 h in a muffle furnace.A New Zetasizer Nano ZSP (Malvern Instruments) was employed to measure the Zeta potential of the surface charge of SiO2 NPs and SiO2@Al2O3 core–shell NPs. The instrument provides a simple, fast and accurate way to measure zeta potential, and uses a unique disposable capillary cell to ensure that there is no cross-contamination between samples. At the room temperature (20 ± 2 °C), the ζ potential of at least five identical samples were determined and their average was taken. The embedded model for the calculation of ζ potential was based on the theory of Helmholtz–Smoluchowski equation.30 As shown in Fig. 2, the coating of SiO2 NPs by Al2O3 substantially changed their zeta potential. At near-neutral pH levels, the zeta potential values suggest that SiO2@Al2O3 core–shell NPs and SiO2 NPs carry positive and negative charges, respectively. This confirms the effectiveness of the procedure used to produce the positively charged core–shell NPs from negatively charged SiO2 NPs.
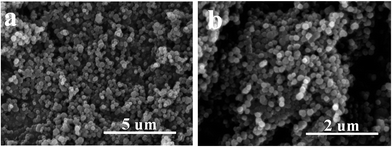
In addition, the microstructure of the SiO2 NPs and SiO2@Al2O3 core–shell NPs was examined by an FEI HELIOS NanoLab 600i scanning electron microscope (SEM). A typical 20 kV accelerating voltage was used with a scan time of 60 seconds per sampling area. The morphologies of the SiO2 NPs and SiO2@Al2O3 core–shell NPs can be seen in Fig. 3. By evaluating 110 of the NPs, it was estimated the core–shell NPs featured a uniform diameter of approximately 350 nm, significantly larger than that of the SiO2 NPs (220 nm).
2.4 Soil treatment, testing and characterization
For the electroosmotic treatment of the soil, direct current with the voltage of 20 V was applied between the anode and the cathode in the soil. Well dispersed SiO2@Al2O3 core–shell NP suspensions with various concentrations (0 mg ml−1, 0.1 mg ml−1, 0.5 mg ml−1, and 1.0 mg ml−1) were injected into the anodes via a syringe. For each anode, the injection volume of core–shell NP suspension was 10 ml. After the injection process was completed, the electroosmosis was carried out for another 48 h. The electric current and volume of drainage water were monitored during the entire electrochemical treatment process.As the soil before treatment was almost in flow state, the strength and friction of the soil were negligible. Thus, the cohesion and friction angle were only determined after the treatment, by using a strain-controlled triaxial apparatus (TSZ-1B Nanjing, China). The test sample was 39.1 mm in diameter and 80 mm in height. The confining pressures were selected as 50 kPa, 100 kPa and 200 kPa, respectively. Fig. 4 presents the schematic for calculating the undrained shear strength of soil.
 | ||
| Fig. 4 The schematic for calculating the undrained shear strength (τƒ) of soil, where C denotes the cohesion and φ denotes the friction angle. | ||
According to the Mohr–Coulomb strength theory,31 the shear strength of soil largely depends the vertical pressure applied on the soil sample and two intrinsic properties of the soil, i.e., its cohesion C and internal friction angle φ. The relationship is depicted as eqn (1), where τƒ and σ denote the shear strength and vertical pressure, respectively.
τƒ = C + σ![[thin space (1/6-em)]](https://www.rsc.org/images/entities/char_2009.gif) tan tan![[thin space (1/6-em)]](https://www.rsc.org/images/entities/char_2009.gif) φ φ
| (1) |
The microstructure of the soil before and after the treatment was analyzed using a scanning electron microscope (SEM), HELIOS NanoLab 600i, America FEI (Hillsboro, Oregon). The accelerating voltage of 20 kV was used.
2.5 Numerical investigation
In order to obtain a better understanding of the reinforcement mechanism underlying the electroosmosis coupled with the injection of positively charged NPs, a series of two-dimensional (2D) numerical simulations were carried out using the COMSOL Multiphsics™ software. Specifically, this numerical investigation was based on finite element method (FEM) modeling, the related parameters of which are listed in Table 2.| Parameters | Value | Unit |
|---|---|---|
| a The value of these parameters was not experimentally measured; instead, a reasonable value was assumed based on domain knowledge. While varying these parameters in a certain range changed the output values of the simulation, it did not change the trends identified in the simulation results. | ||
| Type of NPs | SiO2@Al2O3 | — |
| Applied voltage | 20 | V |
| Dielectric constant of NPsa | 20 | — |
| Dielectric constant of liquida | 120 | — |
| Effective porosity of soila | 0.5 | — |
| Density of NPs | 2.4 | g m−3 |
| Density of soil | 1900 | Kg m−3 |
| Density of liquid | 1000 | Kg m−3 |
| Initial concentration of NPs | 1.0 | Mg ml−1 |
| Diameter of NPs | 350 | nm |
| Saturation level of soil | 100 | % |
The shape of soil particles was simplified as spheres with the maximum and minimum diameter of 6.35 mm and 1.27 mm, respectively. While these are much larger than the actual size of the soil particles, such simplification was necessary in light of the computational constraints. The simulation confirmed that the flow of water was mainly affected by the porosity of the soil matrix, instead of the size of individual soil particles. The minimum diameter 1.27 mm corresponds to the smallest mesh size of finite element in the software, whereas the diverse size of these spheres aimed to simulate the diverse size distribution of the soil particles. In addition, the size dispersion and locations of 300 spherical particles were randomly distributed in the modeled domain (150 mm × 150 mm) using the MATLAB™ software to simulate the physical microstructure of soil.32 A transport model based on conservation of momentum was proposed in this study, in which the charged NPs were considered as entity particles rather than cations and the adjacent hydrone saturated in the porous media channels was considered as macroscopical fluid. The positively charged NPs migrated from the anode to the cathode under the combined electric field and fluid force field, which were calculated according to eqn (2) and (3), respectively.
| F = eZE | (2) |
 | (3) |
3. Results and discussion
Table 3 provides a summary of experimental results from 16 electrochemical treatments of the soil, including the treatment conditions (concentration of NPs, number of anodes) and the treatment outcomes (amount of drained water as well as shear strength and water content of the treated soil near anode or cathode). For description, the term EO denotes electroosmosis with water, whereas EN denotes electroosmosis with the injection of NP suspensions.| Test no. | Solution type | Concentration (mg ml−1) | Number of anodes | Shear strength (kPa) | Drained water (ml) | Water content (%) | ||||
|---|---|---|---|---|---|---|---|---|---|---|
| Anode | Cathode | Anode | Cathode | |||||||
| C | φ | C | φ | |||||||
| a After the electroosmosis of EO samples, the moisture content of soil near the cathode was near 50%, and the soil was almost in a flow condition and its shear strength was too small to measure. | ||||||||||
| EO1 | Water | No | 1 | 4.6 | 17.3 | a | a | 425 | 45.8 | 53.9 |
| EO2 | No | 2 | 5.2 | 17.5 | a | a | 670 | 42.4 | 53.5 | |
| EO3 | No | 4 | 10 | 22.8 | a | a | 737 | 41.7 | 52.3 | |
| EO4 | No | 8 | 11 | 23.3 | a | a | 887 | 38.6 | 50.7 | |
| EN1 | Core–shell NPs | 0.1 | 1 | 4.9 | 17.5 | 3.1 | 15.4 | 521 | 43.2 | 53.4 |
| EN2 | 0.1 | 2 | 7 | 18.2 | 3.6 | 16 | 869 | 40 | 52.1 | |
| EN3 | 0.1 | 4 | 11 | 22.6 | 5.2 | 18.4 | 936 | 37.5 | 50.7 | |
| EN4 | 0.1 | 8 | 12.2 | 23.6 | 6.1 | 19.2 | 1024 | 35.2 | 50 | |
| EN5 | 0.5 | 1 | 5.2 | 18.1 | 4.1 | 16.2 | 617 | 40.2 | 53.3 | |
| EN6 | 0.5 | 2 | 7.9 | 19.3 | 4.8 | 17.3 | 991 | 39.5 | 51 | |
| EN7 | 0.5 | 4 | 11.8 | 23.8 | 6.5 | 19.4 | 1134 | 36.3 | 50.6 | |
| EN8 | 0.5 | 8 | 13.2 | 24.5 | 7.2 | 20.3 | 1231 | 33.4 | 48.6 | |
| EN9 | 1.0 | 1 | 6.4 | 19 | 5.3 | 17.6 | 709 | 38.7 | 52 | |
| EN10 | 1.0 | 2 | 8.5 | 21.1 | 6.2 | 18.6 | 1143 | 36 | 51.3 | |
| EN11 | 1.0 | 4 | 12.8 | 25.3 | 10.7 | 22.5 | 1313 | 33.8 | 50 | |
| EN12 | 1.0 | 8 | 14.1 | 26.2 | 1.4 | 23.1 | 1336 | 31 | 48 | |
3.1 Electric current and drained water volume as function of treatment conditions
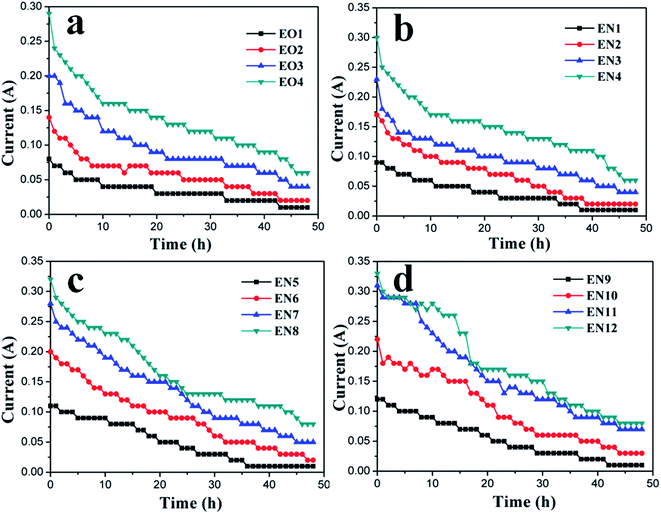
According to the soil-reinforcing mechanism of electroosmosis, the electric current flowing through the soil can serve as an indicator of the driving force for the water drainage.24 Fig. 5 reveals that, during the electroosmotic process, the current steadily decreased for both EO and EN samples, corresponding to the depletion of charge carriers inside of the soil under the external electric field. Regardless of the absence or presence of NPs, the electric current increased with the number of anodes used, which can be attributed to the more uniform and larger effective electric field formed in the soil. This effect of anode configuration on the distribution of effective area under electroosmosis is illustrated in Fig. 6, which is obtained by the theory of electromagnetic field as reported previously.19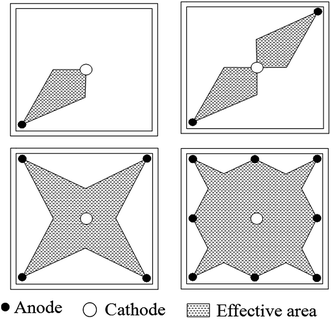 | ||
| Fig. 6 Schematic illustrating the effect of anode configuration on the distribution of effective area during electroosmosis.19 | ||
When the NP suspensions were employed in place of DI water, more charge carriers were available and thus effectively increased the electrical current flowing between the anode and the cathode. With the suspension containing 1 mg ml−1 NPs (vs. DI water), the electrical current was increased by approximately 30%. Interestingly, the different arrangement of anodes exhibited negligible impact on the efficiency of NPs in enhancing the electrical current. This implies the stability of the chosen SiO2@Al2O3 core–shell NPs.
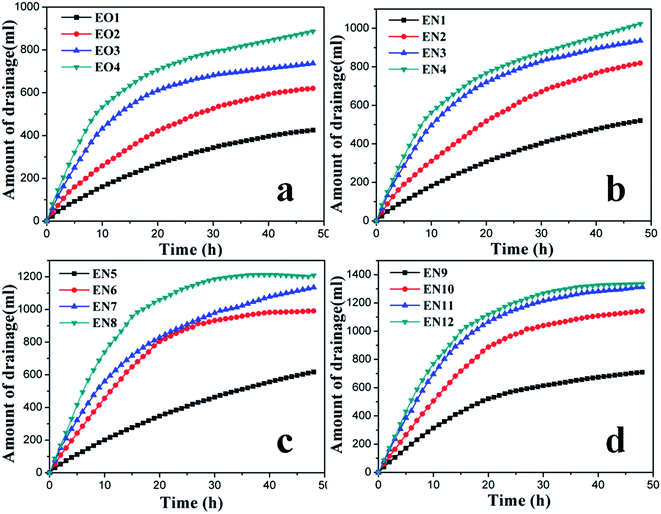
Fig. 7 presents the temporal evolution of drained water volume during treatment with electroosmosis, with DI water or NP suspensions of various concentrations. In all the cases, the cumulative amount of water drained increased over the time of electrochemical treatment. Yet, the rate of water drainage steadily decreased for both EO and EN samples, corresponding to the depletion of charge carriers inside of the soil under the external electric field. Regardless of the absence or presence of NPs, the time efficiency of soil dewatering increased with the number of anodes used, due to the more uniform and larger effective electric field formed in the soil (Fig. 6). In the case of electroosmosis without NPs, the amount of drainage for EO2, EO3, EO4 were 0.58, 0.73 and 1.09 times higher than that of EO1. The addition of NPs further enhanced the drainage efficiency, which increased with the concentration of the NP suspension. For instance, the amount of drained water from the cathode for EN12 was 0.51 times higher than that of EO4. Note that, increasing the number of anodes from 4 to 8 for electroosmosis with the NP suspension of 1 mg ml−1 only slighted increased the amount of water drained (Fig. 7(d), EN11 vs. EN12). One possible mechanism is hypothesized as follows. The increase of electroosmotic dewatering led to the increasingly lower moisture in the soil, resulting in associated decrease in the thickness of the water layer bound to soil particles. As such, more electric energy was required to divorce the absorbed water from the soil particles, ultimately causing more difficult drainage from the soil matrix.
Fig. 7 reveals the benefits of increasing the number of anodes and adding NPs to the efficiency of water drainage by electroosmosis, which agree well with the patterns observed from the electric current results (Fig. 5). Together, the experimental results of water drainage and electric current confirm that the positively charged NPs facilitated the removal of water molecules from the soil by the external electric field.
3.2 Physical properties of the treated soils
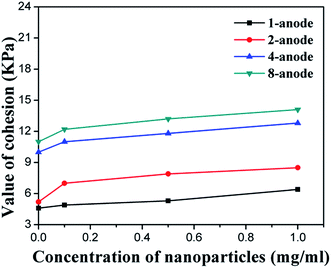
In this study, the soil samples near the anode and the cathode were both tested after the electrochemical treatment, by using the strain-controlled triaxial apparatus. The test results are summarized in Table 2 and illustrated in Fig. 8–10. For both EO and EN samples, the cohesion and internal friction angle of the soil near the cathode were smaller than those near the anode. This is because of the migration of water from the anode to the cathode during the electrochemical treatment of the soil, leading to the better consolidation of the soil near the anode than that near the cathode. As shown in Table 2, for the EN soil samples (except EN12), the cohesion of the soils near the cathode was averaged at 61% of their counterpart near the anode. For the soil after electroosmosis with NP suspension of 1 mg ml−1 (EN12), this ratio dropped to 10%, representing the highest cathode-to-anode contrast in terms of soil cohesion. For the EN soil samples, the internal friction angle of the soils near the cathode was averaged at 86% of their counterpart near the anode.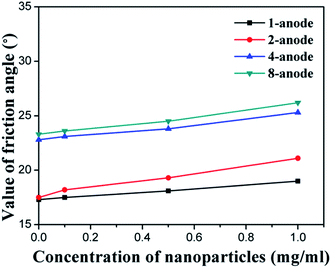 | ||
| Fig. 9 Increment of the friction angle of soil near the anode due to electroosmosis and NPs injection. | ||
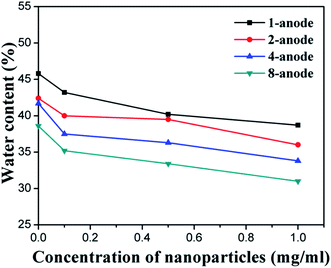 | ||
| Fig. 10 The water content of the treated soil near the anode, as a function of concentration of NPs. | ||
Regardless of the absence or presence of NPs, the cohesion and friction angle of the soil were significantly improved by increasing the number of anodes per cathode, as shown in Fig. 8 and 9, respectively. This is consistent with the tests results of water drainage (Fig. 7). Similarly, these two physical properties of the soil were further enhanced by the injection of SiO2@Al2O3 core–shell NPs. For every given electrode configuration, the cohesion (Fig. 8) and friction angle (Fig. 9) of the soil near the anode both increased linearly with the concentration of the NP suspension. Interestingly, the different arrangement of anodes exhibited negligible impact on the efficiency of NPs in enhancing the cohesion and friction angle of the soil.
The aforementioned enhancements of physical properties of the soil with the number of anodes and the concentration of NP suspension can be partly explained by the experimental results regarding the water content of the treated soil. As shown in Table 2 and Fig. 10, the water content of the soil near the electrodes was significantly decreased by increasing the number of anodes per cathode. In addition, Fig. 10 shows that the water content of the soil near the anode decreased linearly with the concentration of the NP suspension, for every given electrode configuration. For instance, using the 1 mg ml−1 NP suspension instead of DI water decreased the water content in the near-anode soil from 45.8% to 38.7%, in the case of using one anode. Such benefit of adding NPs was more significant in the case of using four anodes (per cathode), which decreased the water content in the near-anode soil from 41.7% to 33.8%.
3.3 Microstructure of the treated soil
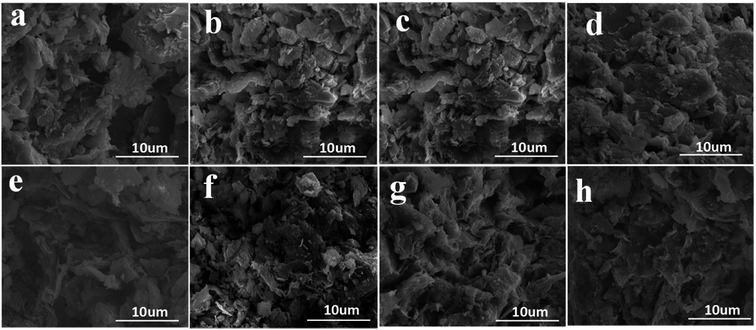
The microstructure of the soil before and after the electroosmotic treatments was characterized using SEM, in order to capture the induced changes as a function of electrode configuration and NPs injection. Fig. 11 presents the representative micrographs of the soil near cathode after 16 different treatments. The soil near the cathode was selected since it featured very consistent water content after treatments, with a water content of 51.3% ± 1.7% among the 16 samples. As such, the effect of water content on the microstructure of the soil was negligible. As shown in Fig. 11, more anodes per cathode led to more compacted soil microstructure after the electrochemical treatment, which is again related to the enhanced current (Fig. 5) and larger effective area (Fig. 6) with the employment of more anodes. Fig. 11 also confirms the benefits of adding NPs in forming a denser soil structure, for each given electrode configuration. This is mainly attributable to the increase of charged particles migrated to the cathode, which also dragged more adsorbed water to the cathode for drainage (Fig. 7). These microscopic observations are consistent with the engineering properties of the soil measured at the macroscopic level, confirming that the use of multiple anodes and NPs injection increased the cohesion (Fig. 8) and internal friction angle (Fig. 9) of the treated soil.3.4 Analysis of 2D numerical modeling results
In order to further explore the effects of electrode configuration and NPs on the electroosmotic process, a FEM model was established based on simplifying assumptions in Table 2. Fig. 12(a)–(d) illustrate the variation of electroosmotic coefficient in the absence of NPs injection, which is an indicator of localized flow rate of water. From Fig. 12(a) to (d), the electroosmotic coefficient increased significantly as the number of anodes per cathode increased from one to eight. The region of soil improvement was effectively extended due to the increase of anodes, which is highly consistent with the theoretical effective area (shown in Fig. 6) and our experimental results (water drainage shown in Fig. 7).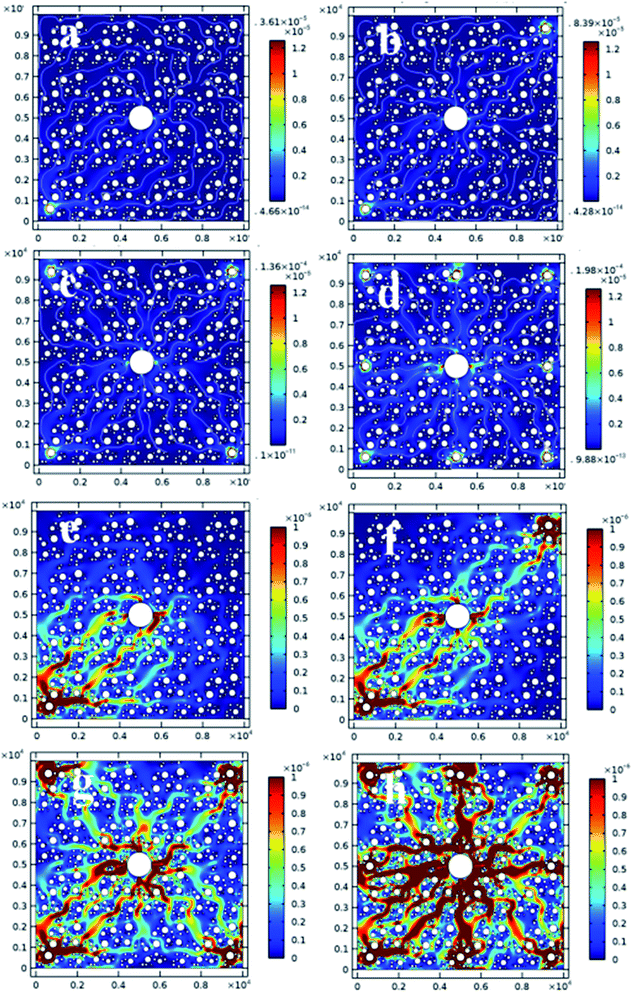 | ||
| Fig. 12 Variation of electroosmotic coefficient of electroosmosis process without (a–d) and with 1 mg ml−1 NPs (e–h). | ||
Fig. 12(e)–(h) illustrate the variation of electroosmotic coefficient in the presence of 1 mg ml−1 SiO2@Al2O3 core–shell NPs injected. From Fig. 12(e) to (h), the electroosmotic coefficient increased significantly with the number of anodes employed per cathode. The region of soil improvement was also effectively extended due to the increase of anodes. Compared with Fig. 12(a)–(d), the electroosmotic coefficient under each given electrode configuration increased significantly with the injection of NPs, which is highly consistent with our experimental results (water drainage shown in Fig. 7).
4. Conclusion
In this work we adopted different configurations of anodes with the injection of various concentrations of positively charged SiO2@Al2O3 core–shell NPs to study the effects of electroosmosis and NPs injection on the dewatering and consolidation of a soil (). A series of laboratory experiments and numerical simulations were performed to shed light on these improvements to the conventional electroosmosis method. The following conclusions can be drawn:(1) Regardless of the absence or presence of NPs, both the electric current and the time efficiency of soil dewatering increased with the number of anodes per cathode, which can be attributed to the more uniform and larger effective electric field formed in the soil (lake silt). This translated to denser microstructure and improved cohesion and friction angle of the soil.
(2) The addition of NPs further enhanced the electric current and drainage efficiency during electroosmosis, which increased with the concentration of the NP suspension. This also translated to denser microstructure and improved cohesion and friction angle of the soil.
(3) The 2D FEM modeling confirmed the benefits of multiple anodes and NPs injection in improving the rate of water removal or extending the region of soil improvement by electroosmosis.
Acknowledgements
The authors acknowledge Prof. Shuping Xu and Prof. Jianlin Wu (School of Civil Engineering and Architecture, Wuhan Polytechnic University) for discussions and helpful comments. This work was supported by National Natural Science Foundation of China (Grant No. 51278390), Hubei Department of Education (ChuTian Scholar Visiting Professorship awarded to Wuhan Polytechnic University), and Hubei Provincial Department of Construction (Construction Science and Technology Plan Project EJB-2016-347-1-13).References
- http://news.sina.com.cn/c/nd/2015-12-22/doc-ifxmttme6123893.shtml.
- http://www.mca.gov.cn/article/zwgk/mzyw/201501/20150100754906.shtml.
- E. Mohamedelhassan and J. Q. Shang, Effect of electrode materials and current in termittence in electroosmosis, Proceedings of the ICE–Ground Improvement, 2001, 5, 3–11 CrossRef.
- L. Bjerrum, J. Moum and O. Eide, Application of electro-osmosis on a foundation problem in Norwegian quick clay, Geotechnique, 1967, 17, 214–235 CrossRef.
- H. Wu, L. M. Hu and Q. Wen, Electro-osmotic enhancement of bentonite with reactive and inert electrodes, Appl. Clay Sci., 2015, 111, 76–82 CrossRef CAS.
- P. Asavadorndeja and U. Glawe, Electrokinetic strengthening of soft clay using the anode depolarization method, Bull. Eng. Geol. Environ., 2005, 64, 237–245 CrossRef CAS.
- J. K. Mitchell, Fundamentals of soil behavior, Wiley, New York, 1993 Search PubMed.
- J. Q. Shang and K. Y. Lo, Electrokinetic dewatering of phosphate clay, J. Hazard. Mater., 1997, 55, 117–133 CrossRef CAS.
- A. P. Shapiro and R. F. Probstein, Removal of contaminants from saturated clay by electroosmosis, Environ. Sci. Technol., 2002, 27, 283–291 CrossRef.
- R. Lageman, W. Pool and G. Seffinga, Electro-reclamation: theory and practice, Chem. Ind., 1989, 18, 575 Search PubMed.
- B. A. Segall and C. J. Bruell, Electroosmotic Contaminant-Removal Processes, J. Environ. Eng., 1992, 118, 84–100 CrossRef CAS.
- A. R. Estabragh, M. Naseh and A. A. Javadi, Improvement of clay soil by electro-osmosis technique, Appl. Clay Sci., 2014, 95, 32–36 CrossRef CAS.
- P. C. Renaud and R. F. Probstein, Electro-osmotic Control of Hazardous Waste. PCH, Physicochem. Hydrodyn., 1987, 9, 345 CAS.
- R. Azzam and W. Oey, The utilization of electrokinetics in geotechnical and environmental engineering, Transp. Porous Media, 2001, 42, 293–314 CrossRef CAS.
- Y. B. Acar and R. J. Gale, Electrokinetic remediation: basics and technology status, J. Hazard. Mater., 1995, 40, 117–137 CrossRef CAS.
- W. A. White, Atterberg plastic limits of clay minerals, Urbana, 1949, vol. 34, pp. 508–512 Search PubMed.
- J. Hamed, Y. B. Acar and R. J. Gale, Pb(II) Removal from Kaolinite by Electrokinetics, J. Geotech. Eng., 1991, 117, 241–271 CrossRef.
- H. Xu and T. Ding, Influence of vacuum pressure, pH, and potential gradient on the vacuum electro-osmosis dewatering of drinking water treatment sludge, Drying Technol., 2016, 34(9), 1107 CrossRef CAS.
- N. Akram Alshawabkeh, J. Robert Gale and E. Ozsu-Acar, et al., Optimization of 2-D Electrode Configuration for Electrokinetic Remediation, J. Soil Contam., 1999, 8, 617–635 CrossRef.
- C. J. F. P. Jones, J. Lamont-Black and S. Glendinning, et al., Treatment of lagooned sewage sludge in situ using electrokinetic geosynthetics, Geosynth. Int., 2008, 15, 192–204 CrossRef.
- A. Rittirong, J. Q. Shang and E. Mohamedelhassan, et al., Effects of Electrode Configuration on Electrokinetic Stabilization for Caisson Anchors in Calcareous Sand, J. Geotech. Geoenviron. Eng., 2008, 134, 352–365 CrossRef CAS.
- S. Ozkan, R. J. Gale and R. K. Seals, Electrokinetic stabilization of kaolinite by injection of Al and PO43− ions, Proceedings of the ICE–Ground Improvement, 1999, 3, 135–144 CrossRef.
- E. Mohamedelhassan and J. Q. Shang, Electrokinetics-generated pore fluid and ionic transport in an offshore calcareous soil, Can. Geotech. J., 2003, 40, 1185–1199 CrossRef CAS.
- C. Y. Ou, S. C. Chien and Y. G. Wang, On the enhancement of electroosmotic soil improvement by the injection of saline solutions, Appl. Clay Sci., 2009, 44, 130–136 CrossRef CAS.
- X. He and X. Shi, Chloride permeability and microstructure of Portland cement mortars incorporating nanomaterials, J. Transp. Res. Board, 2008, 2070, 13–21 CrossRef CAS.
- E. Cardenas and L. J. Struble, Electrokinetic nanoparticle treatment of hardened cement paste for reduction of permeability, J. Mater. Civ. Eng., 2006, 18, 554–560 CrossRef.
- K. R. Reddy, K. Darko-Kagya and C. Cameselle, Electrokinetic-enhanced transport of lactate-modified nanoscale iron particles for degradation of dinitrotoluene in clayey soils, Sep. Purif. Technol., 2011, 79(2), 230–237 CrossRef CAS.
- I. L. Casagrande, Electro-Osmosis in Soils, Geotechnique, 1949, 1, 159–177 CrossRef.
- W. Stöber, A. Fink and E. Bohn, Controlled growth of monodisperse silica spheres in the micron size range, J. Colloid Interface Sci., 1968, 26, 62–69 CrossRef.
- P. C. Hiemenz and R. Rajagopalan, Principles of Colloid and Surface Chemistry, Marcel Dekker Inc., 3rd edn, 1997, revised and expanded Search PubMed.
- W. H. Baker and R. J. Krizek, Mohr-Coulomb strength theory for anisotropic soils, J. Soil Mech. Found. Div., 1970, 96(1), 269–292 Search PubMed.
- L. Tacher, P. Perrochet and A. Parriaux, Generation of Granular Media, Transp. Porous Media, 1996, 26, 99–107 CrossRef.
| This journal is © The Royal Society of Chemistry 2017 |

