
 Open Access Article
 This Open Access Article is licensed under a Creative Commons Attribution-Non Commercial 3.0 Unported Licence
Fine silver sulfide–platinum nanocomposites supported on carbon substrates for the methanol oxidation reaction†
Jiayi Tangab,
Dong Chena,
Chengyin Lia,
Xianfeng Yangc,
Hui Liu*ad and
Jun Yang*abd
aState Key Laboratory of Multiphase Complex Systems, Institute of Process Engineering, Chinese Academy of Sciences, Beijing, 100190, China. E-mail: jyang@ipe.ac.cn; yfchen@ipe.ac.cn; Fax: +86-10-8254-4915; Fax: +86-10-8254-4919; Tel: +86-10-8254-4915 Tel: +86-10-8254-4896
bUniversity of Chinese Academy of Sciences, No. 19A Yuquan Road, Beijing 100049, China
cAnalytical and Testing Centre, South China University of Technology, Guangzhou 510640, China
dCenter for Mesoscience, Institute of Process Engineering, Chinese Academy of Sciences, Beijing 100190, China
First published on 13th January 2017
Abstract
Nanocomposites composed of silver sulfide (Ag2S) and platinum (Pt) metal are promising for electrocatalysis. However, they suffer from low concentration synthesis or larger sizes due to limitations in the current synthetic approaches. Herein, we report an organic synthesis to address these deficiencies for the preparation of Ag2S–Pt nanocomposites. This strategy starts with a dodecylamine (DDA)-based phase transfer of Ag+ ions from the aqueous phase to toluene. The transferred Ag+ ions are then loaded on the carbon substrates, followed by reaction with elemental sulfur to form carbon-supported Ag2S nanocrystals, which are used as seeds for the growth of a Pt metal shell, resulting in the formation of the Ag2S–Pt nanocomposites on the same carbon substrates. The as-prepared carbon-supported Ag2S–Pt nanocomposites have a core–shell construction with an overall fine size of ca. 5 nm. In comparison with the commercial Pt/C catalysts from Johnson Matthey, fine Ag2S–Pt nanocomposites supported on the carbon substrates exhibit a superior specific activity and durability for the methanol oxidation reaction under acidic conditions due to the strong electronic coupling effect between the Ag2S and Pt domains.
1. Introduction
Nanocomposites composed of silver sulfide (Ag2S) and platinum (Pt) have been demonstrated in our previous studies as potential candidates in electrocatalysis.1,2 The electron transfer from Ag2S to Pt in the composite material due to the alignment of energy levels leads to a substantial increase in the electron density around the Pt domain, which inhibits the chemisorption of CO and promotes the methanol oxidation reaction (MOR).3 The selectivity of the Ag2S–Pt nanocomposites for the MOR could even be used to construct a membraneless direct methanol fuel cell (DMFC) by integrating it with a cathode selective catalyst.4 The strategies used to prepare Ag2S–Pt nanocomposites were usually carried out via a solution-based approach either by depositing Pt metal on the Ag2S seeds3 or by a structural conversion process.5,6 Unfortunately, the shortcomings of the current synthetic routes are apparent. For the seed-mediated growth, BSPP(bis(p-sulfonatophenyl)phenyl phosphane) was used to direct the synthesis of the Ag2S seeds in the aqueous phase, followed by the reduction of Pt precursors using sodium citrate to form Ag2S–Pt heterogeneous nanocomposites. However, the expensive nature of BSPP and the aqueous phase entailed that the synthesis could only be performed at very low concentrations.3 For the structural conversion, core–shell Ag–Pt nanoparticles were used as precursors to react with the elemental sulfur for the production of nanocomposites consisting of Ag2S and hollow Pt nanostructures. However, the high content of Ag in the core–shell Ag–Pt precursors makes the formed Ag2S–hollow Pt nanocomposites have a very low surface area exposed to the electrochemical reactions.5In this study, we report an organic synthesis to address the abovementioned deficiencies in the standard synthesis of Ag2S–Pt nanocomposites. The novelty of this work lies in its synthetic approach, which is based on a combination of the phase transfer of Ag+ ions with the inhibition of Ag2S growth on the carbon substrates to generate Ag2S–Pt nanocomposites with fine sizes. This strategy starts with a dodecylamine (DDA)-based phase transfer of Ag+ ions from the aqueous phase to a non-polar organic solvent such as toluene. The transferred Ag+ ions are then loaded on the carbon substrates, followed by reaction with elemental sulfur to form carbon-supported Ag2S nanocrystals (Ag2S/C). Finally, the Ag2S nanocrystals are used as seeds for the deposition of Pt metal, resulting in the formation of Ag2S–Pt nanocomposites on the carbon substrates. The microscopic analyses indicate that the as-prepared carbon-supported Ag2S–Pt nanocomposites (Ag2S–PtNCs/C) are fine in size and have a core–shell construction. We demonstrated that the Ag2S–PtNCs/C display a superior specific activity and durability in the MOR under acidic conditions. The overall fine sizes and thin Pt shell thickness, which are essential for a high specific surface area and for making the use of electronic coupling effect between the Ag2S and Pt domains, may account for the enhanced catalytic performance of the Ag2S–PtNCs/C in the MOR. This concept may shed some light on the production of cost-effective and efficient electrocatalysts on a large scale.
2. Experimental
2.1 Reagents and material
Potassium tetrachloroplatinate(II) (K2PtCl4, 98%), silver nitrate (AgNO3, 99%), acetic acid (CH3COOH, 98%), aqueous HClO4 solution (70%, ACS reagent), and Nafion 117 solution (5% in a mixture of lower aliphatic alcohols and water) from Aladdin Reagents; ethanol (99.5%), methanol (99%), and toluene (99.5%) from Beijing Chemical Works; elemental sulfur powder (S, chemical grade) from Xilong Chemical Co. Ltd.; oleylamine (70%, technical grade) from Sigma-Aldrich; dodecylamine (DDA, chemical grade) from Sinopharm Chemical Co. Ltd.; and Vulcan XC-72 carbon powder (XC-72C) with a BET surface area of ca. 250 m2 g−1 and an average particle size of ca. 40 nm from Cabot, were used as received. All glassware and Teflon-coated magnetic stirring bars were cleaned with aqua regia, followed by copious rinsing with deionized water before drying in an oven.2.2 Synthesis of the fine carbon-supported Ag2S nanocrystals (Ag2S/C)
A DDA-based phase transfer method was used to synthesize the carbon-supported Ag2S nanocrystals with fine sizes. Typically, 50 mL of aqueous AgNO3 solution (2 mM) was mixed with 50 mL of ethanol containing 1 mL of DDA for the formation of DDA–Ag+ complexes.7,8 After 3 min of stirring, 50 mL of toluene was added and stirred for another 1 min. Subsequently, the upper toluene layer was collected, and a measured amount of XC-72C was added to it. The mixture was then stirred for 6 h to make Ag+ ions fully adsorb on the carbon substrate. Separately, a sulfur solution was prepared by dissolving 0.5 mmol of sulfur into 10 mL of toluene, which was then added to the as-prepared Ag+/C mixture (the molar ratio of Ag/S was set at 1/5). Further stirring for 12 h at room temperature was required for the formation of the carbon-supported Ag2S nanocrystals (Ag2S/C with 5, 10, or 20 wt% Ag2S on the carbon support). Once the reaction was finished, the Ag2S/C nanocrystals were collected by centrifugation and subsequently washed thrice with toluene.2.3 Synthesis of fine carbon-supported Ag2S–Pt nanocomposites (Ag2S–PtNCs/C)
For the preparation of Ag2S–PtNCs/C, the as-prepared Ag2S/C (10 wt% Ag2S on the carbon support) was redispersed in a 20 mL of oleylamine in a three-necked flask fitted with a condenser and a stirring bar. The solution was heated to 110 °C, and then 0.05 mmol of K2PtCl4 was added to the mixture under vigorous stirring. The resulting reaction system was kept at 110 °C for 2 h so as to allow the reduction of Pt2+ ions by oleylamine on the surface of the fine Ag2S nanocrystals. The as-obtained Ag2S–PtNCs/C were collected by centrifugation, washed thrice with methanol, and then dried in vacuum at room temperature for further characterizations and electrochemical measurements.2.4 Sample characterizations
Transmission electron microscopy (TEM) and high-resolution TEM (HRTEM) were performed using a JEOL JEM-2100F electron microscope operating at 200 kV with supplied software for an automated electron tomography. An energy dispersive X-ray spectroscopy (EDX) analyzer attached to a FEI Tecnai G2 F20 electron microscope operating in the scanning STEM mode was used to determine the structure of the Ag2S–Pt composite nanomaterials. The samples for TEM, HRTEM, and STEM characterizations were prepared by dispensing a drop of the nanocrystal solution onto a 3 mm carbon-coated copper grid. Excess solution was removed by an absorbent paper, and the samples were dried in air at room temperature. The average particle diameter and the standard deviations were calculated from a few randomly chosen areas in the TEM image containing 100 nanoparticles each. Powder X-ray diffraction (XRD) measurements were carried out using a Bruker D8 focus X-ray diffractometer under Cu-Kα radiation (λ = 1.5406 Å). X-ray photoelectron spectroscopy (XPS) analysis was conducted using a VG ESCALAB MKII spectrometer. Samples employed for the XRD and XPS analyses were Ag2S/C nanocrystals and Ag2S–PtNCs/C collected by centrifugation from their reaction mixtures, which were washed thrice with methanol and dried in vacuum at room temperature.2.5 Electrochemical measurements of the Ag2S–PtNCs/C-catalyzed MOR
Electrochemical measurements were carried out in a standard three-electrode cell connected to a Bio-logic VMP3 (with EC-lab software version 9.56) potentiostat. A leak-free Ag/AgCl electrode (saturated with KCl) was used as the reference electrode. The counter electrode was a platinum mesh (1 × 1 cm2) attached to a platinum wire.For the evaluation of the catalytic activity in the MOR, the Ag2S–PtNCs/C were first refluxed in acetic acid at 120 °C for 3 h to remove the surface coatings,9 and then 10 mg of the as-prepared Ag2S–PtNCs/C (8 wt% Pt on the carbon support) was dispersed into 10 mL of aqueous solution containing 4 mL of ethanol and 0.1 mL of Nafion solution. A calculated volume of the as-obtained catalyst ink was dispensed onto a 5 mm glassy carbon disk electrode to produce a nominal catalyst loading of 8 μg cm−2 (based on the Pt content). The carbon electrode was then dried in a stream of warm air at 70 °C for 1 h.
The cyclic voltammograms of Ag2S–PtNCs/C and commercial Pt/C catalysts were obtained in an argon-purged HClO4 (0.1 M) at room temperature to determine the electrochemically active surface areas (ECSAs) of Pt. The catalyst performance in the MOR was also evaluated by cyclic voltammetry in an electrolyte (1 M methanol in 0.1 M perchloric acid) within a potential window of −0.2 V to 1 V at a scanning rate of 20 mV s−1. The current densities for the tested catalysts were normalized by their ECSAs to obtain the specific activities.
3. Results and discussion
In this study, we aimed at making use of the substrates to inhibit the growth of Ag2S nanocrystals for the preparation of Ag2S–Pt nanocomposites with fine sizes. The overall strategy for the synthesis of Ag2S–Pt nanocomposites with fine sizes on the surface of carbon substrates is summarized in Fig. 1. It was confirmed using ICP-AES (inductively coupled plasma atomic emission spectroscopy) analysis that the loading efficiency of Ag+ ions on the XC-72C carbon support from the organic medium (ca. 100%) is much higher than that from the aqueous phase (ca. 35%); therefore, before loading on the surface of the carbon substrates, Ag+ ions were first transferred to toluene via a process mediated by ethanol and dodecylamine.7,8 Then, upon mixing with elemental sulfur in toluene, Ag+ ions were converted into the Ag2S nanocrystals on the surface of the carbon support. The as-prepared carbon-supported Ag2S nanocrystals were subsequently used as seeds for the growth of a Pt metal shell in oleylamine, as indicated by the last step in Fig. 1.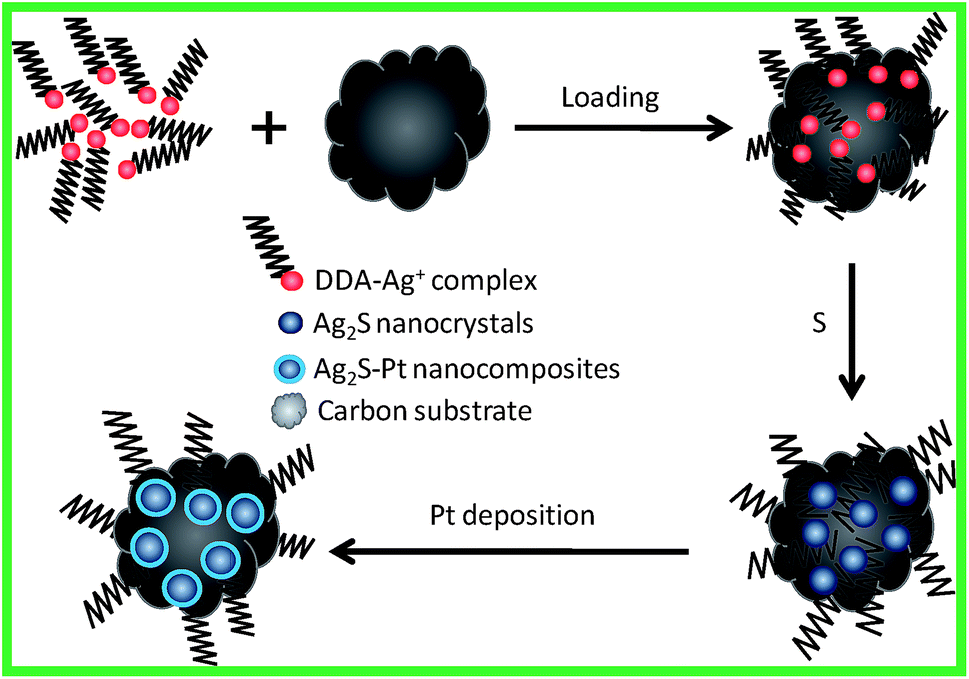 | ||
| Fig. 1 Schematic for the synthesis of Ag2S–Pt nanocomposites with fine sizes on the surface of carbon substrates. | ||
The successful synthesis of Ag2S nanocrystals on the surface of carbon substrates was confirmed by the powder X-ray diffraction (XRD) pattern, as shown in Fig. S1b in the ESI.† This XRD image for the Ag2S/C sample with a Ag2S/C mass ratio of 10% demonstrates that the as-prepared Ag2S nanocrystals have a monoclinic phase (ESI Fig. S1a† for the Ag2S reference with JCPDS card no. 140072). Fig. 2 shows the TEM images of the Ag2S nanocrystals supported on carbon with a Ag2S/C mass ratio of 20% (Fig. 2a), 10% (Fig. 2c), and 5% (Fig. 2e), which are spherical, monodispersed, and uniformly dispersed on the carbon substrates. The boundaries between the Ag2S particles and the carbon substrates could be clearly discerned from the brightness contrast. The HRTEM images (inset in each TEM image) illustrate the lattice planes in these Ag2S/C nanocrystals, confirming their high crystallinity. Moreover, as indicated by the corresponding particle size distributions (Fig. 2b, d and f), the average sizes for the carbon-supported Ag2S nanocrystals are 4.85 nm with a standard deviation of 0.10 nm for the nanocrystals with a Ag2S/C mass ratio of 20%, 4.03 nm with a standard deviation of 0.12 nm for the nanocrystals with a Ag2S/C mass ratio of 10%, and 3.69 nm with a standard deviation of 0.14 nm for the nanocrystals with a Ag2S/C mass ratio of 5%. As expected, the average diameter of the Ag2S nanocrystals on the surface of carbon substrates is much smaller than that obtained in the aqueous phase by using BSPP–Ag+ complexes as precursors (7.2 nm)3 or that obtained from the thiol-stabilized Ag clusters in an organic medium (16 nm).10
 | ||
| Fig. 2 TEM images (a, c, and e) and histograms with the size distributions (b, d, and f) of Ag2S particles supported on carbon with a Ag2S/C mass ratio of 20% (a and b), 10% (c and d), and 5% (e and f). | ||
We chose Ag2S/C nanocrystals with a Ag2S/C mass ratio of 10% as seeds for the preparation of carbon-supported Ag2S–Pt nanocomposites (Ag2S–PtNCs/C). As indicated in the TEM image (Fig. 3a) of the as-prepared Ag2S–PtNCs/C, the average diameter of the Ag2S nanocrystals on the surface of carbon substrates is increased from 4.03 nm to 5.04 nm after the deposition of Pt. This increase in the particle size might be attributable to the formation of the Pt shell with a thickness of 0.5 nm, which corresponds to 1–2 layers of Pt. Since the semiconductor nanocrystals have a catalytic capability for the reduction of metal ion precursors (in this case, Ag2S and Pt ions),7,11,12 the isolated Pt deposition on the XC-72 carbon substrate is less favourable. In the TEM images, the nanocomposites constructed with semiconductors and noble metals usually have apparent brightness contrasts between the semiconductor and metal domains due to the difference in the electron densities.3,5,13–19 In this study, although we did not succeed to observe the brightness contrasts between the Ag2S and Pt domains in the Ag2S–Pt nanocomposites due to their fine particle sizes and the influence of the carbon background, a successful synthesis of the Ag2S–Pt nanocomposites as well as their structural features could be inferred by the HRTEM image and the EDX-based line scanning and mapping analyses in the STEM mode. Fig. 3b shows the HRTEM image of a single Ag2S–Pt composite particle on the carbon substrates, in which the lattice difference between the peripheral and central regions indicates that the growth of Pt uniformly occurred on the Ag2S seed, leading to the formation of Ag2S–Pt nanocomposites with a core–shell construction. The distributions of Pt, Ag, and S elements in an arbitrary single particle, which were analyzed by EDX under the high-angle annular dark-field scanning TEM (HAADF-STEM) mode, were also used to confirm the core–shell structure of the Ag2S–Pt nanocomposites. Nanoscale elemental mapping images (Fig. 3c–g) revealed that Ag and S in the composite particles are concentrated in the core region, whereas Pt is distributed throughout the entire particle, clearly suggesting the formation of a Ag2S–Pt core–shell structure. Mapping analyses are fairly consistent with the element profiles of two arbitrary single Ag2S–Pt particles (Fig. 3h and i), which also support that the Ag2S–Pt nanocomposites formed on the carbon substrates by seed-mediated growth have a core–shell structure. The XRD pattern of the as-prepared Ag2S–PtNCs/C was analyzed, as shown in Fig. S1c in the ESI.† Note that although the HRTEM image and STEM-based scanning and mapping analyses in Fig. 3 collectively illustrate the formation of core–shell Ag2S–Pt nanocomposites on the surface of carbon substrates, the diffraction peaks from Pt metal are hardly detectable (as evinced by Fig. S1d in the ESI† for the Pt reference with JCPDS card no. 882343). The diffraction peaks in Fig. S1c (in the ESI†) also show the feature of a monoclinic Ag2S phase. Hence, it could be supposed that the interplanar spacing of Pt changes to match the lattice distances in Ag2S for its epitaxial growth on the surface of Ag2S seeds, analogous to that occurred in the core–shell CdSe–Pt hybrid systems.20 In addition, although Pt atoms, reduced from their precursors, preferentially nucleate on the existing fine Ag2S nanocrystals rather than on the carbon substrates, the final composite products are quite different from the Ag2S–Pt nanocomposites synthesized in the aqueous phase, in which the Pt dots instead of continuous Pt shells are decorated on the multiple sites of the surface of the 7.2 nm Ag2S nanocrystals.3
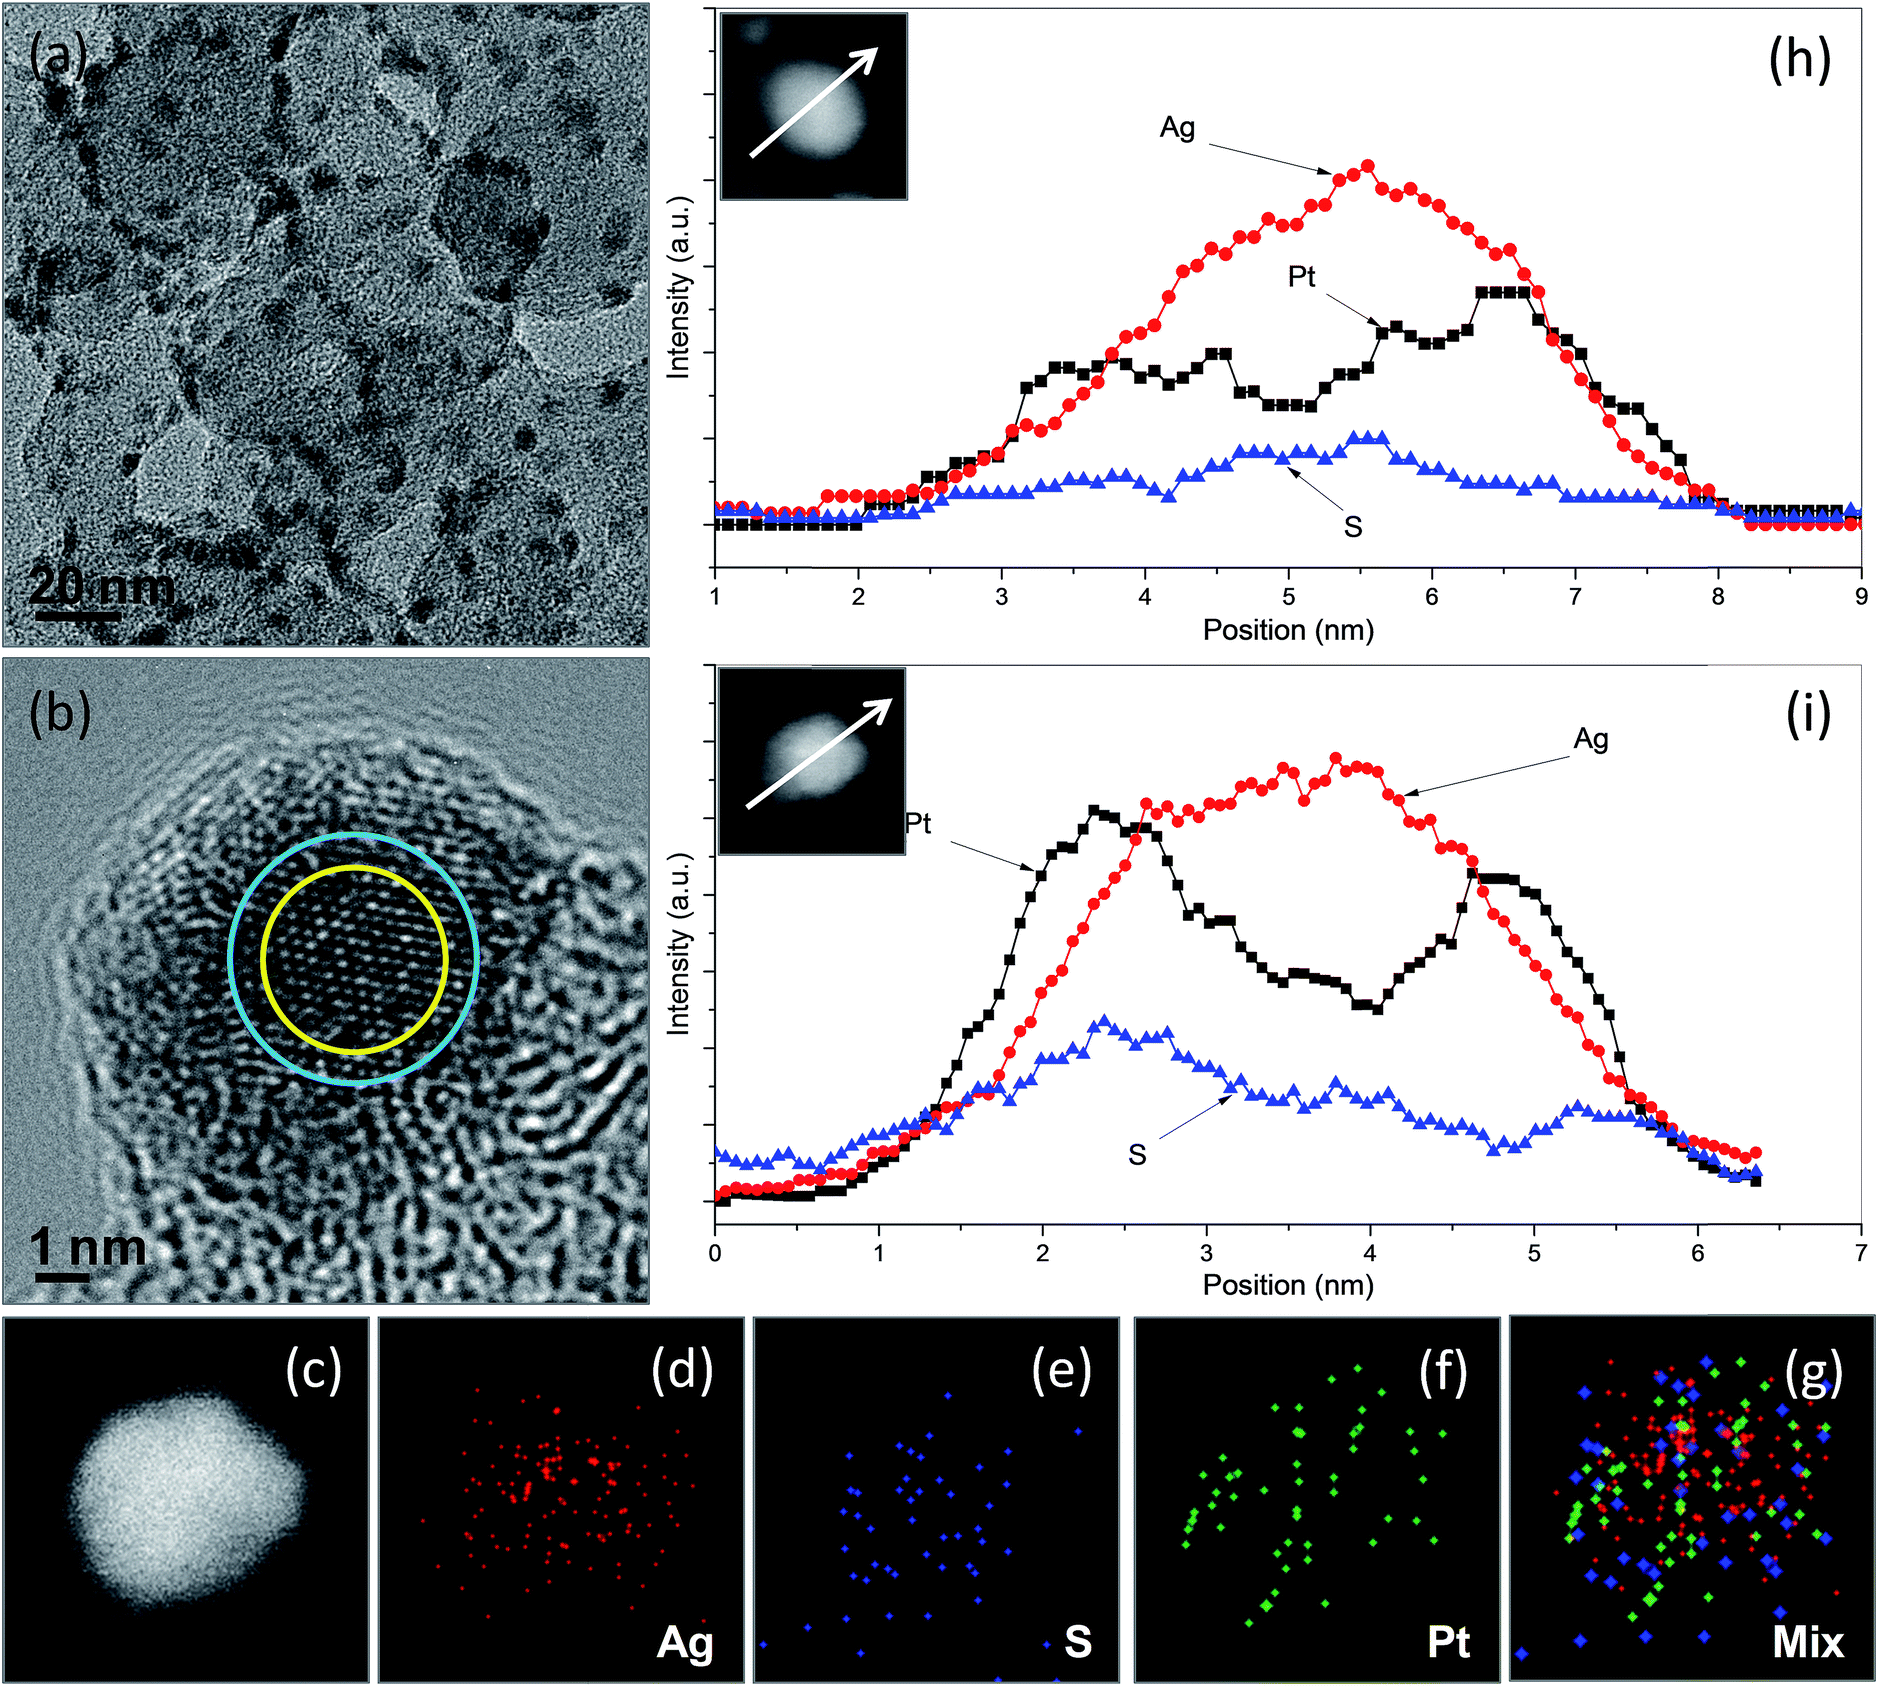 | ||
| Fig. 3 TEM image (a), HRTEM image (b), nanoscale element mappings (c–g), and elemental profiles in STEM mode (h and i) of Ag2S–Pt nanocomposites supported in carbon substrates prepared in oleylamine at elevated temperature using Ag2S/C with mass ratio of 10% as seeds. Insets in (h) and (i) are the corresponding composite particles to obtain the Ag, S, and Pt elemental profiles. | ||
We examined the performance of Ag2S–PtNCs/C for catalyzing the methanol oxidation reaction (MOR) at room temperature and benchmarked it against that of the commercial Pt/C catalysts from Johnson Matthey (JM). As shown in Fig. 4a, cyclic voltammetry was used to determine the electrochemically active surface areas (ECSAs) of the Ag2S–PtNCs/C as well as the commercial Pt/C catalysts. The specific ECSAs, based on the unit weight of Pt and calculated by integrating the charge associated with the hydrogen adsorption/desorption potential region after double-layer correction, are 44.5 m2 g−1 for Ag2S–PtNCs/C and 73.8 m2 g−1 for the commercial Pt/C catalysts, respectively. The lower ECSA of the core–shell Ag2S–Pt nanocomposites are most likely due to the presence of residual impurities, e.g. residual DDA, amides originated from the oxidation of oleylamine ligands,21 and excess sulfur, adsorbed on the surface and their slightly larger sizes compared to those of Pt nanoparticles (ca. 3 nm) in the commercial catalysts.
 | ||
| Fig. 4 Cyclic voltammograms of the Ag2S–PtNCs/C and commercial Pt/C catalysts in an argon-purged 0.1 M HClO4 electrolyte at a scan rate of 50 mV s−1 (a); cyclic voltammograms of the Ag2S–PtNCs/C and commercial Pt/C catalysts in an argon-purged 0.1 M HClO4 electrolyte with 1 M methanol at a scan rate of 20 mV s−1 (b). | ||
Fig. 4b shows the cyclic voltammograms obtained for the MOR within a potential window of 0–1 V at a scan rate of 20 mV s−1, in which the current densities are normalized to the ECSA of Pt. As indicated, Ag2S–PtNCs/C display a superior activity in the MOR due to the electronic coupling effect between the Ag2S and Pt domains.3,4,6 In detail, the peak current density associated with the methanol oxidation in the forward scan, which is an important parameter while evaluating the catalytic activity,22,23 is 1.45 mA cm−2, which is much higher than that of the commercial Pt/C catalysts (0.99 mA cm−2). It should be emphasized that the ECSA-based specific activities indicate the intrinsic catalytic performance of Pt in different chemical environments. If the calculations were based on the geometric area (0.196 cm2) of the glassy carbon electrode, the current densities in the forward scan in the MOR for the Ag2S–PtNCs/C and commercial Pt/C catalysts are comparable, as shown in Fig. S4 in the ESI.† Moreover, the onset potential in the MOR (crosspoint between the E-axis and the linear segment of the cyclic voltammograms) is ca. 0.29 V for Ag2S–PtNCs/C, which is lower than that of the commercial Pt/C catalyst (ca. 0.32 V), indicating that the oxidation of methanol is easier on Ag2S–Pt NCs/C than that on the commercial Pt/C catalysts. In particular, the higher If/Ib (in which If and Ib are the forward and backward current densities, respectively) ratio as compared to that of the commercial Pt/C catalyst (1.45 vs. 0.61) indicates the higher durability of Ag2S–PtNCs/C for the methanol oxidation,24,25 which could be confirmed by the chronoamperometric (CA) tests. As shown in Fig. S2 in the ESI,† the chronoamperograms show that the current density of Ag2S–PtNCs/C is higher than that of the commercial Pt/C for the entire time course, verifying that Ag2S–PtNCs/C exhibit a better electrocatalytic performance in the MOR.
The electronic coupling effect could be qualitatively illustrated by analyzing the binding energies of the Pt 4f region in the Ag2S–PtNCs/C and commercial Pt/C catalysts. As displayed in Fig. S3 in the ESI,† while comparing with the binding energies of Pt 4f for commercial Pt/C catalysts, a shift to lower values is observed for Ag2S–PtNCs/C, indicating that there is an electron transfer or drift from the Ag2S core to the Pt shell in the nanocomposites. Analogous to the electron donation from Sn to Pt in the bimetallic Pt–Sn system and in other composite systems combining dielectric property with thermal conductivity,26–28 the electron transfer/drift from Ag2S to Pt can lead to a substantial increase in the electron density around the Pt atoms, which is favorable for weakening the chemisorption of CO-like intermediates, produced during methanol oxidation, on the Pt atoms, hence promoting the MOR by preventing the Pt surface from CO poisoning.
4. Conclusions
In summary, we demonstrated an organic-based synthesis of the carbon-supported Ag2S–Pt nanocomposites with fine sizes by combining the phase transfer of Ag+ ions with oleylamine reduction of the Pt metal precursors. The Ag2S–Pt nanocomposites prepared on the surface of carbon substrates had a core–shell structure, with the thickness of the Pt shell being ca. 0.5 nm, corresponding to the 1–2 Pt atomic layers. The fine carbon-supported Ag2S–Pt nanocomposites exhibited a superior activity and durability in the methanol oxidation reaction under acidic conditions due to the strong electronic coupling between the Ag2S and Pt domains. By optimizing the overall particle size and the Pt shell thickness of the nanocomposites, we may further improve the catalytic activity of the carbon-supported Ag2S–Pt nanocomposites in the methanol oxidation. In addition, the strategy used in this work might be extended for the generation of other semiconductor, e.g. CdS and PbS, or composite nanosystems, e.g. CdS–Pt and PbS–Pt, with fine sizes for electrocatalytic applications.Acknowledgements
Financial supports from the National Natural Science Foundation of China (Grant No. 21376247, 21506225, 21573240), the Center for Mesoscience, the Institute of Process Engineering, the Chinese Academy of Sciences (COM2015A001), the New Faculty Start-up funding in South China University of Technology, and the Fundamental Research Funds for the Central Universities are gratefully acknowledged.Notes and references
- H. Liu, Y. Feng, D. Chen, C. Li, P. Cui and J. Yang, J. Mater. Chem. A, 2015, 3, 3182 CAS.
- J. Qu, F. Ye, D. Chen, Y. Feng, Q. Yao, H. Liu, J. Xie and J. Yang, Adv. Colloid Interface Sci., 2016, 230, 29 CrossRef CAS PubMed.
- J. Yang and J. Y. Ying, Angew. Chem., Int. Ed., 2011, 50, 4637 CrossRef CAS PubMed.
- Y. Feng, J. H. Yang, H. Liu, F. Ye and J. Yang, Sci. Rep., 2014, 4, 3813 Search PubMed.
- H. Liu, F. Ye, H. Cao, G. Ji, J. Y. Lee and J. Yang, Nanoscale, 2013, 5, 6901 RSC.
- Y. Feng, H. Liu, P. Wang, F. Ye, Q. Tan and J. Yang, Sci. Rep., 2014, 4, 6204 CrossRef CAS PubMed.
- J. Yang, E. H. Sargent, S. O. Kelley and J. Y. Ying, Nat. Mater., 2009, 8, 683 CrossRef CAS PubMed.
- J. Yang, J. Y. Lee and J. Y. Ying, Chem. Soc. Rev., 2011, 40, 1672 RSC.
- Y. Feng, J. Pan, H. Liu and J. Yang, Particuology, 2016 DOI:10.1016/j.partic.2016.04.003.
- Y. Feng, Q. Yao, J. Li, N. Goswami, J. Xie and J. Yang, Nano Res., 2016, 9, 942 CrossRef CAS.
- J. Yang, H. I. Elim, Q. Zhang, J. Y. Lee and W. Ji, J. Am. Chem. Soc., 2006, 128, 11921 CrossRef CAS PubMed.
- W. Hu, H. Liu, F. Ye, Y. Ding and J. Yang, CrystEngComm, 2012, 14, 7049 RSC.
- T. Mokari, E. Rothenberg, I. Popov, R. Costi and U. Banin, Science, 2004, 304, 1787 CrossRef CAS PubMed.
- T. Mokari, C. G. Sztrum, A. Salant, E. Rabani and U. Banin, Nat. Mater., 2005, 4, 855 CrossRef CAS.
- G. Menagen, D. Mocatta, A. Salant, I. Popov, D. Dorfs and U. Banin, Chem. Mater., 2008, 20, 6900 CrossRef CAS.
- M. Li, X. F. Yu, S. Liang, X. N. Peng, Z. J. Yang, Y. L. Wang and Q. Q. Wang, Adv. Funct. Mater., 2011, 21, 1788 CrossRef CAS.
- N. E. Motl, J. F. Bondi and R. E. Schaak, Chem. Mater., 2012, 24, 1552 CrossRef CAS.
- D. Wang, X. Li, H. Li, L. Li, X. Hong, Q. Peng and Y. Li, J. Mater. Chem. A, 2013, 1, 1587 CAS.
- K. Vinokurov, Y. Bekenstein, V. Gutkin, I. Popov, O. Millo and U. Banin, CrystEngComm, 2014, 16, 9506 RSC.
- J. H. Yang, X. Chen, F. Ye, C. Wang, Y. Zheng and J. Yang, J. Mater. Chem., 2011, 21, 9088 RSC.
- X. Liu, M. Atwater, J. Wang, Q. Dai, J. Zou, J. P. Brennan and Q. Huo, J. Nanosci. Nanotechnol., 2007, 7, 3126 CrossRef CAS PubMed.
- Y. Wang, Q. He, J. Guo, H. Wei, K. Ding, H. Lin, S. Bhana, X. Huang, Z. Luo, T. D. Shen, S. Wei and Z. Guo, ChemElectroChem, 2015, 2, 559 CrossRef CAS.
- Y. Wang, J. Clancey, G. Lu, J. Liu, L. Liu, J. Chaudhuri, S. George, M. Xie, S. Wei and Z. Guo, J. Electrochem. Soc., 2016, 163, F1 CrossRef CAS.
- D. Xu, Z. Liu, H. Yang, Q. Liu, J. Zhang, J. Fang, S. Zou and K. Sun, Angew. Chem., Int. Ed., 2009, 48, 4217 CrossRef CAS PubMed.
- K. Wang, R. Sriphathoorat, S. Luo, M. Tang, H. Du and P. K. Shen, J. Mater. Chem. A, 2016, 4, 13425 CAS.
- A. K. Shukla, A. S. Aricò, K. M. El-Khatib, H. Kim, P. L. Antonucci and V. Antonucci, Appl. Surf. Sci., 1999, 137, 20 CrossRef CAS.
- J. Gu, N. Li, L. Tian, Z. Lv and Q. Zhang, RSC Adv., 2015, 5, 36334 RSC.
- J. Gu, C. Liang, J. Dang, W. Dong and Q. Zhang, RSC Adv., 2016, 6, 35809 RSC.
Footnote |
| † Electronic supplementary information (ESI) available: XRD patterns of the carbon-supported Ag2S seeds and Ag2S–Pt nanocomposites, chronoamperograms and Pt 4f XPS spectra of carbon-supported Ag2S–Pt nanocomposites and commercial Pt/C catalysts. See DOI: 10.1039/c6ra26630d |
| This journal is © The Royal Society of Chemistry 2017 |