DOI:
10.1039/C6RA26572C
(Paper)
RSC Adv., 2017,
7, 3413-3418
Two rare meroterpenoidal rotamers from Ganoderma applanatum†
Received
9th November 2016
, Accepted 29th November 2016
First published on 13th January 2017
Abstract
Applanatumols Z3 (1) and Z4 (2), two novel natural product hybrids consisting of a meroterpenoid and a glycerol and three known compounds (3–5) were isolated from the fruiting bodies of the fungus Ganoderma applanatum. Their structures were elucidated by means of spectroscopic methods, ECD and 13C NMR calculations. It is of particular interest that 1 and 2 are rare separable conformers. Racemic 1 and 2 were further separated by chiral HPLC to afford their respective enantiomers, whose biological activities were evaluated against JAK3 and DDR1 kinases.
1. Introduction
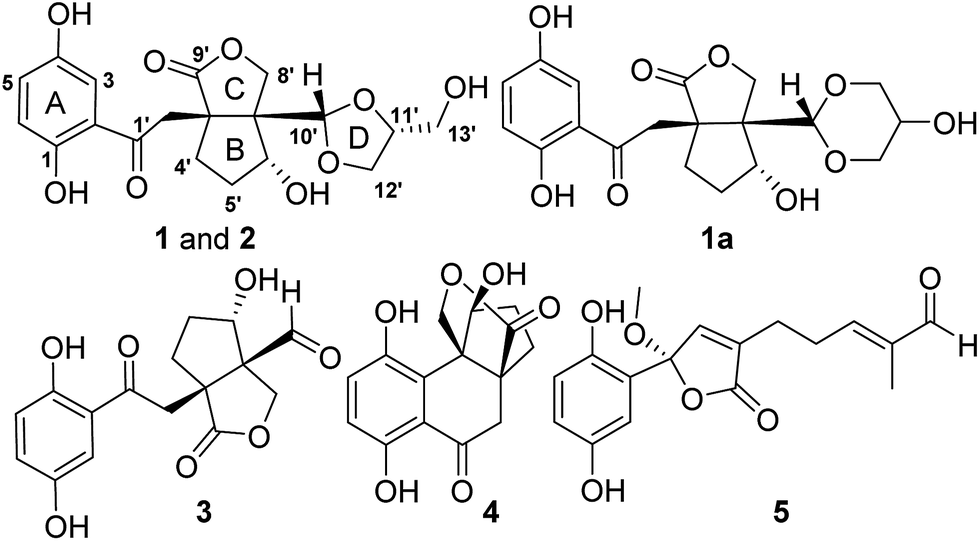
Ganoderma fungi are well-known mushrooms in some Asian countries due to their medicinal and economic value. In China, several Ganoderma species are used as lingzhi. Lingzhi mushrooms are called “cure-all medicine” indicating their wide pharmacological activities and therapeutic indications. However, chemical investigations on lingzhi in the last decades focused mainly on triterpenoids and polysaccharides,1,2 the other classes of substances present in Ganoderma were largely ignored. We have characterized several meroterpenoids as a new class of metabolites from Ganoderma.3–10 Biological evaluation revealed their potential on oxidative stress,2,3 inflammation,2 and T-type calcium channels.7 To further explore the chemical and biological diversity of meroterpenoids in Ganoderma, the title fungal species was studied and structurally novel meroterpenoids were described by us.4–7 In the course of our continuing efforts on this species, applanatumols Z3 and Z4 as two novel meroterpenoidal hybrids as well as conformers were isolated (Fig. 1). Considering that G. applanatum is used for treating cancer, fibrosis, diabetic nephropathy, and tuberculous allergic arthritis in Chinese folk, and JAK3 (Janus kinase 3) and DDR1 (discoidin domain receptor 1) are attractive drug targets for the above diseases,11,12 the biological activities of the isolates towards these targets were therefore accessed.
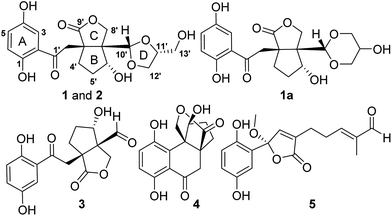 |
| | Fig. 1 The chemical structures of 1–5. | |
2. Results and discussion
2.1. Structure elucidation
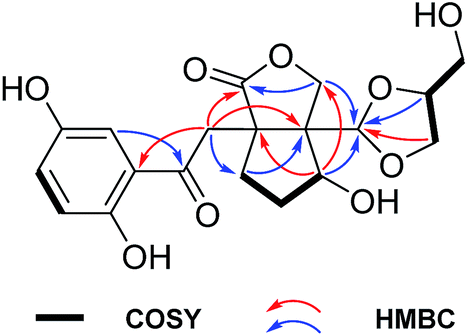
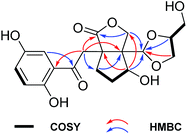
(±)-Applanatumol Z3 (1), obtained as a yellowish powder, has the molecular formula C19H22O9 (9 degrees of unsaturation), based on analysis of its HREIMS, 13C NMR and DEPT spectra. The 1H NMR spectrum (Table 1) of 1 contains a typical ABX spin system [δH 7.79 (1H, d, J = 2.9 Hz, H-3), 7.35 (1H, dd, J = 8.9, 2.9 Hz, H-5), 7.07 (1H, d, J = 8.9 Hz, H-6)], suggesting the presence of a 1,2,4-trisubstituted benzene. Interpretation of 1D and 2D NMR data discloses that the structure of compound 1 resembles that of lingzhilactone B (3)13 but differing in the substructure around ring D. The 1H–1H COSY correlations of H-12′/H-11′/H-13′ in consideration of chemical shifts of C-11′, C-12′ and C-13′ indicate the presence of a glycerol residue. HMBC correlations (Fig. 2) of H-11′, H-12′/C-10′ and the diagnostic chemical shift of C-10 (δC 106.7) evidently suggest the presence of ring D. Therefore, the planer structure of 1 was identified, which is actually a product of 3 reacting with a glycerol.
Table 1 1H and 13C NMR data of 1 and 2 (δ in ppm, J in Hz)
| No. |
1a |
1b |
2b |
| δH |
δC |
δH |
δC |
δH |
δC |
| Recorded at 500 (125) MHz in pyridine-d5. Recorded at 600 (150) MHz in methanol-d4. |
| 1 |
|
155.8 |
|
156.4 |
|
156.4 |
| 2 |
|
120.7 |
|
120.0 |
|
120.1 |
| 3 |
7.79 d (2.9) |
116.2 |
7.21 d (2.9) |
115.3 |
7.22 d (2.9) |
115.3 |
| 4 |
|
151.4 |
|
150.8 |
|
150.8 |
| 5 |
7.35 d (8.9, 2.9) |
126.4 |
7.03 d (8.9, 2.9) |
126.5 |
7.02 d (8.9, 2.9) |
126.3 |
| 6 |
7.07 d (8.9) |
119.8 |
6.81 d (8.9) |
119.9 |
6.80 d (8.9) |
119.9 |
| 1′ |
|
204.4 |
|
205.1 |
|
205.1 |
| 2′ |
Ha: 4.21 d (19.2) |
45.9 |
Ha: 3.89 d (19.1) |
45.4 |
Ha: 3.93 d (19.1) |
45.3 |
| |
Hb: 4.00 d (19.2) |
|
Hb: 3.54 d (19.1) |
|
Hb: 3.52 d (19.1) |
|
| 3′ |
|
53.3 |
|
54.3 |
|
54.5 |
| 4′ |
Ha: 2.22 m |
35.8 |
Ha: 1.99 m |
35.8 |
Ha: 1.99 m |
35.6 |
| |
Hb: 1.83 m |
|
Hb: 1.78 m |
|
Hb: 1.83 m |
|
| 5′ |
Ha: 2.06 m |
31.7 |
Ha: 2.02 m |
31.5 |
Ha: 2.03 m |
31.9 |
| |
Hb: 1.76 m |
|
Hb: 1.39 m |
|
Hb: 1.39 m |
|
| 6′ |
4.92 dd (10.5, 6.3) |
74.3 |
4.53 dd (11.2, 6.5) |
74.7 |
4.56 dd (11.0, 6.6) |
74.9 |
| 7′ |
|
55.5 |
|
55.6 |
|
55.5 |
| 8′ |
Ha: 5.44 d (9.0) |
68.2 |
Ha: 4.89 d (9.3) |
68.9 |
Ha: 4.89 d (9.2) |
68.8 |
| |
Hb: 4.77 d (9.0) |
|
Hb: 4.34 d (9.3) |
|
Hb: 4.32 d (9.2) |
|
| 9′ |
|
183.1 |
|
185.0 |
|
185.0 |
| 10′ |
5.35 s |
106.7 |
4.90 s |
106.8 |
4.85 s |
106.8 |
| 11′ |
4.14 m |
77.3 |
4.01 m |
77.8 |
4.04 m |
78.2 |
| 12′ |
Ha: 4.02 t-like (7.7) |
67.8 |
Ha: 3.85 t-like (7.7) |
67.7 |
Ha: 3.74 t-like (7.8) |
67.6 |
| |
Hb: 3.88 t-like (7.4) |
|
Hb: 3.75 dd (7.7, 6.8) |
|
Hb: 3.68 dd (8.1, 5.6) |
|
| 13′ |
Ha: 3.92 dd (11.7, 4.0) |
61.4 |
Ha: 3.66 dd (12.1, 3.7) |
62.2 |
Ha: 3.59 dd (11.7, 4.4) |
63.6 |
| |
Hb: 3.76 dd (11.7, 3.4) |
|
Hb: 3.52 dd (12.1, 3.9) |
|
Hb: 3.54 dd (11.7, 6.2) |
|
 |
| | Fig. 2 1H–1H COSY and key HMBC correlations of 1. | |
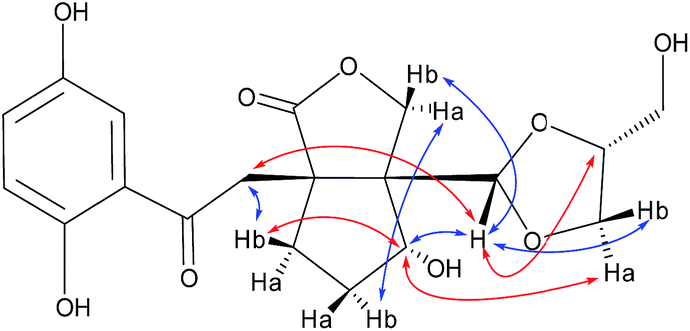
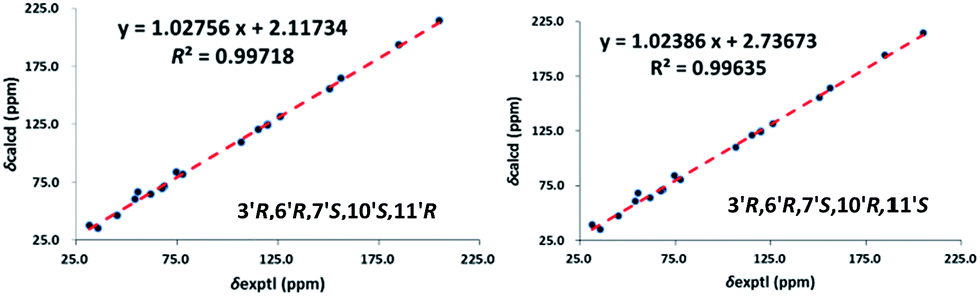
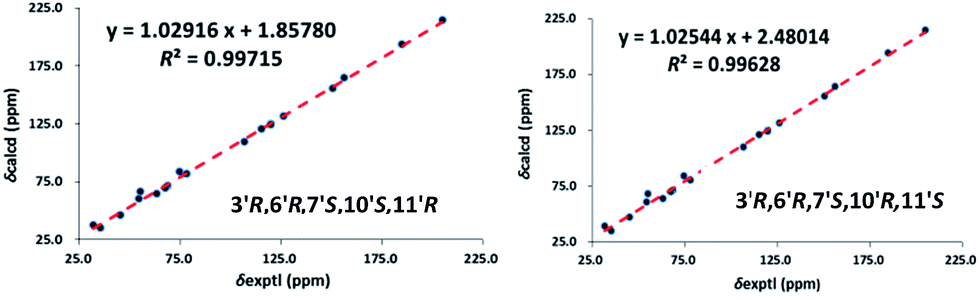
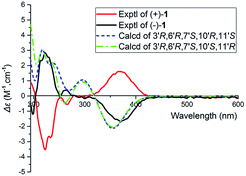
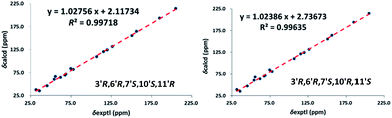
The relative configuration of 1 was assigned using ROESY data, which gave correlations (Fig. 3) of H-10′ (δH 5.35)/Ha-2′ (δH 4.21), H-6′ (δH 4.92), indicating the relative configurations at C-3′, C-6′, and C-7′. Likewise, the ROESY correlation of H-10′/H-11′ suggests that H-10′ and H-11′ are spacially vicinal, which is also evidenced from H-11′ behaving as a singlet due to the absence of a “W” coupling pattern. In addition, an observed ROESY correlation of H-6′/Ha-12′ (δH 4.02) indicates that free rotation of C-7′–C-10′ is restricted. Of note, compound 1 was isolated as an enantiomerically impure form. Further purification by chiral phase HPLC to yield (+)-1 and (−)-1. To assign the absolute configuration of 1, the ECD calculations were carried out (Fig. 4). It was found that either ECD spectrum of (3′R,6′R,7′S,10′R,11′S)-1 or (3′R,6′R,7′S,10′S,11′R)-1 agrees well with the experimental CD spectrum of (−)-1, indicating the limitation of ECD calculations in clarifying configuration of (−)-1. In this case, the 13C NMR chemical shift calculations were further utilized. The results show that the R2 (0.99718) and CMAE (2.1) for (3′R,6′R,7′S,10′S,11′R)-1 are less than those of (3′R,6′R,7′S,10′R,11′S)-1 [R2 (0.99635), CMAE (3.1)] (Fig. 5, ESI†), which suggested the absolute configuration of (−)-1 to be 3′R,6′R,7′S,10′S,11′R.
 |
| | Fig. 3 Key ROESY correlations of 1. | |
 |
| | Fig. 4 Comparison of B3LYP/6-311G(d,p) calculated ECD spectra for (3′R,6′R,7′S,10′R,11′S)-1 and (3′R,6′R,7′S,10′S,11′R)-1 with the experimental spectra of (+)-1, and (−)-1 in MeOH. σ = 0.3 eV, shift = −8 nm. | |
 |
| | Fig. 5 Regression analysis of experimental versus calculated 13C NMR chemical shifts of (3′R,6′R,7′S,10′S,11′R)-1 and (3′R,6′R,7′S,10′R,11′S)-1 at MPW1PW91-SCRF/6-311+G(2d,p) level, linear fitting was shown as a line. | |
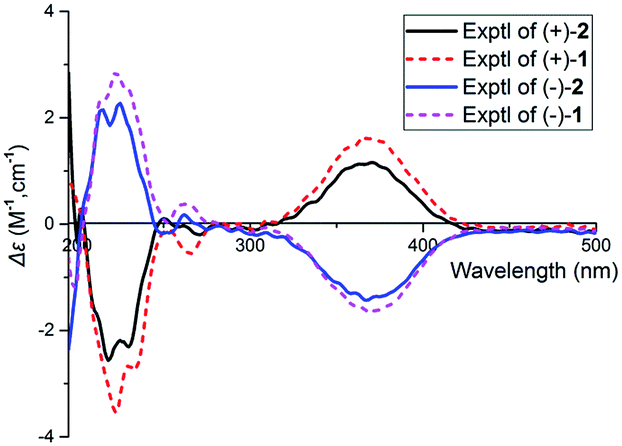
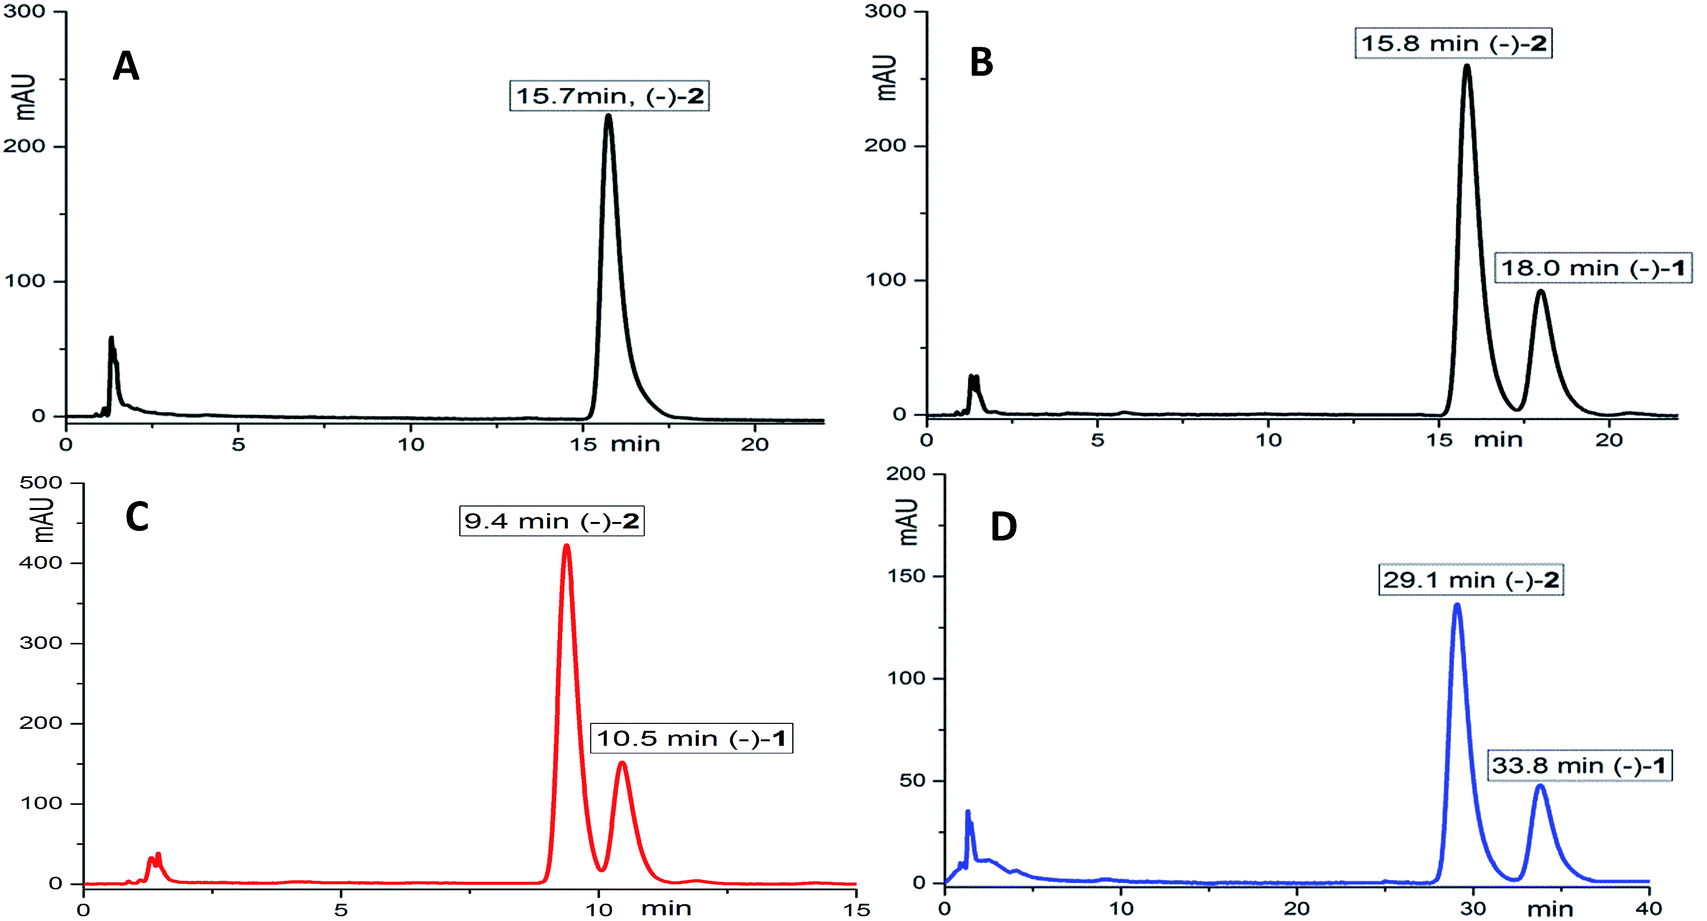
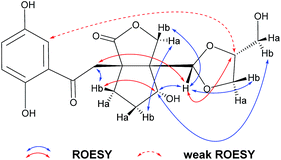
(±)-Applanatumol Z4 (2) has the molecular formula C19H22O9 deduced from its HREIMS, 13C NMR and DEPT data. The planar structure of 2 was found to be the same as that of 1 by detailed interpretation of its 1D and 2D NMR data (MeOH) (Table 1). In the same manner as that of 1, the observed ROESY correlations (Fig. 6) of Ha-2′/H-10′ (δH 4.85), H-6′ (δH 4.56) suggest that H-2′, H-6′, and H-10′ are at the same side of ring B. In addition, the correlation of H-10′/H-11′ suggests that H-10′ and H-11′ are at the same side of ring D. By far, we found that 1 and 2 possess the same planar structures and relative configurations. 2 is also racemic, subsequent chiral phase HPLC separation afforded (+)-2 and (−)-2. Whereas, the almost identical optical rotations and CD curves (Fig. 7) between (−)-1 and (−)-2 suggest they have the same absolute configurations, this conclusion was supported by 13C NMR chemical shift calculations (Fig. 8, ESI†). The results show that the R2 (0.99715) and CMAE (2.1) for (3′R,6′R,7′S,10′S,11′R)-2 are less than those of (3′R,6′R,7′S,10′R,11′S)-2 [R2 (0.99628), CMAE (2.4)], which suggested the absolute configuration of (−)-2 to be 3′R,6′R,7′S,10′S,11′R. But it was noted that racemic 1 and 2 were isolated by preparative TLC as two separable bands, and RP-HPLC analysis also indicates that (−)-1 and (−)-2 are separable two peaks (Fig. 9). To our knowledge, it is rare that two individual chromatographic peaks represent a configurationally identical structure. To clarify this observation, we made a close inspection of ROESY spectra between 1 and 2 and found that the ROESY correlation of H-6′/Ha-12′ in 1 rather than H-6′/Hb-13′ in 2 are observable, which evidently indicates that 1 and 2 are conformers. The presence of conformational isomers therefore led to slight difference of NMR data between 1 and 2. In general, the single bond between C-7′–C-10′ is flexible. However the two bulky groups located at the same orientation of ring B or C cause heavy steric hindrance which in turn results in the limitation of free rotation of C-7′–C-10′. This conclusion is also supported by the observed weak ROESY correlation of H-3/H-11′. Theoretically, conformers are hardly separable with exception of a few examples14 and their proportion is normally temperature dependent. To secure this, HPLC chromatographic behavior of a mixture of (−)-1 and (−)-2 was observed at stepwise gradient temperature alterations. It was found that the peak areas of (−)-1 and (−)-2 remain unchanged as elevated temperature (Fig. 9), which indicates that the present conformer of either 1 and 2 is stable and preferential. The reasons for this might result from randomly attacking of glycerol with the aldehyde group when acetal reaction occurs as well as the appearance of steric hindrance. In this sense, we speculate that structures like that of 1a is likely to be present in Nature. As a consequence, the structure of 2 was determined.
 |
| | Fig. 6 Key ROESY correlations of 2. | |
 |
| | Fig. 7 The experimental CD spectra of (+)-2, (−)-2, (+)-1, and (−)-1 in MeOH. | |
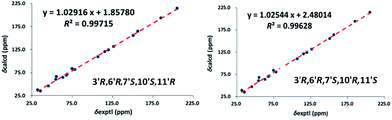 |
| | Fig. 8 Regression analysis of experimental versus calculated 13C NMR chemical shifts of (3′R,6′R,7′S,10′S,11′R)-2 and (3′R,6′R,7′S,10′R,11′S)-2 at MPW1PW91-SCRF/6-311+G(2d,p) level, linear fitting was shown as a line. | |
 |
| | Fig. 9 HPLC chromatograms of a mixture of (−)-1 and (−)-2 at varied temperatures. (A) At 30 °C, (B) at 30 °C, (C) at 45 °C, (D) at 15 °C, the chromatographic conditions: an Agilent EclipseXDB-C18 column (4.6 × 150 mm, i.d., 5 μm), flow rate 1.0 mL min−1, detection at 210 nm, mobile phase (MeOH–H2O, 26![[thin space (1/6-em)]](https://www.rsc.org/images/entities/char_2009.gif) :74). :74). | |
Three known compounds were respectively identified as (±)-lingzhilactone B (3),13 (±)-lingzhiol (4),6 and (±)-lucidulactone B (5)15 by comparing their NMR data and chiral phase HPLC behaviors.
2.2. Biological evaluation
In this context, compounds 1 and 2 were evaluated for their inhibitory activities against JAK3 and DDR1 kinases. Unfortunately, none of them exhibits biological activities in these assays even at the concentration of 30 μM. In retrospect, compounds 3 and 4 have been reported to have abilities to activate Nrf2 expression and inhibit TGF-β1 induced Smad3 phosphorylation, disclosing their renoprotective effects. In this aspect, whether the new isolates are also active towards nephropathy associated assays needs to be further examined.
3. Experimental section
3.1. General procedure
Optical rotations were recorded on a Horiba SEPA-300 polarimeter. UV spectra were collected on a Shimadzu double-beam 210A spectrometer. CD spectra were measured on a Chirascan instrument. NMR spectra were determined on an Avance III 600 spectrometer. ESIMS was measured on Xevo TQ-S instrument. EIMS and HREIMS were measured on a Waters AutoSpec Premier P776 spectrometer. RP-18 (40–60 μm, Daiso Co., Japan), MCI gel CHP 20P (75–150 μm, Tokyo, Japan), and Sephadex LH-20 (Amersham Biosciences, Sweden). Semi-preparative HPLC was carried out on an Agilent 1200 liquid chromatograph with an YMC-Pack ODS-A column (250 × 10 mm, i.d., 5 μm) and a Daicel Chiralpak (IC, 250 mm × 10 mm, i.d., 5 μm), flow rate: 2.5 mL min−1; and an Agilent EclipseXDB-C18 column (150 mm × 4.6 mm, i.d., 5 μm), flow rate 1.0 mL min−1.
3.2. Fungal material
The fruiting bodies of G. applanatum were purchased from Tongkang Pharmaceutical Co. Ltd. in Guangzhou Province, PR China, in September 2013. The material was identified by Prof. Zhu-Liang Yang at Kunming Institute of Botany, Chinese Academy of Sciences, and a voucher specimen (CHYX-0590) was deposited at the State Key Laboratory of Photochemistry and Plant Resources in West China, Kunming Institute of Botany, Chinese Academy of Sciences, PR China.
3.3. Extraction and isolation
Powdered fruiting bodies of G. applanatum (30 kg) were extracted by refluxing with 80% EtOH (3 × 120 L × 2 h) and concentrated under reduced pressure to give a crude extract, which was suspended in water followed by extraction with EtOAc to afford an EtOAc soluble extract. The EtOAc extract (0.9 kg) was divided into seven parts (Fr.1–Fr.7) by using a MCI gel CHP 20P column eluted with aqueous MeOH (20:80–100:0). Fr.2 (26.0 g) was separated by using RP-18 column chromatography eluted with gradient aqueous MeOH (20:80–40:60) to yield two fractions (Fr.2.1–Fr.2.2). Of which, Fr.2.2 (2.3 g) was purified by Sephadex LH-20 (MeOH) and semipreparative HPLC (MeOH–H2O, 30:70) to yield 3 (88.8 mg, tR = 20.3 min) and 5 (3.7 mg, tR = 17.2 min). Fr.3 (73 g) was separated by MCI gel CHP 20P eluted with gradient aqueous MeOH (30:70–60:40) to yield nine fractions (Fr.3.1–Fr.3.9). Of which, Fr.3.4 (8.0 g) was submitted to a RP-18 column (MeOH–H2O, 10:90–55:45) to afford Fr.3.4.1–Fr.3.4.8. Among them, Fr.3.4.4 (2.6 g) was gel filtrated via Sephadex LH-20 (MeOH) and further isolated by preparative TLC to afford 1 (50.0 mg), 2 (15.0 mg), and 4 (280.0 mg). Notably, compounds 1 and 2 were both isolated as racemic mixtures. An aliquote (5 mg) of 1 or 2 was underwent chiral HPLC (n-hexane–ethanol, 20:80) to afford (+)-1 (2.4 mg), (−)-1 (2.3 mg), (+)-2 (2.3 mg), and (−)-2 (2.3 mg).
3.4. Spectral data of the new compounds
3.4.1. Applanatumol Z3 (1). Yellowish powder; UV (MeOH) λmax (logε) 368 (3.67), 259 (3.95), 228 (4.20); {[α]23D +129.5 (c 0.11, MeOH); CD (MeOH) Δε223 −3.53, Δε364 +1.62; (+)-1}; {[α]23D −126.58 (c 0.08, MeOH); CD (MeOH) Δε224 +3.04, Δε364 −1.68; (−)-1}; ESIMS m/z 393 [M − H]−, HREIMS m/z 394.1266 [M]+ (calcd for C19H22O9, 394.1264); 1H and 13C NMR data, see Table 1.
3.4.2. Applanatumol Z4 (2). Yellowish powder; UV (MeOH) λmax (logε) 368 (3.56), 259 (3.83), 227 (4.10); {[α]23D +133.07 (c 0.18, MeOH); CD (MeOH) Δε208 −2.56, Δε361 +1.16; (+)-2}; {[α]23D −127.30 (c 0.19, MeOH); CD (MeOH) Δε208 +2.56, Δε361 −1.16; (−)-2}; EIMS m/z 394 [M]+, HREIMS m/z 394.1255 [M]+ (calcd for C19H22O9, 394.1264); 1H and 13C NMR data, see Table 1.
3.5. Computational study
Molecular Merck force field (MMFF) and DFT/TDDFT calculations were carried out with a Spartan'14 software package (Wavefunction Inc., Irvine, CA, USA) and a Gaussian09 program package.16 In detail, the conformational search generating low-energy conformers within a 10 kcal mol−1 was finished by software Conflex 7. Frequency calculations were run at the same level to estimate their relative thermal free energies (ΔG) at 298.15 K. Energies of the low-energy conformers in MeOH were re-calculated at the B3LYP/6-311G(d,p) level. Solvent effects were taken into account by using polarizable continuum model (PCM). ECD calculations were conducted at the B3LYP SCRF(PCM)/6-311G(d,p) level. The CD spectra were generated by the program SpecDis using a Gaussian band shape with 0.3 eV exponential half-width from dipole-length dipolar and rotational strengths. The equilibrium population of each conformer at 298.15 K was calculated from its relative free energies using Boltzmann statistics. The calculated spectra of compounds were generated from the low-energy conformers according to the Boltzmann weighting of each conformer in MeOH solution. 13C NMR calculations see ESI data.†
3.6. Assay for in vitro Janus kinase 3 (JAK3) kinase inhibition activity
The inhibitory activity of compounds 1 and 2 against JAK3 kinase was performed using the FRET-based Z′-Lyte assay system in line with the manufacturer's instructions (Invitrogen, Carlsbad, USA) and previously described methods.17 In this study, staurosporine was used as a positive control with an IC50 value of 0.31 nM.
3.7. Assay for in vitro discoidin domain receptor 1 (DDR1) kinase inhibition activity
Compounds 1 and 2 were evaluated for their inhibitory activity towards DDR1 kinase using a LanthaScreen Eu kinase activity assay technology (Invitrogen, USA). and previously described methods.17 In this study, dasatinib was used as a positive control with an IC50 value of 13.2 nM.
4. Conclusions
This study resulted in the isolation of applanatumols Z3 (1) and Z4 (2) as two novel natural product hybrids. 1 and 2 are configurationally identical but different rotamers representing rare separable conformers in Nature.
Acknowledgements
This work was financially supported by National Natural Science Foundation of China (21472199), the National Science Fund for Distinguished Young Scholars (81525026), NSFC-Joint Foundation of Yunnan Province (U1202222) and a project from State Key Laboratory of Phytochemistry and Plant Resources in West China, Kunming Institute of Botany (P2016-ZZ02).
Notes and references
- K. Wang, L. Bao, W. P. Xiong, K. Ma, J. J. Han, W. Z. Wang, W. B. Yin and H. W. Liu, J. Nat. Prod., 2015, 78, 1977 CrossRef CAS PubMed.
- I. C. F. R. Ferreira, S. A. Heleno, F. S. Reis, D. J. Stojkovic, M. J. R. P. Queiroz, M. H. Vasconcelos and M. Sokovic, Phytochemistry, 2015, 114, 38 CrossRef CAS PubMed.
- X. R. Peng, J. Q. Liu, C. F. Wang, Z. H. Han, Y. Shu, X. Y. Li, L. Zhou and M. H. Qiu, Food Chem., 2015, 171, 251 CrossRef CAS PubMed.
- Q. Luo, L. Tian, L. Di, Y. M. Yan, X. Y. Wei, X. F. Wang and Y. X. Cheng, Org. Lett., 2015, 17, 1565 CrossRef CAS PubMed.
- Q. Luo, L. Di, W. F. Dai, Q. Lu, Y. M. Yan, Z. L. Yang, R. T Li and Y. X Cheng, Org. Lett., 2015, 17, 1110 CrossRef CAS PubMed.
- Y. M. Yan, J. Ai, Y. N. L. L. Zhou, A. C. K. Chung, R. Li, J. Nie, P. Fang, X. L. Wang, J. Luo, Q. Hu, F. F. Hou and Y. X. Cheng, Org. Lett., 2013, 15, 5488 CrossRef CAS PubMed.
- F. J. Zhou, Y. Nian, Y. M. Yan, Y. Gong, Q. Luo, Y. Zhang, B. Hou, Z. L. Zuo, S. M. Wang, H. H. Jiang, J. Yang and Y. X. Cheng, Org. Lett., 2015, 17, 3082 CrossRef CAS PubMed.
- Q. Luo, X. H. Yang, Z. L. Yang, Z. C. Tu and Y. X. Cheng, Tetrahedron, 2016, 72, 4564 CrossRef CAS.
- Q. Luo, L. Di, X. H. Yang and Y. X. Cheng, RSC Adv., 2016, 6, 45963 RSC.
- Q. Luo, X. L. Wang, L. Di, Y. M. Yan, Q. Lu, X. H. Yang, D. B. Hu and Y. X. Cheng, Tetrahedron, 2015, 71, 840 CrossRef CAS.
- J. Y. Song, X. Chen, J. Bai, Q. H. Liu, H. Li, J. W. Xie, H. Jing and J. N. Zheng, Tumor Biol., 2016, 37, 11509 CrossRef CAS PubMed.
- J. Y. Yan, Z. M. Zhang, J. Yang, W. Mitch and Y. L. Wang, J. Am. Soc. Nephrol., 2015, 26, 3060 CrossRef CAS PubMed.
- Y. M. Yan, X. L. Wang, L. L. Zhou, F. J. Zhou, R. Li, Y. Tian, Z. L. Zuo, P. Fang, A. C. K. Chung, F. F. Hou and Y. X. Cheng, J. Ethnopharmacol., 2015, 176, 385 CrossRef CAS PubMed.
- W. L. Li, C. H. Jiao, X. Li, Y. S. Xie, K. Nakatani, H. Tian and W. H. Zhu, Angew. Chem., Int. Ed., 2014, 53, 4603 CrossRef CAS PubMed.
- X. F. Wang, Y. M. Yan, X. L. Wang, X. J. Ma, X. Y. Fu and Y. X. Cheng, J. Asian Nat. Prod. Res., 2015, 17, 329 CrossRef CAS PubMed.
- M. J. Frisch, G. W. Trucks, H. B. Schlegel, G. E. Scuseria, M. A. Robb, J. R. Cheeseman, G. Scalmani, V. Barone, B. Mennucci, G. A. Petersson, H. Nakatsuji, M. Caricato, X. Li, H. P. Hratchian, A. F. Izmaylov, J. Bloino, G. Zheng, J. L. Sonnenberg, M. Hada, M. Ehara, K. Toyota, R. Fukuda, J. Hasegawa, M. Ishida, T. Y. Nakajima, O. Honda, H. Kitao, T. Nakai Vreven, J. A. Montgomery Jr, J. E. Peralta, F. Ogliaro, M. Bearpark, J. J. Heyd, E. Brothers, K. N. Kudin, V. N. Staroverov, T. Keith, R. Kobayashi, J. Normand, K. Raghavachari, A. Rendell, J. C. Burant, S. S. Iyengar, J. Tomasi, M. Cossi, N. Rega, J. M. Millam, M. Klene, J. E. Knox, J. B. Cross, V. Bakken, C. Adamo, J. Jaramillo, R. Gomperts, R. E. Stratmann, O. Yazyev, A. J. Austin, R. Cammi, C. Pomelli, J. W. Ochterski, R. L. Martin, K. Morokuma, V. G. Zakrzewski, G. A. Voth, P. Salvador, J. J. Dannenberg, S. Dapprich, A. D. Daniels, O. Farkas, J. B. Foresman, J. V. Ortiz, J. Cioslowski and D. J. Fox, Gaussian 09, Revision C.01, Gaussian, Inc., Wallingford CT, 2010 Search PubMed.
- H. J. Zhu, Y. M. Yan, Z. C. Tu, J. F Luo, R. Liang, T. H. Yang, Y. X. Cheng and S. M. Wang, Fitoterapia, 2016, 114, 163 CrossRef CAS PubMed.
Footnote |
| † Electronic supplementary information (ESI) available: 1D, 2D NMR, HREIMS spectra, and 13C NMR calculation methods. See DOI: 10.1039/c6ra26572c |
|
| This journal is © The Royal Society of Chemistry 2017 |
Click here to see how this site uses Cookies. View our privacy policy here. 
 Open Access Article
 This Open Access Article is licensed under a