 Open Access Article
Prevention of active-site destruction during the synthesis of high performance non-Pt cathode catalyst for fuel cells†
Rui Lia,
Yu Jun Geb,
Fan Heb,
Li Ting Doub,
Bin Hong Liuc and
Zhou Peng Li *b
*b
aChu Kochen Honors College, Zhejiang University, Hangzhou, China
bCollege of Chemical & Biological Engineering, Zhejiang University, Hangzhou, China. E-mail: zhoupengli@zju.edu.cn; Fax: +86-571-87953149; Tel: +86-571-87953149
cCollege of Materials Science & Engineering, Zhejiang University, Hangzhou, China
First published on 20th January 2017
Abstract
Active-site destruction during the synthesis of porous non-Pt catalysts for the oxygen reduction reaction (ORR) is investigated in detail. Because of the carbon erosion caused by CO2 generated from the decomposition of CaCO3 template, active-sites are destroyed during the formation of the macroporous carbon-supported cobalt catalyst (Co/N-MPC) using Co-coordinated glucose–urea resin and a CaCO3 template. Removal of the CaCO3 template before its decomposition can effectively suppress this site destruction, thereby leading to a higher content of catalytic nitrogen species in the catalyst. Nitrogen-containing active-sites are unstable at temperatures over 800 °C. After optimizing the template removal and carbonization temperatures, the synthesized Co/N-MPC exhibits high catalytic activity towards ORR in both alkaline and acidic electrolytes. Its electron transfer number reaches 3.65 in alkaline and 3.75 in acidic electrolytes, respectively. The direct borohydride fuel cell with the synthesized Co/N-MPC shows a power density as high as 215 mW cm−2, which is comparable to that of the cell using 28.6 wt% Pt/C as a cathode catalyst under ambient conditions.
1. Introduction
A fuel cell is a device that converts chemical energy from certain fuels into electricity through an electro-oxidation reaction of fuel at the anode and an electro-reduction reaction of oxygen at the cathode. The performance of a fuel cell greatly relies on the kinetics of oxygen reduction reaction (ORR). The catalytic activity of the cathode catalyst is one of the most crucial factors in enhancing ORR. Platinum is a highly active catalyst for ORR, but its high-cost hinders fuel cell commercialization. Therefore, cheap non-Pt catalysts are attracting significant attention. They demonstrate high performance comparable to commercial Pt/C catalysts, with lower cost.1,2 In particular, some porous carbon-supported catalysts have shown a great potential for fuel cell applications.3,4Most carbon-supported non-Pt catalysts catalyze ORR on active-sites such as M–Nx (M stands for transition metal), pyridinic-N, and graphitic-N.5–10 The number of these sites on the carbon support determines their catalytic activities.11 Macroporous carbon (MPC) with high electrical conductivity is a promising carbon support because its large specific surface area ensures the capability to support more active-sites.12,13 Unlike conventional carbon-supported catalysts, such as Pt/XC-72 in which an active-site (Pt) exists on the surfaces of solid carbon particles (XC-72), MPC-supported catalysts present active-sites on the inner pore surfaces.14
MPC-supported catalysts are fabricated using the template-assisted method, via the carbonization of a composite consisting of a catalyst precursor and a template. The carbonization temperature and nature of the applied template significantly influence the active-site formation. Zeolite, silica, titania, and calcium carbonate are widely-used templates.15–33 However, zeolite, silica, and titania templates have to be removed by strong acids, leading to serious environmental problems in large-scale production.34 In contrast, a cheap CaCO3 template can be removed under mild conditions. CaCO3 decomposes into CaO and CO2 during carbonization. CO2 reacts with carbon to form CO, probably causing catalyst deterioration by active-site destruction. However, little attention has been paid to the effect of the employed template on the active-site destruction.
It has been reported that the formed Fe nanoparticles may destroy the active-sites during non-Pt catalyst preparation at a carbonization temperature over 700 °C.35 Removal of Fe species before active-site destruction effectively suppresses the nitrogen loss.36 This study investigates the influences of carbonization temperature and CO2 during catalyst synthesis on the catalytic activity towards ORR. Based on physical characterizations and electrochemical analyses, we attempt to figure out the relationship between active-site destruction and performance decline. Moreover, a strategy to suppress the active-site destruction is suggested. Verified in a direct borohydride fuel cell (DBFC), a high-performance ORR catalyst (Co/N-MPC) is presented after optimizing the catalyst synthesis conditions for the suppression of active-site destruction. The DBFC is an alkaline fuel cell with high electromotive force (1.64 V) and theoretical energy conversion efficiency (91%), using alkaline borohydride solution as the anode fuel.37,38 The DBFC with Nafion membrane is a simple and convenient model cell for the evaluation of an ORR catalyst.39
2. Method and procedures
2.1. Catalyst preparation
Ethyl silicate (Si(OC2H5)4: 12 mL) was added dropwise to an ammonium hydroxide solution (2 M, 200 mL) under stirring for 4 h. Nanosphere silica was then obtained after centrifugal separation and drying in vacuum for 6 h.Glucose monohydrate (11.00 g) and urea (1.67 g) were dissolved in 6 and 2 mL of deionized water, respectively. The urea solution was then added to the glucose solution and stirred for 40 min at 90 °C for the polymerization of glucose–urea resin. Cobalt nitrate solution (10 mL) containing 2.91 g of Co(NO3)2 was then added and stirred for 30 min to prepare the Co-coordinated glucose–urea resin. The obtained resin solution was then mixed with an emulsion containing 20.00 g of the template (nano SiO2 or CaCO3) in a 20 mL of deionized water to form a homogeneous suspension. After 1 h of evaporation at 80 °C, the obtained composite was pretreated at 110 °C for 2 h (the 1st stage). Two groups (group A and B) of Co/N-MPCs were synthesized to investigate the influences of CO2 and carbonization temperature on the catalytic activity. Group A catalysts were prepared through template removal (via HCl etching) after the 2nd stage heat treatment of the composite at 500–900 °C for 3 h. The obtained template-removed precursors were then carbonized at 900 °C for 2 h (the 3rd stage), as shown in Fig. 1. For convenience, this heat treatment temperature was named as template removal temperature (TRT), and the obtained catalyst was named as Co/N-MPC(TRT/900). Group B catalysts named as Co/N-MPC(650/700–900) were prepared via the carbonization of the template-removed precursor (TRT: 650 °C) at 700–900 °C for 2 h. For comparison, the N-containing MPC (N-MPC) or the cobalt-doped N-containing carbon (Co/N–C) were prepared without the addition of Co(NO3)2·6H2O or the template. All heat treatments were conducted under N2 atmosphere.
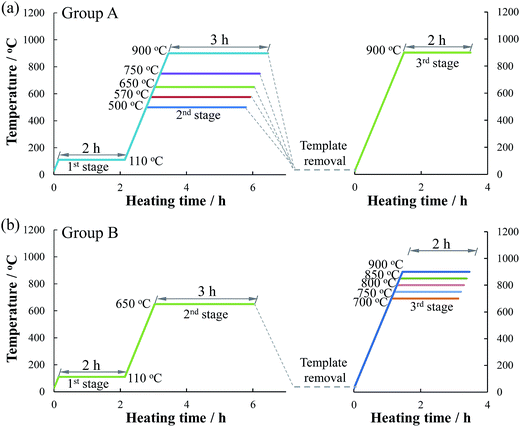 | ||
| Fig. 1 Preparation procedures of Co/N-MPCs from the mixture of Co-coordinated glucose–urea resin with template; heating rate: 10 °C min−1. | ||
2.2. Physical characterization
The structure and the morphology of the synthesized samples were characterized by X-ray diffraction (XRD) using a Rigaku-D/MAX-2550PC diffractometer with Cu-Kα radiation (λ = 1.5406 Å), ULTRA55 scanning electron microscopy (SEM, Zeiss Corp.), and transmission electron microscopy (TEM, Hitachi H-9500) at 300 kV. Nitrogen content in the synthesized catalyst was determined using an oxygen/nitrogen/hydrogen elemental analyzer (LECO ONH836). The N species and their relative contents in the synthesized catalysts were determined via X-ray photoemission spectroscopy (XPS) using a PHI-5000C ESCA system (Perkin Elmer) with Mg Kα radiation (hν = 1253.6 eV). All spectra were referenced to the C ls level at 284.6 eV to correct the peak shift that occurred because of charge accumulation on the sample. Raw data were fitted and deconvoluted using the XPS Peak 4.1 software.2.3. Electrochemical measurements
The catalytic activity of the synthesized catalysts was evaluated in a three-electrode system using the CHI 1140A electrochemical workstation (CH Instruments), with a disk electrode as the working electrode. Linear sweep voltammetry (LSV) analysis was conducted using a rotating disk electrode (RDE) (RDE-2, BASi Inc.) to evaluate the catalytic activity in both alkaline and acidic electrolytes. The electron transfer number of the ORR (n) was estimated based on the Koutecky–Levich equation:| I−1 = Ik−1 + {0.62nFAeC0D02/3v−1/6ω1/2}−1 | (1) |
| E(V vs. RHE) = E(V vs. SCE) + 0.241 + 0.0591 × pH, at 25 °C | (2) |
The catalyst sample (8.0 mg), ethanol (3 mL), and Nafion solution (0.2 mL, 5 wt%) were ultrasonically mixed to form the homogenous catalyst ink. The catalyst slurry (5 μL) was pipetted onto the polished glass carbon electrode (3 mm in diameter). A calomel electrode in saturated KCl solution (SCE) and Pt-wire electrode were used as the reference and counter electrodes, respectively. A salt bridge was used to connect the reference electrode to the cell. RDE LSVs were obtained using 0.1 M KOH and 0.5 M H2SO4 solutions saturated with O2 at 25 °C.
A test cell with an active area of 6 cm2 was assembled to evaluate the performance of the synthesized catalyst in a direct borohydride fuel cell (DBFC). The cathode and anode catalyst inks were prepared by mixing the catalyst powder, Nafion solution (5 wt%), deionized water, and ethanol in a mass ratio of 1![[thin space (1/6-em)]](https://www.rsc.org/images/entities/char_2009.gif) :
:![[thin space (1/6-em)]](https://www.rsc.org/images/entities/char_2009.gif) 7
7![[thin space (1/6-em)]](https://www.rsc.org/images/entities/char_2009.gif) :
:![[thin space (1/6-em)]](https://www.rsc.org/images/entities/char_2009.gif) 3
3![[thin space (1/6-em)]](https://www.rsc.org/images/entities/char_2009.gif) :
:![[thin space (1/6-em)]](https://www.rsc.org/images/entities/char_2009.gif) 3, respectively. The cathode was prepared by coating 3.0 mg cm−2 of the synthesized catalyst on a piece of hydrophobic carbon cloth, and then heating at 130 °C for 2 h. The anodes were prepared by coating the commercial Pt/XC-72 catalyst (20 wt% Pt, 3.0 mg cm−2) on a piece of Ni foam. Nafion 112 membrane was sequentially boiled in 3 wt% H2O2 solution, deionized water, 0.5 M H2SO4, and deionized water for 30 min. An alkaline borohydride solution (5 wt% NaBH4 in 10 wt% NaOH) was used as a fuel to run the cell. Cell performance was measured at a fuel flow rate of 15 mL min−1 and a dry O2 flow rate of 150 mL min−1 at 25 °C. The cell figuration and performance evaluation system was described in a previous study.7
3, respectively. The cathode was prepared by coating 3.0 mg cm−2 of the synthesized catalyst on a piece of hydrophobic carbon cloth, and then heating at 130 °C for 2 h. The anodes were prepared by coating the commercial Pt/XC-72 catalyst (20 wt% Pt, 3.0 mg cm−2) on a piece of Ni foam. Nafion 112 membrane was sequentially boiled in 3 wt% H2O2 solution, deionized water, 0.5 M H2SO4, and deionized water for 30 min. An alkaline borohydride solution (5 wt% NaBH4 in 10 wt% NaOH) was used as a fuel to run the cell. Cell performance was measured at a fuel flow rate of 15 mL min−1 and a dry O2 flow rate of 150 mL min−1 at 25 °C. The cell figuration and performance evaluation system was described in a previous study.7
3. Results and discussion
3.1. Effects of the template
To verify the influence of CaCO3 decomposition during carbonization on the catalytic activity towards ORR, the RDE LSVs of the group A catalysts were measured, as shown in Fig. 2. When TRT increased from 500 to 650 °C, the ORR current and the on-set potential of the obtained catalyst increased. However, further increase of TRT led to a decrease in the ORR current and on-set potential.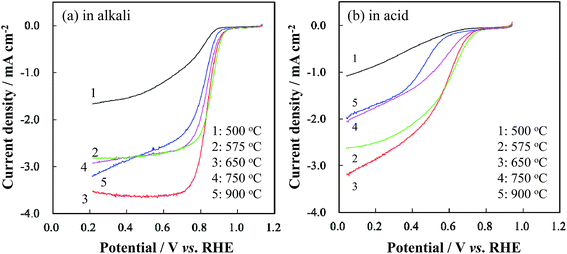 | ||
| Fig. 2 RDE LSV curves of Co/N-MPCs in group A (TRT: 500–900 °C) in (a) 0.1 M KOH and (b) 0.5 M H2SO4 solutions at a scan rate of 5 mV s−1 and a rotation rate of 900 rpm. | ||
XRD results showed that CaCO3 remained stable when the composite consisting of Co-coordinated glucose–urea resin and CaCO3 was heated at temperatures below 650 °C, whereas decomposed into CaO and CO2 when heated over 750 °C (Fig. 3). Based on the N2 adsorption–desorption isotherm measurements (Fig. S1†), Co/N-MPC(650/900) presented a smaller specific surface area (322.8 m2 g−1) and total pore volume (0.50 cm3 g−1), whereas larger average pore diameter (21.2 nm) than Co/N-MPC(900/900) (561.3, m2 g−1, 0.50 cm3 g−1, and 12.8 nm, respectively) as presented in Table S1.† These results imply that CO2 generated from CaCO3 decomposition reacted with carbon at higher pyrolysis temperatures, leading to the creation of more meso- and micro-pores (inset of Fig. S1†).43 As a result, the specific surface area of the Co/N-MPC(900/900) was larger than that of the Co/N-MPC(650/900).
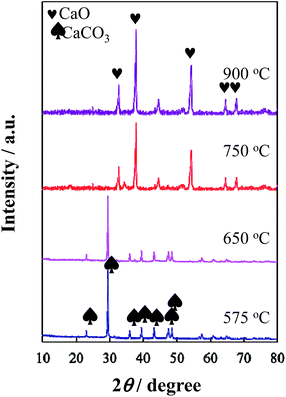 | ||
| Fig. 3 XRD patterns of the composites consisting of Co-coordinated glucose–urea resin and CaCO3 after heat treatment at 575–900 °C for 3 h. | ||
The Co/N-MPC(900/900) had higher specific surface area, but contained much less nitrogen than the Co/N-MPC(650/900), as presented in Table 1. Based on the reported binding energies of Co–Nx, pyridinic-N, pyrrolic-N, graphitic-N, and pyridinic-N oxide (398.0, 398.5, 400.0, 401.1, and 403.0 eV, respectively),26,44–47 spectral deconvolution of N 1s core level spectrum was conducted, as shown in Fig. 4. Four peaks (assigned to Co–Nx, pyridinic-N, pyrrolic-N, and graphitic-N) appeared in the spectra of Co/N-MPC(650/900) and Co/N-MPC(900/900). One more peak appeared in the spectrum of Co/N-MPC(900/900), assigned to pyridinic-N oxide. Co–Nx, pyridinic-N, and graphitic-N were the active-sites for ORR.47–52 Compared with the Co/N-MPC(650/900), the lower catalytic activity of the Co/N-MPC(900/900) (in Fig. 2) was attributed to the lower contents of Co–Nx, pyridinic-N, and graphitic-N in the Co/N-MPC(900/900) (Table 2), which suggests that higher CaCO3 removal temperature led to a more severe destruction of the active N species. These results imply that CO2 from CaCO3 decomposition led to a decrease in the number of active sites.
| C | O | N | Co | |
|---|---|---|---|---|
| Co/N-MPC(650/900) | 82.53 | 10.98 | 5.79 | 0.70 |
| Co/N-MPC(900/900) | 87.34 | 10.18 | 1.38 | 1.10 |
| Co/N-MPC(SiO2) | 81.64 | 11.85 | 5.95 | 0.55 |
| Co/N–C | 81.51 | 10.90 | 7.59 | 0.01 |
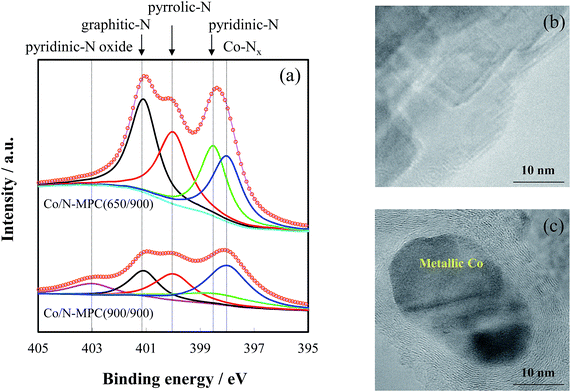 | ||
| Fig. 4 Normalized N 1s spectra (a) and TEM images of Co/N-MPC(650/900) (b) and Co/N-MPC(900/900) (c). | ||
| Co–Nx 398.0 eV | Pyridinic-N 398.5 eV | Pyrrolic-N 400.0 eV | Graphitic-N 401.1 eV | Pyridinic-N oxide 403.0 eV | Total N | |
|---|---|---|---|---|---|---|
| a Data in brackets account for each N-species ratio in the total N content of Co/N-MPC. | ||||||
| Co/N-MPC(900/900) | 0.47 (33.90) | 0.26 (18.87) | 0.28 (20.30) | 0.22 (16.20) | 0.15 (10.73) | 1.38 |
| Co/N-MPC(650/900) | 1.33 (22.99) | 1.27 (21.86) | 1.48 (25.50) | 1.72 (29.65) | 0 (0) | 5.79 |
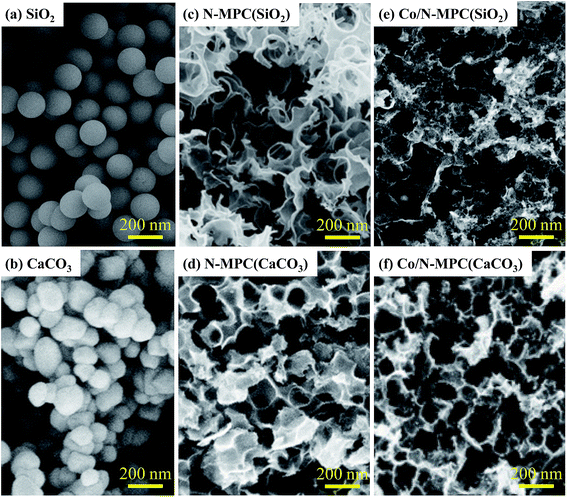
It is indicated that the carbon–nitrogen bond in the active sites is strongly polarized towards nitrogen (the electronegativities of C and N are 2.55 and 3.04, respectively). Nucleophilic CO2 tends to attack the electropositive carbon atoms bonded to N prior to those bonded through a covalent bond of C–C, breaking the C–N bond and forming CO, thereby leading to the destruction of pyridinic-N and graphitic-N and the release of nitrogen. To verify the relation between the CaCO3 template and the N loss, the Co/N-MPC(SiO2) was synthesized by employing SiO2 template. SiO2 was removed by HF acid. The morphology of Co/N-MPC(SiO2) was similar to that of Co/N-MPC(900/900), as shown in Fig. 5, but exhibited higher N content (Table 1). Moreover, the Co/N–C prepared without template also showed much higher N content than the Co/N-MPC(900/900). These results indicate that the Co/N-MPC fabricated with a stable template yielded a high content of nitrogen, suggesting that CO2 resulted in the N loss.
The decisive evidence for carbon erosion and N loss was obtained through the pyrolysis of the Co/N-MPC(650/900) with CaCO3 (the mass ratios of CaCO3 to Co/N-MPC were 10![[thin space (1/6-em)]](https://www.rsc.org/images/entities/char_2009.gif) :
:![[thin space (1/6-em)]](https://www.rsc.org/images/entities/char_2009.gif) 3 and 30
3 and 30![[thin space (1/6-em)]](https://www.rsc.org/images/entities/char_2009.gif) :
:![[thin space (1/6-em)]](https://www.rsc.org/images/entities/char_2009.gif) 3, respectively) at 900 °C. The nano-CaCO3 powders were placed at the bottom of a crucible, separated from the Co/N-MPC(650/900) lump with a piece of ceramic filter. After heating for 2 h, the weight loss and the remaining contents of carbon, nitrogen, and hydrogen in the Co/N-MPC are tabulated in Table 3. The decrease in the sample weight and N content proved that the carbon erosion and the N loss were caused by CO2.
3, respectively) at 900 °C. The nano-CaCO3 powders were placed at the bottom of a crucible, separated from the Co/N-MPC(650/900) lump with a piece of ceramic filter. After heating for 2 h, the weight loss and the remaining contents of carbon, nitrogen, and hydrogen in the Co/N-MPC are tabulated in Table 3. The decrease in the sample weight and N content proved that the carbon erosion and the N loss were caused by CO2.
| Mass ratio of CaCO3 to Co/N-MPC | Weight/g | C/wt% | N/wt% | H/wt% |
|---|---|---|---|---|
| Co/N-MPC(650/900) | 0.30 | 80.91 | 5.01 | 1.78 |
0![[thin space (1/6-em)]](https://www.rsc.org/images/entities/char_2009.gif) : :![[thin space (1/6-em)]](https://www.rsc.org/images/entities/char_2009.gif) 3 3 |
0.29 | 80.24 | 4.73 | 1.47 |
10![[thin space (1/6-em)]](https://www.rsc.org/images/entities/char_2009.gif) : :![[thin space (1/6-em)]](https://www.rsc.org/images/entities/char_2009.gif) 3 3 |
0.15 | 72.77 | 2.85 | 1.00 |
30![[thin space (1/6-em)]](https://www.rsc.org/images/entities/char_2009.gif) : :![[thin space (1/6-em)]](https://www.rsc.org/images/entities/char_2009.gif) 3 3 |
0.08 | 62.08 | 2.10 | 0.77 |
A more controllable experiment was conducted by loading CaCO3 to the Co/N-MPC(650/900). Na2CO3 solutions (with 0.021, 0.085, and 0.17 g of Na2CO3 in 10 mL of water) were dropwise added to 100 mL of a suspension containing Co/N-MPC(650/900) (1 g) and CaCl2 (0.022, 0.089, and 0.178 g, respectively) under stirring for 4 h. The CaCO3-loaded Co/N-MPCs were then pyrolyzed at 900 °C for 2 h. The CO2-treated Co/N-MPC was then obtained after CaO removal through HCl etching. The influence of the loaded CaCO3 amount on the catalytic activity was evaluated in 0.5 M H2SO4, as shown in Fig. 6. It was found that both the ORR current and its potential significantly decreased when the loaded CaCO3 amount in the Co/N-MPC(650/900) was increased (mass ratio of CaCO3 to the Co/N-MPC = 0![[thin space (1/6-em)]](https://www.rsc.org/images/entities/char_2009.gif) :
:![[thin space (1/6-em)]](https://www.rsc.org/images/entities/char_2009.gif) 1, 0.2
1, 0.2![[thin space (1/6-em)]](https://www.rsc.org/images/entities/char_2009.gif) :
:![[thin space (1/6-em)]](https://www.rsc.org/images/entities/char_2009.gif) 1, 0.8
1, 0.8![[thin space (1/6-em)]](https://www.rsc.org/images/entities/char_2009.gif) :
:![[thin space (1/6-em)]](https://www.rsc.org/images/entities/char_2009.gif) 1, and 1.6
1, and 1.6![[thin space (1/6-em)]](https://www.rsc.org/images/entities/char_2009.gif) :
:![[thin space (1/6-em)]](https://www.rsc.org/images/entities/char_2009.gif) 1). This result confirmed that the catalyst deterioration was caused by CO2 generated from the CaCO3 decomposition.
1). This result confirmed that the catalyst deterioration was caused by CO2 generated from the CaCO3 decomposition.
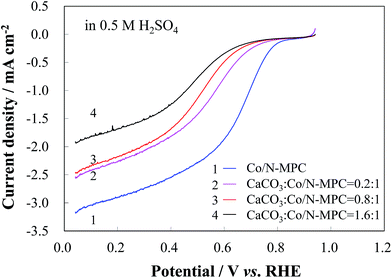 | ||
| Fig. 6 RDE LSV curves of CO2-treated Co/N-MPC(650/900) with various loading amounts of CaCO3, in 0.5 M H2SO4 solution at a scan rate of 5 mV s−1 and a rotation rate of 900 rpm. | ||
3.2. Effects of carbonization temperature
The formation of metallic Co in Co/N-MPC(900/900) (Fig. 4(c)) not only showed evidence of Co–Nx site destruction, but also suggested that Co–Nx was unstable at 900 °C. To understand the effect of carbonization temperature on the active-site destruction, the content of N-species in Co/N-MPC(650/800) and Co/N-MPC(650/900) were measured by XPS. The quantitative analysis results revealed that the Co/N-MPC(650/900) contained less nitrogen than Co/N-MPC(650/800), as tabulated in Table 4. All N species contents were decreased, and Co–Nx species showed a larger loss than other species, indicating that destruction of these active sites occurred at 900 °C.| Co–Nx 398.0 eV | Pyridinic-N 398.5 eV | Pyrrolic-N 400.0 eV | Graphitic-N 401.1 eV | Total N | |
|---|---|---|---|---|---|
| a Data in brackets account for each N-species ratio in the total N content of Co/N-MPC. | |||||
| Co/N-MPC(650/800) | 1.90 (29.15) | 1.36 (20.78) | 1.51 (23.06) | 1.76 (27.01) | 6.53 |
| Co/N-MPC(650/900) | 1.33 (22.99) | 1.27 (21.86) | 1.48 (25.50) | 1.72 (29.65) | 5.79 |
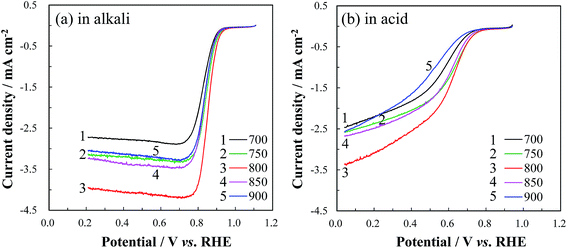
The RDE LSV curves of Co/N-MPCs, obtained after the carbonization of the template-removed precursor (TRT: 650 °C) at 700–900 °C, were obtained in alkaline and acidic electrolytes, as shown in Fig. 7. The ORR current and onset potential increased when the carbonization temperature was increased from 700 to 800 °C, which is ascribed to the increase in the electrical conductivity of the MPC because of its graphitization degree improvement.53 However, further increase in the carbonization temperature over 800 °C showed a negative effect on the ORR kinetics, indicating that the active site destruction occurred at temperatures over 800 °C.
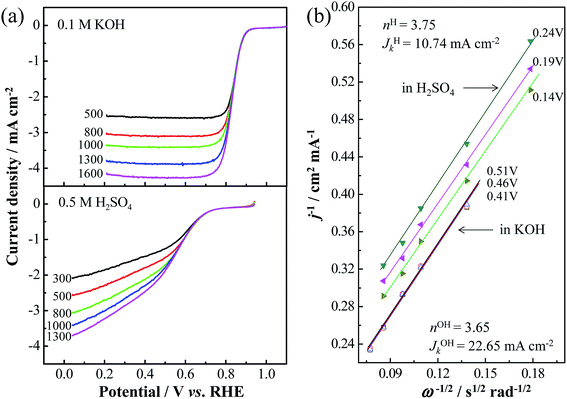
Like other nitrogen-doped carbon catalysts,54 the Co/N-MPC(650/800) showed higher ORR current and on-set potential in alkali than those in acid, as shown in Fig. 8. Regarding the polarity of the N species, N acts as a nucleophilic center because of its lone pair of electrons, whereas the connected C or Co becomes an electrophilic center. Both nucleophiles, such as dioxygen and water (ORR reactants in alkali), can absorb at the same electrophilic center such as the Co position prior to the N position in the case of a Co–Nx site.55 However, as ORR reactants in acid, dioxygen (nucleophile), and proton (electrophile) have to be separately absorbed at the Co and N positions. The larger ORR polarization of the Co/N-MPC(650/800) in acid than that in alkali can be attributed to the space steric effect of the Co–N bond. Regarding the K–L equation (eqn (1)) and RDE LSV results at various rotation rates, the calculated n values obtained from the Co/N-MPC(650/800) are 3.65 in 0.1 M KOH and 3.75 in 0.5 M H2SO4 electrolytes. The kinetic current densities of the Co/N-MPC(650/800) reach 22.65 and 10.74 mA cm−2, respectively, revealing that the Co/N-MPC(650/800) is a remarkable non-Pt catalyst for fuel cells.
The performance of the Co/N-MPC(650/800) is verified in a DBFC, as shown in Fig. 9(a). A peak power density of 215 mW cm−2 has been achieved under ambient conditions, which is higher than the performance of the cells using commercial 20 wt% Pt/C catalyst (190 mW cm−2) and previously reported one-step prepared Co/N-MPC (170 mW cm−2)26 and carbon-supported Co3O4 (186 mW cm−2).55 The developed DBFC is comparable to the cell with 28.6 wt% Pt/C catalyst (220 mW cm−2), showing good short-term performance stability comparable to that of the cell with 28.6 wt% Pt/C catalyst (Fig. 9(b)).
4. Conclusions
The N-containing MPC-supported cobalt (Co/N-MPC) catalyst with high performance was synthesized via multistep pyrolysis of composite containing Co-coordinated glucose–urea resin and nano-CaCO3 template. CO2 from CaCO3 decomposition attacked the carbon atoms bonded to N, leading to catalyst deterioration caused by the active site destruction. Removal of CaCO3 template before its decomposition effectively suppressed the active site destruction. Nitrogen containing active sites were unstable at temperatures over 800 °C.Through the preparation of the template-removed precursor via CaCO3 removal at 650 °C, the Co/N-MPC synthesized via the carbonization of the precursor at 800 °C (Co/N-MPC(650/800)) demonstrated high catalytic activity towards ORR in both alkaline and acidic electrolytes. The Co/N-MPC(650/800) reached electron transfer numbers of 3.65 and 3.75, kinetic current densities of 22.65 and 10.74 mA cm−2 in 0.1 M KOH and 0.5 M H2SO4 solutions, respectively. The direct borohydride fuel cell with Co/N-MPC(650/800) showed a power density as high as 215 mW cm−2, which was higher than the value obtained from the cell with 20 wt% Pt/C (190 mW cm−2), and comparable to that from the cell using 28.6 wt% Pt/C (220 mW cm−2) as the cathode catalyst under ambient conditions.
The findings of this study bring a new insight to prevent the active site destruction. In fact, any oxidants generated from carbon sources and transition metal sources during catalyst synthesis may destroy active sites. Avoiding oxidant generation during catalyst synthesis is one of the most important steps in preparing high performance non-Pt catalysts for ORR.
Acknowledgements
This work is financially supported by the National Natural Science Foundation of China, Grant No. 21476200, 21276229 and 51271164; the Zhejiang Provincial Natural Science Foundation of China, Grant No. Z4110126.References
- Y. Nie, L. Li and Z. D. Wei, Chem. Soc. Rev., 2015, 44, 2168–2201 RSC.
- Z. P. Li and B. H. Liu, J. Appl. Electrochem., 2010, 40, 475–483 CrossRef CAS.
- J. Y. Cheon, T. Kim, Y. M. Choi, H. Y. Jeong, M. G. Kim, Y. J. Sa, J. Kim, Z. Lee, T. H. Yang, K. Kwon, O. Terasaki, G. G. Park, R. R. Adzic and S. H. Joo, Sci. Rep., 2013, 3, 2715 Search PubMed.
- X. Zhang, D. Yu, Y. Zhang, W. Guo, X. Ma and X. He, RSC Adv., 2016, 6, 104183–104192 RSC.
- G. Lalande, R. Cote, G. Ramizhmani, D. Guay, J. Dodelet, L. Dignard-Bailey, L. Weng and P. Bertrand, Electrochim. Acta, 1995, 40, 2635–2646 CrossRef CAS.
- M. Y. Ghotbi, B. Feli, M. Azadfalah and M. Javaheri, RSC Adv., 2015, 5, 92577–92584 RSC.
- H. Y. Qin, Z. X. Liu, L. Q. Ye, J. K. Zhu and Z. P. Li, J. Power Sources, 2009, 192, 385–390 CrossRef CAS.
- R. Cote, G. Lalande, G. Faubert, D. Guay, J. P. Dodelet and G. Denes, J. Electrochem. Soc., 1998, 145, 2411–2418 CrossRef CAS.
- H. Wang, R. Cote, G. Faubert, D. Guay and J. P. Dodelet, J. Phys. Chem. B, 1999, 103, 2042–2049 CrossRef CAS.
- Z. Xu, H. Li, B. Yin, Y. Shu, X. Zhao, D. Zhang, L. Zhang, K. Li, X. Hou and J. Lu, RSC Adv., 2013, 3, 9344–9351 RSC.
- H. Y Qin, Z. X Liu, S. J. Lao, J. K. Zhu and Z. P. Li, J. Power Sources, 2010, 195, 3124–3129 CrossRef.
- C. Zhao, W. Wang, Z. Yu, H. Zhang, A. Wang and Y. Yang, J. Mater. Chem., 2010, 20, 976–980 RSC.
- G. Xu, Y. Xu, J. Fang, X. Peng, F. Fu, L. Huang, J. Li and S. Sun, ACS Appl. Mater. Interfaces, 2013, 5, 10782–10793 CAS.
- G. R. Li, Q. Q. Wang, B. H. Liu and Z. P. Li, Fuel Cells, 2015, 15, 270–277 CrossRef CAS.
- E. S. Toberer, T. D. Schladt and R. Seshadri, J. Am. Chem. Soc., 2006, 128, 1462–1463 CrossRef CAS PubMed.
- W. R. Li, D. H. Chen, Z. Li, Y. F. Shi, Y. Wan, J. J. Huang, J. J. Yang, D. Y. Zhao and Z. Y. Jiang, Electrochem. Commun., 2007, 9, 569–573 CrossRef CAS.
- P. Dibandjo, F. Chassagneux, L. Bois, C. Sigala and P. Miele, J. Mater. Chem., 2005, 15, 1917–1923 RSC.
- B. Liu, H. Shioyama, T. Akita and Q. Xu, J. Am. Chem. Soc., 2008, 130, 5390–9391 CrossRef CAS PubMed.
- Z. L. Zhu, A. Li, L. Yan, F. Q. Liu and Q. X. Zhang, J. Colloid Interface Sci., 2007, 316, 628–634 CrossRef CAS PubMed.
- A. Vinu, K. Z. Hossian, P. Srinivasu, M. Miyahara, S. Anandan, N. Gokulakrishnan, T. Mori, K. Ariga and V. V. Balasubramanian, J. Mater. Chem., 2007, 17, 1819–1825 RSC.
- S. Tanaka, Y. Katayama, M. P. Tate, H. W. Hillhouse and Y. Miyake, J. Mater. Chem., 2007, 17, 3639–3645 RSC.
- Y. Liu, L. Zhan, R. Zhang, W. M. Qiao, X. Y. Liang and L. C. Ling, New Res. Carbon Mater., 2007, 22, 259–263 CrossRef.
- K. P. Gierszal, M. Jaroniec, C. D. Liang and S. Dai, Carbon, 2007, 45, 2171–2177 CrossRef CAS.
- A. H. Janssen, I. Schmidt, C. J. H. Jacobsen, A. J. Koster and K. P. Jong, Microporous Mesoporous Mater., 2003, 65, 59–76 CrossRef CAS.
- C. Zhao, W. Wang, Z. Yu, H. Zhang, A. Wang and Y. Yang, J. Mater. Chem., 2010, 20, 976–980 RSC.
- F. He, J. Yang, R. Li, B. H. Liu and Z. P. Li, J. Power Sources, 2015, 274, 48–55 CrossRef CAS.
- W. L. Cai, G. R. Li, F. He, L. M. Jin, B. H. Liu and Z. P. Li, J. Power Sources, 2015, 283, 524–529 CrossRef CAS.
- A. H. Lu, J. H. Smatt, M. Linden and F. Schuth, New Res. Carbon Mater., 2003, 18, 265–269 CAS.
- J. Park, Y. Nabae, T. Hayakawa and M. Kakimoto, ACS Catal., 2014, 4, 3749–3754 CrossRef CAS.
- A. Vinu, K. Ariga, T. Mori, T. Nakanishi, S. Hishita, D. Golberg and Y. Bando, Adv. Mater., 2005, 17, 1648–1652 CrossRef CAS.
- S. S. Park, S. Chu, C. Xue, D. Zhao and C. Ha, J. Mater. Chem., 2011, 21, 10801–10807 RSC.
- P. F. Fulvio, M. Jaroniec, C. Liang and S. Dai, J. Phys. Chem. C, 2008, 112, 13126–13133 CAS.
- T. Fellinger, F. Hasche, P. Strasser and M. Antonietti, J. Am. Chem. Soc., 2012, 134, 4072–4075 CrossRef CAS PubMed.
- A. P. Wang, F. Y. Kang, Z. H. Huang, Z. C. Guo and X. Y. Chuan, Microporous Mesoporous Mater., 2008, 108, 318–324 CrossRef CAS.
- Y. Nabae, M. Malon, S. M. Lyth, S. Moriya, K. Matsubayashi, N. Islam, S. Kuroki, M. Kakimoto, J. Ozaki and S. Miyata, ECS Trans., 2009, 25, 463–467 CAS.
- Y. Nabae, M. Sonada, C. Yamauchi, Y. Hosaka, A. Isoda and T. Aoki, Catal. Sci. Technol., 2014, 4, 1400–1406 CAS.
- Z. P. Li, B. H. Liu, K. Arai and S. Suda, J. Alloys Compd., 2005, 404–406, 648–652 CrossRef CAS.
- P. Olu, N. Job and M. Chatenet, J. Power Sources, 2016, 327, 235–257 CrossRef CAS.
- Z. P. Li, B. H. Liu, K. Arai and S. Suda, J. Electrochem. Soc., 2003, 150, A868–A872 CrossRef CAS.
- D. Zhang, D. Chi, T. Okajima and T. Ohsaka, Electrochim. Acta, 2007, 52, 5400–5406 CrossRef CAS.
- M. H. Robson, A. Serov, K. Artyushkova and P. Atanassov, Electrochim. Acta, 2013, 90, 656–665 CrossRef CAS.
- K. Xu, S. J. Lao, H. Y. Qin, B. H. Liu and Z. P. Li, J. Power Sources, 2010, 195, 5606–5609 CrossRef CAS.
- G. Rasines, C. Macías, M. Haro, J. Jagiello and C. O. Ania, Microporous Mesoporous Mater., 2015, 209, 18–22 CrossRef CAS.
- G. Liu, X. Li, P. Ganesan and B. Popov, Appl. Catal., B, 2009, 93, 156–165 CrossRef CAS.
- K. Lee, L. Zhang, H. Lui, R. Huim, Z. Shi and J. Zhang, Electrochim. Acta, 2009, 54, 4704–4711 CrossRef CAS.
- H. Wang, T. Maiyalagan and X. Wang, ACS Catal., 2012, 2, 781–794 CrossRef CAS.
- Z. X. Liu, B. H. Liu and Z. P. Li, Int. J. Hydrogen Energy, 2014, 39, 5689–5695 CrossRef CAS.
- C. W. B. Bezerra, L. Zhang, K. Lee, H. Liu, A. L. B. Marques, E. P. Marques, H. Wang and J. Zhang, Electrochim. Acta, 2008, 53, 4937–4951 CrossRef CAS.
- Z. P. Li, Z. X. Liu, K. N. Zhu, Z. Li and B. H. Liu, J. Power Sources, 2012, 219, 163–171 CrossRef CAS.
- M. Yuasa, A. Yamaguchi, H. Itsuki, K. Tanaka, M. Yamamoto and K. Oyaizu, Chem. Mater., 2005, 17, 4278–4281 CrossRef CAS.
- V. Nallathambi, J. W. Lee, S. P. Kumaraguru, G. Wu and B. N. Popov, J. Power Sources, 2008, 183, 34–42 CrossRef CAS.
- H. Y. Qin, K. N. Zhu, L. Q. Ye and Z. P. Li, J. Power Sources, 2012, 208, 203–209 CrossRef CAS.
- G. Xu, Y. Xu, J. Fang, X. Peng, F. Fu, L. Huang, J. Li and S. Sun, ACS Appl. Mater. Interfaces, 2013, 5, 10782–10793 CAS.
- J. Yin, Y. Qiu, J. Yu, X. Zhou and W. Wu, RSC Adv., 2013, 3, 15655–15663 RSC.
- B. H. Liu, L. T. Dou, F. He, J. Yang and Z. P. Li, RSC Adv., 2016, 6, 19025–19033 RSC.
Footnote |
| † Electronic supplementary information (ESI) available. See DOI: 10.1039/c6ra26454a |
| This journal is © The Royal Society of Chemistry 2017 |

