 Open Access Article
Creative Commons Attribution 3.0 Unported Licence
A facile synthesis of Cu–Ni bimetallic nanoparticle supported organo functionalized graphene oxide as a catalyst for selective hydrogenation of p-nitrophenol and cinnamaldehyde†
Surjyakanta
Rana
and
Sreekantha B.
Jonnalagadda
 *
*
School of Chemistry & Physics, College of Agriculture, Engineering & Science, University of KwaZulu-Natal, Durban, South Africa. E-mail: jonnalagaddas@ukzn.ac.za; Fax: +27 31 260 3091; Tel: +27 31 260 7325 ext. 3090
First published on 12th January 2017
Abstract
We report a facile and environmentally friendly protocol for the synthesis of novel mono-dispersed Cu and Ni bimetallic alloy particles supported on fibrous anime functionalized graphene oxide (GO). In this protocol, we used the organic amine group to increase the binding capacity of supported metal particles. First GO was covalently functionalized by organic amine [N-(2 amino ethyl)-3-amino propyl trimethoxy silane i.e., (AAPTMS)] to form AAPTMS–GO and then metal ions were loaded on the surface of the AAPTMS–GO material. The metal particles supported on AAPTMS functionalized graphene oxide were named as Ni–AAPTMS–GO, Cu–AAPTMS–GO and Cu–Ni–AAPTMS–GO to reflect the metals loaded, and all were fully characterized by various techniques including XRD, SEM, FTIR, Raman spectra, TEM and HRTEM analysis. The 5% loaded with a 1![[thin space (1/6-em)]](https://www.rsc.org/images/entities/char_2009.gif) :
:![[thin space (1/6-em)]](https://www.rsc.org/images/entities/char_2009.gif) 1 ratio of Cu
1 ratio of Cu![[thin space (1/6-em)]](https://www.rsc.org/images/entities/char_2009.gif) :
:![[thin space (1/6-em)]](https://www.rsc.org/images/entities/char_2009.gif) Ni of Cu(0)–Ni(0)–AAPTMS–GO showed superb efficiency in conversion of p-nitrophenol to p-aminophenol with 100% conversion and selectivity. Hydrogenation of cinnamaldehyde with the same catalyst gave 85% conversion and 59.8% selectivity towards cinnamal alcohol (COL) at 80 °C. The catalyst also showed good stability in recycling tests.
Ni of Cu(0)–Ni(0)–AAPTMS–GO showed superb efficiency in conversion of p-nitrophenol to p-aminophenol with 100% conversion and selectivity. Hydrogenation of cinnamaldehyde with the same catalyst gave 85% conversion and 59.8% selectivity towards cinnamal alcohol (COL) at 80 °C. The catalyst also showed good stability in recycling tests.
1 Introduction
Single metal nano catalysts, such as Pd, Pt and Ru are known to be effective catalysts for reduction of aromatic compounds.1 However, these single metal nanoparticles are less selective and get quickly deactivated.2,3 Due to the unique properties at the nanoscale, the bimetallic nanomaterials4,5 have recorded versatile applications as catalysts6,7 and many other fields of chemical industry.8 The excellent synergy between their constituent elements, in addition to size effects are the main reasons for the enhanced catalytic activity by bimetallic nanoparticles. Pd–Au nano bimetallic materials, for example exhibit better catalytic activity than their monometallic ones, towards the oxidation of CO, alcohols and C–H bonds, and in the synthesis of H2O2 from H2 and O2.9–14Primary drawback associated with unsupported catalysis is that metallic catalysts cannot be reusable for several catalytic runs. Whereas with supported heterogeneous catalysts, allow easy separation and reusability, which is an attractive advantage. Although some agglomeration of metal nanoparticles during catalytic runs is inevitable, a right choice of support will minimize such processes. The supports containing organic groups can greatly influence the activity and selectivity of the catalyst material. Due to the nontoxicity and high sorption capacities,15–18 carbon based nanomaterials have been widely used as inorganic support for catalyst materials. In material science, graphene oxides enjoy prime position among the other carbon based materials, due to their honey comb like structure and high surface area.19,20
Transition metal salts like Cu and Ni are less-expensive and readily available, relative to the most of noble metal salts, which are normally used as catalysts. Therefore, in the current study, we have constructed low-cost Cu–Ni bimetallic nano particles grafted on amine functionalized graphene oxide surface. The amine functionalized graphene oxide as support material possess high surface area, which enhances the catalytic activity as well as dispersion capacity. The functionalized amine with external binding capacity will provide additional active sites and also increase its reusability.
Nitro substituted hydrocarbons are generally toxic by nature and hard to be degraded in the environment.21 In addition, the conversion of aromatic nitro-compounds to aromatic amino compounds obeys with the demands of green chemistry. Further, hydrogenation of unsaturated aldehyde to alcohol with heterogeneous catalytic processes is always a challenge, since the hydrogenation of the C![[double bond, length as m-dash]](https://www.rsc.org/images/entities/char_e001.gif) O bond, while keeping the C
O bond, while keeping the C![[double bond, length as m-dash]](https://www.rsc.org/images/entities/char_e001.gif) C intact is not thermodynamically favourable. Thus, the hydrogenation is of supreme significance in fine chemical synthesis and many efforts have been made to design appropriate solid catalysts. Prakash et al. have reported that Ni–Au/TiO2 and Ni–Ag/TiO2 gave better activity towards hydrogenation of unsaturated aldehyde compared to their single mono metallic like Ni/TiO2.22 Lin et al., have also reported that Ir–Ni/TiO2 catalyst showed higher activity and selectivity in hydrogenation of unsaturated aldehydes compared to heterogeneous monometallic catalysts.23
C intact is not thermodynamically favourable. Thus, the hydrogenation is of supreme significance in fine chemical synthesis and many efforts have been made to design appropriate solid catalysts. Prakash et al. have reported that Ni–Au/TiO2 and Ni–Ag/TiO2 gave better activity towards hydrogenation of unsaturated aldehyde compared to their single mono metallic like Ni/TiO2.22 Lin et al., have also reported that Ir–Ni/TiO2 catalyst showed higher activity and selectivity in hydrogenation of unsaturated aldehydes compared to heterogeneous monometallic catalysts.23
In this study we developed a novel catalyst material, Cu–Ni bimetallic functionalised graphene oxide nanocomposite and investigated its activity on two organic transformations. The efficacy of the different loading of Cu and Ni on the support for selective reduction of p-nitrophenol as well as hydrogenation of cinnamaldehyde were examined and role of temperature and solvents on the reactions were assessed.
2 Experimental
2.1 Preparation of GO
0.5 g of graphite powder, 0.5 g of NaNO3 and con. H2SO4 (23 ml) in a beaker and constant stirring in ice bath for 2 h. 3 g of KMnO4 was added slowly and stirring continued for 70 min. Then, distilled water (50 ml) was added to the mixture. The reaction mixture was stirred at 35 °C for 1 h and 98 °C for another 20 min. Then, (30%) H2O2 was added to the mixture and stirred for 1 h till the colour of the mixture turned dark brown to yellow. Water (50 ml) was added to the mixture and stirred for 1 h. Then, the final mixture was sonicated for 30 min. The sonicated product was centrifuged with 10% HCl and filtered with DD water several times. Then, the final solid material was dried at 40 °C in a vacuum oven for overnight to acquire graphene oxide (GO).2.2 AAPTMS@GO
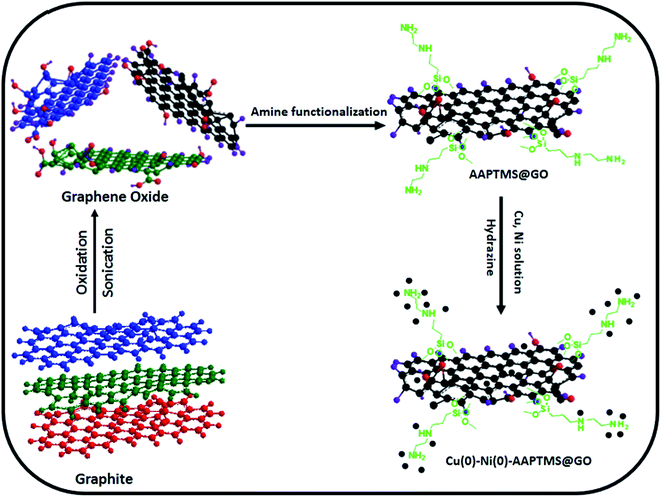
Graphene oxide (1 g) was dissolved in 50 ml ethanol solution in a conical flask and sonicated for 1 h. 1.68 mmol of AAPTMS [(3-(2-aminoethylamino) propyl] trimethoxysilane) was drop wise added to the mixture and sonicated for 1 h. Then, the mixture was centrifuged and the product was dried at 40 °C in a vacuum oven for overnight to get AAPTMS@GO.2.3 Cu–Ni–AAPTMS@GO
Bimetallic Cu–Ni composites were prepared by incipient wetness impregnation method. The copper nitrate and nickel nitrate were mixed to get the subsequent metallic (Cu![[thin space (1/6-em)]](https://www.rsc.org/images/entities/char_2009.gif) :
:![[thin space (1/6-em)]](https://www.rsc.org/images/entities/char_2009.gif) Ni) molar ratios such as 1
Ni) molar ratios such as 1![[thin space (1/6-em)]](https://www.rsc.org/images/entities/char_2009.gif) :
:![[thin space (1/6-em)]](https://www.rsc.org/images/entities/char_2009.gif) 0, 0
0, 0![[thin space (1/6-em)]](https://www.rsc.org/images/entities/char_2009.gif) :
:![[thin space (1/6-em)]](https://www.rsc.org/images/entities/char_2009.gif) 1, 1
1, 1![[thin space (1/6-em)]](https://www.rsc.org/images/entities/char_2009.gif) :
:![[thin space (1/6-em)]](https://www.rsc.org/images/entities/char_2009.gif) 1, 1
1, 1![[thin space (1/6-em)]](https://www.rsc.org/images/entities/char_2009.gif) :
:![[thin space (1/6-em)]](https://www.rsc.org/images/entities/char_2009.gif) 2, and 2
2, and 2![[thin space (1/6-em)]](https://www.rsc.org/images/entities/char_2009.gif) :
:![[thin space (1/6-em)]](https://www.rsc.org/images/entities/char_2009.gif) 1. The metallic solutions were added to 4.75 g of amine functional GO solution. The liquid phase was removed by a 4 h treatment at 70 °C in a rotary evaporator and then dried in vacuum overnight at 100 °C.
1. The metallic solutions were added to 4.75 g of amine functional GO solution. The liquid phase was removed by a 4 h treatment at 70 °C in a rotary evaporator and then dried in vacuum overnight at 100 °C.
Similar method was used for preparation of Cu–Ni bimetallic nanoparticles by using hydrazine. To the Cu and Ni containing solution of functionalized GO, 0.2 M hydrazine solution was added under stirring. Then the suspension was vigorously stirred at RT for 6 h. The suspension was washed with acetone and preserved toluene. Then, the final solid product was vacuum dried at 100 °C for overnight (Scheme 1).
2.4 Equipment and methods
The X-ray diffraction study was performed on a Bruker D8 Advance instrument with CuKα as a radiation source. The transmitted electron microscopy images were observed on a Jeol JEM-1010 electron microscope with iTEM software. Jeol JEM 2100 Electron Microscope was used for capturing high resolution of TEM images. The JEOL JSM-6100 microscope was used for both scanning electron microscopy and EDX measurements. PerkinElmer spectrum 100 series with universal ATR accessory used for Fourier transmission infrared spectrometer (FTIR). The weight percentages of Cu and Ni in the bimetallic catalyst were determined by using inductively coupled plasma-optical emission spectroscopy (ICP-OES) (Perkin Elmer Optima 5300 DV). UV-visible spectra were recorded with high resolution spectrometer (HR2000+). Raman spectra were observed on a Perkin Elmer 1200 Fourier Transform Infrared and on a DeltaNu advantage 532™ Raman Spectrometer. The electronic structure aspects of the samples were investigated using KRATOS apparatus with Mg, Al, and Cu Kα as X-ray sources by XPS. The illustrative products were analyzed by 1H NMR (Bruker, 400 MHz, [D6] DMSO) 13C NMR (Bruker, 400 MHz, [D6] DMSO) and FTIR spectroscopies (PerkinElmer).2.5 Catalytic reaction of PNP to PAP
NaBH4 (60 mg) and 5.0 mM of p-nitrophenol (30 ml) were taken in a round bottom flask and stirred randomly to homogenize the solution. 3.0 mg of catalyst was added after getting the yellow colour. The change of p-nitrophenolate to p-aminophenol was observed by gradual discoloration. Aliquots of the mixture were removed at 4 min intervals and the absorption spectrum the reaction mixture was recorded using a UV-Vis spectrometer. While absorbance at 400 nm reflecting concentration of nitrophenolate species decreased, the value of absorbance at 300 nm steadily increased indicating the formation of p-aminophenol. After the completion of reaction, the solid catalyst was retrieved with centrifugation and washed with DD water after each catalytic cycle. The reaction products were also characterized by comparing the 1H NMR, 13C NMR and FTIR data with authentic samples.2.6 General procedure for hydrogenation of cinnamaldehyde
150 mg of catalyst, 1.2 g of cinnamaldehyde and 16 ml of methanol were taking in a round three necked volumetric flask fitted with water circulating condenser, after purging first with nitrogen. Then the reaction was stirred with continuous flow of hydrogen. The reactions were carried out at 80–120 °C for 1 h. The resulting mixture was analysed by GC. The catalyst was recovered by the simple centrifugation and washed with D.D. water.3 Results and discussion
3.1 Surface characterization
The X-ray diffraction patterns of AAPTMS@GO (a), Ni–AAPTMS@GO (b), Cu–AAPTMS@GO (c), (1![[thin space (1/6-em)]](https://www.rsc.org/images/entities/char_2009.gif) :
:![[thin space (1/6-em)]](https://www.rsc.org/images/entities/char_2009.gif) 1) Cu–Ni–AAPTMS@GO (d), (1
1) Cu–Ni–AAPTMS@GO (d), (1![[thin space (1/6-em)]](https://www.rsc.org/images/entities/char_2009.gif) :
:![[thin space (1/6-em)]](https://www.rsc.org/images/entities/char_2009.gif) 1) Cu(0)–Ni(0)–AAPTMS@GO (e), (1
1) Cu(0)–Ni(0)–AAPTMS@GO (e), (1![[thin space (1/6-em)]](https://www.rsc.org/images/entities/char_2009.gif) :
:![[thin space (1/6-em)]](https://www.rsc.org/images/entities/char_2009.gif) 2) Cu(0)–Ni(0)–AAPTMS@GO (f), and (2
2) Cu(0)–Ni(0)–AAPTMS@GO (f), and (2![[thin space (1/6-em)]](https://www.rsc.org/images/entities/char_2009.gif) :
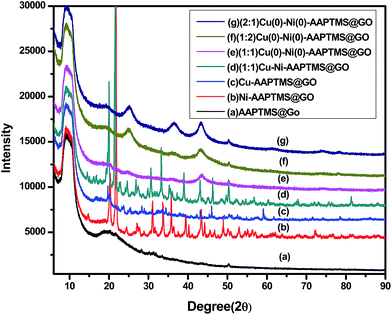
:![[thin space (1/6-em)]](https://www.rsc.org/images/entities/char_2009.gif) 1) Cu(0)–Ni(0)–AAPTMS@GO (g) are shown in Fig. 1. According to the literature,24 graphite shows a diffraction peak at 2θ = 26.18° (d = 0.34 nm) resembles to the normal basal spacing (002) of the graphite plane, but the peak vanishes when it is converted to graphene oxide (GO). In GO, the characteristic diffraction peak of (002) plane is observed approximately at 10.651° and (100) plane corresponding to 2θ at 42.91° due to the hexagonal structure of carbon.25–28 The interlayer spacing of GO increases from 0.34 nm to 0.7964 nm, during the oxidation process of graphite to GO, which may be due to the formation of oxygen-containing functional groups on the graphene oxide surfaces. In the X-ray diffraction pattern of amine functionalized graphene oxide in Fig. 1(a), the (002) plane has shifted towards a lower angle, i.e., 2θ ≈ 9.56. This is attributed to the stitching of individual GO layers by the amine functional groups.29 The XRD illustrations, after modification of the functionalized GO surface with 5 wt% of (1
1) Cu(0)–Ni(0)–AAPTMS@GO (g) are shown in Fig. 1. According to the literature,24 graphite shows a diffraction peak at 2θ = 26.18° (d = 0.34 nm) resembles to the normal basal spacing (002) of the graphite plane, but the peak vanishes when it is converted to graphene oxide (GO). In GO, the characteristic diffraction peak of (002) plane is observed approximately at 10.651° and (100) plane corresponding to 2θ at 42.91° due to the hexagonal structure of carbon.25–28 The interlayer spacing of GO increases from 0.34 nm to 0.7964 nm, during the oxidation process of graphite to GO, which may be due to the formation of oxygen-containing functional groups on the graphene oxide surfaces. In the X-ray diffraction pattern of amine functionalized graphene oxide in Fig. 1(a), the (002) plane has shifted towards a lower angle, i.e., 2θ ≈ 9.56. This is attributed to the stitching of individual GO layers by the amine functional groups.29 The XRD illustrations, after modification of the functionalized GO surface with 5 wt% of (1![[thin space (1/6-em)]](https://www.rsc.org/images/entities/char_2009.gif) :
:![[thin space (1/6-em)]](https://www.rsc.org/images/entities/char_2009.gif) 1) ratio of bimetal (Cu and Ni) [Fig. 1(b)–(d)], display various forms of the metals, i.e., metal oxide, metal hydroxide etc. When, hydrazine was added, it reduced all those forms to metallic nano particles in (1
1) ratio of bimetal (Cu and Ni) [Fig. 1(b)–(d)], display various forms of the metals, i.e., metal oxide, metal hydroxide etc. When, hydrazine was added, it reduced all those forms to metallic nano particles in (1![[thin space (1/6-em)]](https://www.rsc.org/images/entities/char_2009.gif) :
:![[thin space (1/6-em)]](https://www.rsc.org/images/entities/char_2009.gif) 1) Cu(0)–Ni(0)–AAPTMS@GO (Fig. 1(e)). In Fig. 1(e), the existence of sharp and strong diffraction peaks at 2θ, 43.51°, 50.81° and 74.81° respectively correspond to (111), (200) and (220) planes, indicating the formation of a pure cubic bimetallic well dispersed Cu–Ni alloy nanoparticles.30 This was also confirmed from HRTEM. With the (1
1) Cu(0)–Ni(0)–AAPTMS@GO (Fig. 1(e)). In Fig. 1(e), the existence of sharp and strong diffraction peaks at 2θ, 43.51°, 50.81° and 74.81° respectively correspond to (111), (200) and (220) planes, indicating the formation of a pure cubic bimetallic well dispersed Cu–Ni alloy nanoparticles.30 This was also confirmed from HRTEM. With the (1![[thin space (1/6-em)]](https://www.rsc.org/images/entities/char_2009.gif) :
:![[thin space (1/6-em)]](https://www.rsc.org/images/entities/char_2009.gif) 2) and (2
2) and (2![[thin space (1/6-em)]](https://www.rsc.org/images/entities/char_2009.gif) :
:![[thin space (1/6-em)]](https://www.rsc.org/images/entities/char_2009.gif) 1) ratio of Cu(0)–Ni(0)–AAPTMS@GO materials [Fig. 1(f) and (g)], in addition to pure metal alloy, some metal oxides were also found. The (1
1) ratio of Cu(0)–Ni(0)–AAPTMS@GO materials [Fig. 1(f) and (g)], in addition to pure metal alloy, some metal oxides were also found. The (1![[thin space (1/6-em)]](https://www.rsc.org/images/entities/char_2009.gif) :
:![[thin space (1/6-em)]](https://www.rsc.org/images/entities/char_2009.gif) 1) Cu(0)–Ni(0)–AAPTMS@GO in Fig. 1(e), confirms the formation of pure metallic nano alloy with uniform distribution over the organo-functionalized graphene oxide sheets.
1) Cu(0)–Ni(0)–AAPTMS@GO in Fig. 1(e), confirms the formation of pure metallic nano alloy with uniform distribution over the organo-functionalized graphene oxide sheets.
The FT-IR spectra (4000–400) of (a) AAPTMS@GO, (b) Ni–AAPTMS@GO, (c) Cu–AAPTMS@GO, (d) (1![[thin space (1/6-em)]](https://www.rsc.org/images/entities/char_2009.gif) :
:![[thin space (1/6-em)]](https://www.rsc.org/images/entities/char_2009.gif) 1) Cu–Ni–AAPTMS@GO, (e) (1
1) Cu–Ni–AAPTMS@GO, (e) (1![[thin space (1/6-em)]](https://www.rsc.org/images/entities/char_2009.gif) :
:![[thin space (1/6-em)]](https://www.rsc.org/images/entities/char_2009.gif) 1) Cu(0)–Ni(0)–AAPTMS@GO, (f) (1
1) Cu(0)–Ni(0)–AAPTMS@GO, (f) (1![[thin space (1/6-em)]](https://www.rsc.org/images/entities/char_2009.gif) :
:![[thin space (1/6-em)]](https://www.rsc.org/images/entities/char_2009.gif) 2) Cu(0)–Ni(0)–AAPTMS@GO, and (g) (2
2) Cu(0)–Ni(0)–AAPTMS@GO, and (g) (2![[thin space (1/6-em)]](https://www.rsc.org/images/entities/char_2009.gif) :
:![[thin space (1/6-em)]](https://www.rsc.org/images/entities/char_2009.gif) 1) Cu(0)–Ni(0)–AAPTMS@GO are shown in ESI Fig. S1.† All the samples showed peaks at 3400 cm−1 and 1740 cm−1 due to O–H stretching, C
1) Cu(0)–Ni(0)–AAPTMS@GO are shown in ESI Fig. S1.† All the samples showed peaks at 3400 cm−1 and 1740 cm−1 due to O–H stretching, C![[double bond, length as m-dash]](https://www.rsc.org/images/entities/char_e001.gif) O stretching of –COOH. The peaks at 1385 cm−1 and 1100 cm−1 also correspond to O–H vibration of C–OH groups and epoxy group vibration.31 The covalent functionalization of organic amine proceeds through two steps. In the first step, trialkoxy groups of silane generate –Si–OH groups by hydrolysis. Then the second step, the reaction between –Si–OH group of organo silane and –C–OH group of graphene oxide, covalently linked to the graphene surface through –Si–O–C– bond. In the FTIR spectra, the peak at 686 cm−1 is due to stretching vibrations of Si–O–C.32 The peaks at 3371 cm−1 and 1638 cm−1 corresponding to N–H stretching and NH2 bending mode of free NH2 groups due to the organic amine modification. These peaks give direct evidence to the successful silylation of the GO materials.
O stretching of –COOH. The peaks at 1385 cm−1 and 1100 cm−1 also correspond to O–H vibration of C–OH groups and epoxy group vibration.31 The covalent functionalization of organic amine proceeds through two steps. In the first step, trialkoxy groups of silane generate –Si–OH groups by hydrolysis. Then the second step, the reaction between –Si–OH group of organo silane and –C–OH group of graphene oxide, covalently linked to the graphene surface through –Si–O–C– bond. In the FTIR spectra, the peak at 686 cm−1 is due to stretching vibrations of Si–O–C.32 The peaks at 3371 cm−1 and 1638 cm−1 corresponding to N–H stretching and NH2 bending mode of free NH2 groups due to the organic amine modification. These peaks give direct evidence to the successful silylation of the GO materials.
The Raman spectra of AAPTMS@GO (a), Cu–AAPTMS@GO (b), Ni–AAPTMS@GO (c), (1![[thin space (1/6-em)]](https://www.rsc.org/images/entities/char_2009.gif) :
:![[thin space (1/6-em)]](https://www.rsc.org/images/entities/char_2009.gif) 1) Cu–Ni–AAPTMS@GO (d) and (1
1) Cu–Ni–AAPTMS@GO (d) and (1![[thin space (1/6-em)]](https://www.rsc.org/images/entities/char_2009.gif) :
:![[thin space (1/6-em)]](https://www.rsc.org/images/entities/char_2009.gif) 1) Cu(0)–Ni(0)–AAPTMS@GO (e) are shown in ESI Fig. S2.† All the five samples showed similar characteristic D and G bands. In GO, the band at 1350 cm−1 corresponds to disorder in the sp2-hybridized carbon atoms in graphene oxide sheets from D-band, and 1590 cm−1 represents the σ-sp2 bonded C-atoms from G band of Raman spectra.31 After metal modification, the both D and G-band moved nearer to higher wave number, which may be due to the progressively increased compressive local stress caused by molecule intercalation as shown in ESI Fig. S2(a–e).†
1) Cu(0)–Ni(0)–AAPTMS@GO (e) are shown in ESI Fig. S2.† All the five samples showed similar characteristic D and G bands. In GO, the band at 1350 cm−1 corresponds to disorder in the sp2-hybridized carbon atoms in graphene oxide sheets from D-band, and 1590 cm−1 represents the σ-sp2 bonded C-atoms from G band of Raman spectra.31 After metal modification, the both D and G-band moved nearer to higher wave number, which may be due to the progressively increased compressive local stress caused by molecule intercalation as shown in ESI Fig. S2(a–e).†
X-ray photo electron spectroscopy give the information about the binding energy of Cu 2p and Ni 2p in (1![[thin space (1/6-em)]](https://www.rsc.org/images/entities/char_2009.gif) :
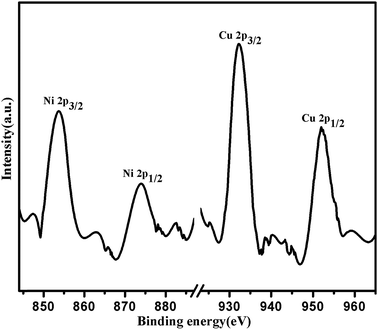
:![[thin space (1/6-em)]](https://www.rsc.org/images/entities/char_2009.gif) 1) Cu(0)–Ni(0)–AAPTMS@GO catalyst in Fig. 2. The binding energy of Cu 2p3/2 and Cu 2p1/2 are 932.3 eV and 952.12 eV respectively. The binding energy of Cu 2p3/2 was ∼0.5 eV lower than that in the metallic state of Cu. The binding energy of Ni 2p3/2 and Ni 2p1/2 are 853.5 eV and 873.3 eV respectively, which was ∼0.5 eV higher than that in the metallic state of Ni catalyst.33 The shifting of binding energies of Cu 2p3/2 and Ni 2p3/2 confirm the formation of alloy nanoparticles between Cu and Ni and also interaction between metallic alloy and support surface.
1) Cu(0)–Ni(0)–AAPTMS@GO catalyst in Fig. 2. The binding energy of Cu 2p3/2 and Cu 2p1/2 are 932.3 eV and 952.12 eV respectively. The binding energy of Cu 2p3/2 was ∼0.5 eV lower than that in the metallic state of Cu. The binding energy of Ni 2p3/2 and Ni 2p1/2 are 853.5 eV and 873.3 eV respectively, which was ∼0.5 eV higher than that in the metallic state of Ni catalyst.33 The shifting of binding energies of Cu 2p3/2 and Ni 2p3/2 confirm the formation of alloy nanoparticles between Cu and Ni and also interaction between metallic alloy and support surface.
TEM images of AAPTMS@GO (a), Cu–AAPTMS@GO (b), (1![[thin space (1/6-em)]](https://www.rsc.org/images/entities/char_2009.gif) :
:![[thin space (1/6-em)]](https://www.rsc.org/images/entities/char_2009.gif) 1) Cu–Ni–AAPTMS@GO (c), (1
1) Cu–Ni–AAPTMS@GO (c), (1![[thin space (1/6-em)]](https://www.rsc.org/images/entities/char_2009.gif) :
:![[thin space (1/6-em)]](https://www.rsc.org/images/entities/char_2009.gif) 1) Cu(0)–Ni(0)–AAPTMS@GO (d), (1
1) Cu(0)–Ni(0)–AAPTMS@GO (d), (1![[thin space (1/6-em)]](https://www.rsc.org/images/entities/char_2009.gif) :
:![[thin space (1/6-em)]](https://www.rsc.org/images/entities/char_2009.gif) 2) Cu(0)–Ni(0)–AAPTMS@GO (e) and (2
2) Cu(0)–Ni(0)–AAPTMS@GO (e) and (2![[thin space (1/6-em)]](https://www.rsc.org/images/entities/char_2009.gif) :
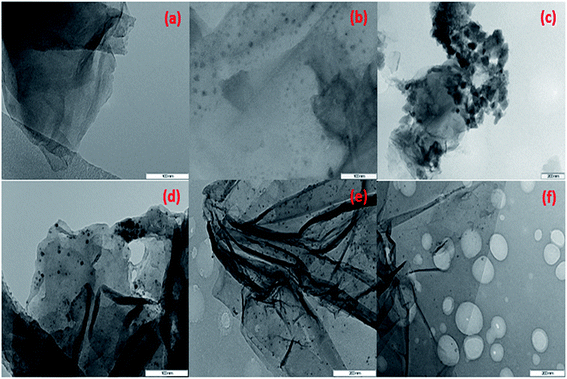
:![[thin space (1/6-em)]](https://www.rsc.org/images/entities/char_2009.gif) 1) Cu(0)–Ni(0)–AAPTMS@GO (f) samples, facilitate to examine the morphologies of the synthesized materials are shown in Fig. 3. The pure graphene oxide is composed of very thin sheets.28 After functionalization silane creates defects in the graphene oxide sheets, this morphology changes due to presence of organic solvents. The solvent appears to soften the severe attack of organic amine groups on GO surface and hinders breaking down of big sheets to smaller ones as shown in Fig. 3(a). Fig. 3(b) displays the only single metal particles, but in Fig. 3(c) displays the different phase of complex morphology of both bimetallic particles are formed, which is concurrent with the XRD study. After reduction of Cu and Ni metals by hydrazine in the Fig. 3(d)–(f), it can be seen that the well mono-dispersed Cu–Ni bimetallic nano particles are distributed on the functionalized graphene oxide sheets.
1) Cu(0)–Ni(0)–AAPTMS@GO (f) samples, facilitate to examine the morphologies of the synthesized materials are shown in Fig. 3. The pure graphene oxide is composed of very thin sheets.28 After functionalization silane creates defects in the graphene oxide sheets, this morphology changes due to presence of organic solvents. The solvent appears to soften the severe attack of organic amine groups on GO surface and hinders breaking down of big sheets to smaller ones as shown in Fig. 3(a). Fig. 3(b) displays the only single metal particles, but in Fig. 3(c) displays the different phase of complex morphology of both bimetallic particles are formed, which is concurrent with the XRD study. After reduction of Cu and Ni metals by hydrazine in the Fig. 3(d)–(f), it can be seen that the well mono-dispersed Cu–Ni bimetallic nano particles are distributed on the functionalized graphene oxide sheets.
The SEM images of AAPTMS@GO (a), Cu–AAPTMS@GO (b), (1![[thin space (1/6-em)]](https://www.rsc.org/images/entities/char_2009.gif) :
:![[thin space (1/6-em)]](https://www.rsc.org/images/entities/char_2009.gif) 1) Cu–Ni–AAPTMS@GO (c), (1
1) Cu–Ni–AAPTMS@GO (c), (1![[thin space (1/6-em)]](https://www.rsc.org/images/entities/char_2009.gif) :
:![[thin space (1/6-em)]](https://www.rsc.org/images/entities/char_2009.gif) 1) Cu(0)–Ni(0)–AAPTMS@GO (d), (1
1) Cu(0)–Ni(0)–AAPTMS@GO (d), (1![[thin space (1/6-em)]](https://www.rsc.org/images/entities/char_2009.gif) :
:![[thin space (1/6-em)]](https://www.rsc.org/images/entities/char_2009.gif) 2) Cu(0)–Ni(0)–AAPTMS@GO (e) and (2
2) Cu(0)–Ni(0)–AAPTMS@GO (e) and (2![[thin space (1/6-em)]](https://www.rsc.org/images/entities/char_2009.gif) :
:![[thin space (1/6-em)]](https://www.rsc.org/images/entities/char_2009.gif) 1) Cu(0)–Ni(0)–AAPTMS@GO (f) are shown in Fig. 4. From these images, the broken smaller sheets observed are formed after functionalization due to the interaction between silane and functional group of graphene oxide surface in the presence of organic solvent. The surface morphology of the materials was not changed after reduction of metals with hydrazine.
1) Cu(0)–Ni(0)–AAPTMS@GO (f) are shown in Fig. 4. From these images, the broken smaller sheets observed are formed after functionalization due to the interaction between silane and functional group of graphene oxide surface in the presence of organic solvent. The surface morphology of the materials was not changed after reduction of metals with hydrazine.
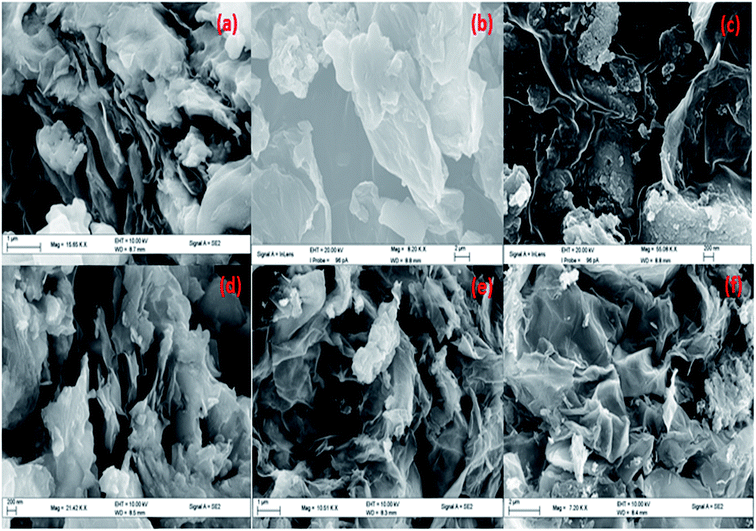 | ||
Fig. 4 SEM image of (a) AAPTMS@GO (b) Cu–AAPTMS@GO (c) (1![[thin space (1/6-em)]](https://www.rsc.org/images/entities/char_2009.gif) : :![[thin space (1/6-em)]](https://www.rsc.org/images/entities/char_2009.gif) 1) Cu–Ni–AAPTMS@GO (d) (1 1) Cu–Ni–AAPTMS@GO (d) (1![[thin space (1/6-em)]](https://www.rsc.org/images/entities/char_2009.gif) : :![[thin space (1/6-em)]](https://www.rsc.org/images/entities/char_2009.gif) 1) Cu(0)–Ni(0)–AAPTMS@GO (e) (1 1) Cu(0)–Ni(0)–AAPTMS@GO (e) (1![[thin space (1/6-em)]](https://www.rsc.org/images/entities/char_2009.gif) : :![[thin space (1/6-em)]](https://www.rsc.org/images/entities/char_2009.gif) 2) Cu(0)–Ni(0)–AAPTMS@GO and (f) (2 2) Cu(0)–Ni(0)–AAPTMS@GO and (f) (2![[thin space (1/6-em)]](https://www.rsc.org/images/entities/char_2009.gif) : :![[thin space (1/6-em)]](https://www.rsc.org/images/entities/char_2009.gif) 1) Cu(0)–Ni(0)–AAPTMS@GO. 1) Cu(0)–Ni(0)–AAPTMS@GO. | ||
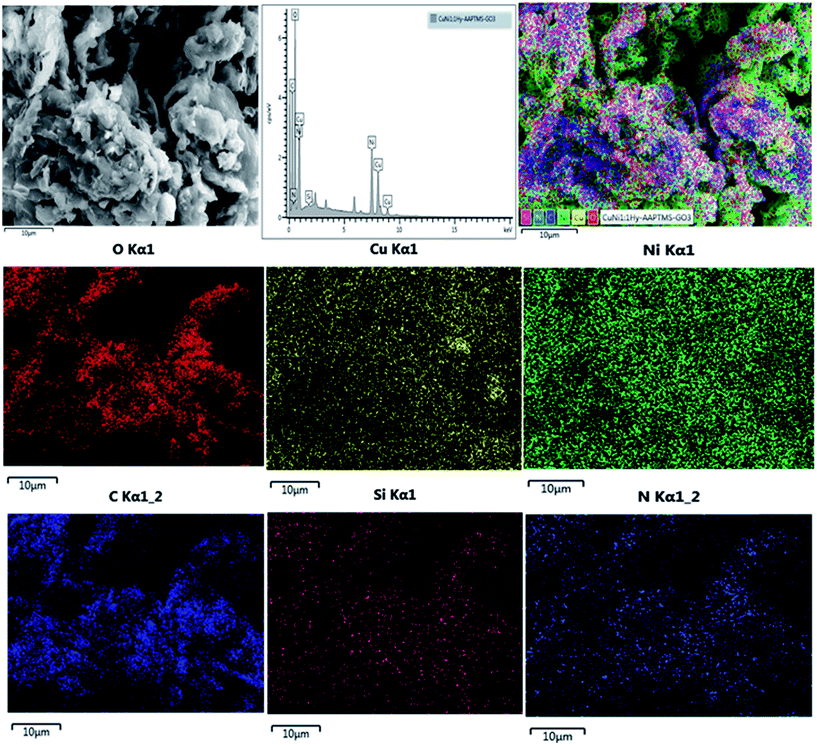
EDX spectroscopy gives the evidence on the type of element existing in the specific area. The SEM-EDX mapping of (1![[thin space (1/6-em)]](https://www.rsc.org/images/entities/char_2009.gif) :
:![[thin space (1/6-em)]](https://www.rsc.org/images/entities/char_2009.gif) 1) Cu(0)–Ni(0)–AAPTMS@GO sample is presented in the Fig. 5. From these images, the presence of silicon, carbon, nitrogen, oxygen, Cu and Ni in this material can be seen. Another most vital and valuable ability of the EDX technique is X-ray mapping of elements. The positions of particular elements emitting specific X-rays within a scrutiny field are indicated by unique colors. The maps of distribution of elements like Si, C, N, O, Cu and Ni are exposed individually and overlapped with the original image as shown in the Fig. 5. The elemental mapping survey reveals that the most active elements like Cu and Ni were uniformly distributed throughout the sample. ICP-OES was used to determine the percentage ratio of Cu and Ni in 5 wt% of (1
1) Cu(0)–Ni(0)–AAPTMS@GO sample is presented in the Fig. 5. From these images, the presence of silicon, carbon, nitrogen, oxygen, Cu and Ni in this material can be seen. Another most vital and valuable ability of the EDX technique is X-ray mapping of elements. The positions of particular elements emitting specific X-rays within a scrutiny field are indicated by unique colors. The maps of distribution of elements like Si, C, N, O, Cu and Ni are exposed individually and overlapped with the original image as shown in the Fig. 5. The elemental mapping survey reveals that the most active elements like Cu and Ni were uniformly distributed throughout the sample. ICP-OES was used to determine the percentage ratio of Cu and Ni in 5 wt% of (1![[thin space (1/6-em)]](https://www.rsc.org/images/entities/char_2009.gif) :
:![[thin space (1/6-em)]](https://www.rsc.org/images/entities/char_2009.gif) 1) Cu(0)–Ni(0)–AAPTMS@GO catalyst and it was found to be Cu/Ni ratio 0.98 i.e., Cu is slightly lower loading than Ni. This may be due to Ni, more electronegative than Cu, which can more easily coordinate to the electron donating N atom of AAPTMS group present on the amine functionalized graphene oxide surface.
1) Cu(0)–Ni(0)–AAPTMS@GO catalyst and it was found to be Cu/Ni ratio 0.98 i.e., Cu is slightly lower loading than Ni. This may be due to Ni, more electronegative than Cu, which can more easily coordinate to the electron donating N atom of AAPTMS group present on the amine functionalized graphene oxide surface.
HRTEM was also used to further investigate the morphologies, diffraction pattern and lattice fringes of the materials. The different magnification of (1![[thin space (1/6-em)]](https://www.rsc.org/images/entities/char_2009.gif) :
:![[thin space (1/6-em)]](https://www.rsc.org/images/entities/char_2009.gif) 1) Cu(0)–Ni(0)–AAPTMS@GO material with spherical nano particles can be seen in Fig. 6(a)–(e). From Fig. 6(g) showing the SAED pattern of the polycrystalline diffraction rings, (111) and (200) planes were indexed as the brighter inner diffraction ring and dimmer outer ring. The lattice fringe presented in Fig. 6(f) shows the single crystalline nature of the bimetallic alloy nano particles with characteristic d-spacings of 0.20 nm for (111) planes of both Ni and Cu. Therefore, it was confirmed that the solid solution constitutes both Cu and Ni.
1) Cu(0)–Ni(0)–AAPTMS@GO material with spherical nano particles can be seen in Fig. 6(a)–(e). From Fig. 6(g) showing the SAED pattern of the polycrystalline diffraction rings, (111) and (200) planes were indexed as the brighter inner diffraction ring and dimmer outer ring. The lattice fringe presented in Fig. 6(f) shows the single crystalline nature of the bimetallic alloy nano particles with characteristic d-spacings of 0.20 nm for (111) planes of both Ni and Cu. Therefore, it was confirmed that the solid solution constitutes both Cu and Ni.
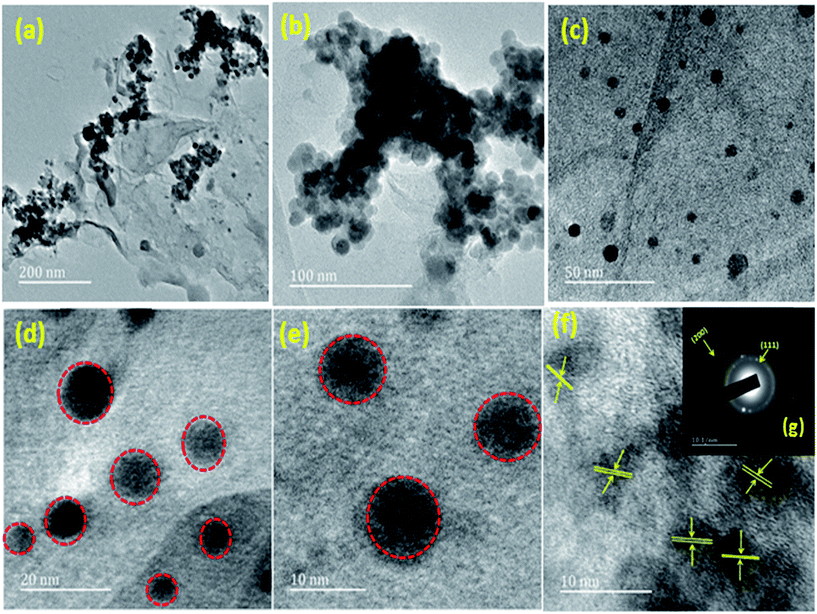 | ||
Fig. 6 HRTEM image of different magnification of (a–e) (1![[thin space (1/6-em)]](https://www.rsc.org/images/entities/char_2009.gif) : :![[thin space (1/6-em)]](https://www.rsc.org/images/entities/char_2009.gif) 1) Cu(0)–Ni(0)–AAPTMS@GO (f) lattice fringes of (1 1) Cu(0)–Ni(0)–AAPTMS@GO (f) lattice fringes of (1![[thin space (1/6-em)]](https://www.rsc.org/images/entities/char_2009.gif) : :![[thin space (1/6-em)]](https://www.rsc.org/images/entities/char_2009.gif) 1) Cu(0)–Ni(0)–AAPTMS@GO (g) SAED pattern of (1 1) Cu(0)–Ni(0)–AAPTMS@GO (g) SAED pattern of (1![[thin space (1/6-em)]](https://www.rsc.org/images/entities/char_2009.gif) : :![[thin space (1/6-em)]](https://www.rsc.org/images/entities/char_2009.gif) 1) Cu(0)–Ni(0)–AAPTMS@GO. 1) Cu(0)–Ni(0)–AAPTMS@GO. | ||
The TEM and HRTEM images of mono dispersed bimetallic nano particles with histogram of particle size distribution plot for the Cu–Ni nanoparticles are shown in the [Fig. 7(a) and (b)]. From this Fig. 7, the average diameter of particle size is calculated to be ∼4 nm with a narrow size variation.
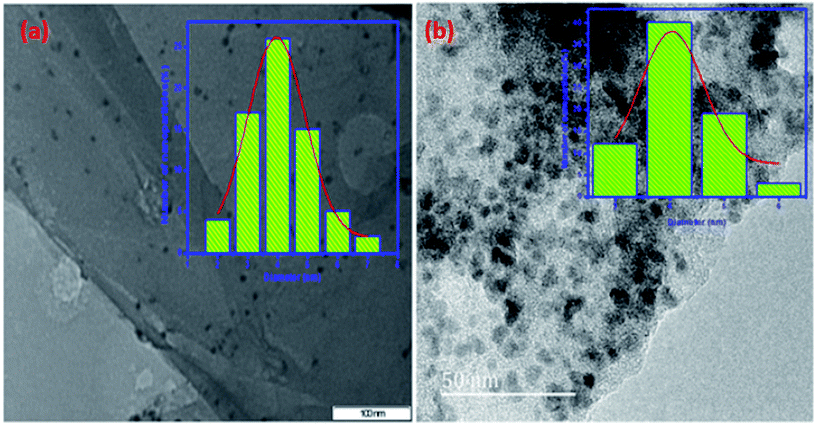 | ||
Fig. 7 (a) TEM (scale bar = 100 nm) and (b) HRTEM (scale bar = 50 nm) image at high magnification with particle size distribution plot of the (1![[thin space (1/6-em)]](https://www.rsc.org/images/entities/char_2009.gif) : :![[thin space (1/6-em)]](https://www.rsc.org/images/entities/char_2009.gif) 1) Cu(0)–Ni(0)–AAPTMS@GO. 1) Cu(0)–Ni(0)–AAPTMS@GO. | ||
3.2 Hydrogenation of unsaturated aldehydes
The scope of these novel nanomaterials was investigated on hydrogenation of unsaturated aldehyde to form an unsaturated alcohol product. Initially, to compare the activity and choice of different metal and different ratio of bimetallic modified functionalized GO were screened and the results are presented in the Table 1. A perusal of results in Table 1 shows that (1![[thin space (1/6-em)]](https://www.rsc.org/images/entities/char_2009.gif) :
:![[thin space (1/6-em)]](https://www.rsc.org/images/entities/char_2009.gif) 1) Cu(0)–Ni(0)–AAPTMS@GO nano materials gave excellent results compare to mono metallic and other bimetallic catalysts, due to synergetic effect and uniform distribution as well as sufficient amount of metal particles. In case of (1
1) Cu(0)–Ni(0)–AAPTMS@GO nano materials gave excellent results compare to mono metallic and other bimetallic catalysts, due to synergetic effect and uniform distribution as well as sufficient amount of metal particles. In case of (1![[thin space (1/6-em)]](https://www.rsc.org/images/entities/char_2009.gif) :
:![[thin space (1/6-em)]](https://www.rsc.org/images/entities/char_2009.gif) 2) and (2
2) and (2![[thin space (1/6-em)]](https://www.rsc.org/images/entities/char_2009.gif) :
:![[thin space (1/6-em)]](https://www.rsc.org/images/entities/char_2009.gif) 1) wt% composites, i.e., with one metal in excess than other, and their activity was lower for same reaction. That excess presence of one metal causes imbalance in the even distribution of active sites of the metals on the catalyst surface for the hydrogenation of unsaturated aldehyde. Hence, the activity of the catalyst decreased. With increase in the temperature (90–120 °C), the conversion of unsaturated aldehyde increased from 85% up to 98% and but selectivity towards cinnamyl alcohol (COL) decreased significantly (Table 2). This may be due to weakly adsorbed hydrogen on the catalyst surface, which enhances the conversion of COL to hydrocinnamyl alcohol (HCOL) at higher rate. Hence, the selectivity to cinnamyl alcohol decreases with rise in temperature.
1) wt% composites, i.e., with one metal in excess than other, and their activity was lower for same reaction. That excess presence of one metal causes imbalance in the even distribution of active sites of the metals on the catalyst surface for the hydrogenation of unsaturated aldehyde. Hence, the activity of the catalyst decreased. With increase in the temperature (90–120 °C), the conversion of unsaturated aldehyde increased from 85% up to 98% and but selectivity towards cinnamyl alcohol (COL) decreased significantly (Table 2). This may be due to weakly adsorbed hydrogen on the catalyst surface, which enhances the conversion of COL to hydrocinnamyl alcohol (HCOL) at higher rate. Hence, the selectivity to cinnamyl alcohol decreases with rise in temperature.
| Catalyst | Conv. (%) | Product selectivity (%) | |||
|---|---|---|---|---|---|
| HCAL | COL | HCOL | Others | ||
| a Catalyst (150 mg), cinnamaldehyde (1.2 g), methanol (16 ml), time (1 h), and temp. (80 °C). | |||||
| Cu–AAPTMS@GO | 39 | 26.5 | 30.0 | 42.4 | 1.1 |
| Ni–AAPTMS@GO | 44 | 26.2 | 32.7 | 40.3 | 0.8 |
(1![[thin space (1/6-em)]](https://www.rsc.org/images/entities/char_2009.gif) : :![[thin space (1/6-em)]](https://www.rsc.org/images/entities/char_2009.gif) 1) Cu–Ni–AAPTMS@GO 1) Cu–Ni–AAPTMS@GO |
52 | 18 | 42.2 | 38.5 | 1.3 |
(1![[thin space (1/6-em)]](https://www.rsc.org/images/entities/char_2009.gif) : :![[thin space (1/6-em)]](https://www.rsc.org/images/entities/char_2009.gif) 1) Cu(0)–Ni(0)–AAPTMS@GO 1) Cu(0)–Ni(0)–AAPTMS@GO |
85 | 17.6 | 59.8 | 22.4 | 0.2 |
(1![[thin space (1/6-em)]](https://www.rsc.org/images/entities/char_2009.gif) : :![[thin space (1/6-em)]](https://www.rsc.org/images/entities/char_2009.gif) 2) Cu(0)–Ni(0)–AAPTMS@GO 2) Cu(0)–Ni(0)–AAPTMS@GO |
82 | 11.8 | 51.3 | 36.3 | 0.6 |
(2![[thin space (1/6-em)]](https://www.rsc.org/images/entities/char_2009.gif) : :![[thin space (1/6-em)]](https://www.rsc.org/images/entities/char_2009.gif) 1) Cu(0)–Ni(0)–AAPTMS@GO 1) Cu(0)–Ni(0)–AAPTMS@GO |
79 | 14.4 | 49.0 | 35.7 | 0.9 |
![[thin space (1/6-em)]](https://www.rsc.org/images/entities/char_2009.gif) :
:![[thin space (1/6-em)]](https://www.rsc.org/images/entities/char_2009.gif) 1) Cu(0)–Ni(0)–AAPTMS@GO catalysta
1) Cu(0)–Ni(0)–AAPTMS@GO catalysta
| Temperature | Conv. (%) | Product selectivity (%) | |||
|---|---|---|---|---|---|
| HCAL | COL | HCOL | Others | ||
| a Catalyst (150 mg), cinnamaldehyde (1.2 g), methanol (16 ml), time (1 h), and temp. (90–120 °C). | |||||
| 90 °C | 89 | 14.9 | 50.8 | 33.8 | 0.5 |
| 100 °C | 92 | 12.3 | 42 | 44.5 | 1.2 |
| 120 °C | 98 | 10.4 | 21.5 | 66.7 | 1.4 |
Table 3 presents the activity/selectivity of hydrogenation of unsaturated aldehyde by (1![[thin space (1/6-em)]](https://www.rsc.org/images/entities/char_2009.gif) :
:![[thin space (1/6-em)]](https://www.rsc.org/images/entities/char_2009.gif) 1) Cu(0)–Ni(0)–AAPTMS@GO nano materials under same reaction conditions, but in different solvent media, such as water, methanol and isopropyl alcohol. The hydrogenation reaction with methanol as solvent gave better conversion and selectivity towards COL compared to other solvents. This could be due to higher dipole moment as well as higher solubility of hydrogen in methanol.
1) Cu(0)–Ni(0)–AAPTMS@GO nano materials under same reaction conditions, but in different solvent media, such as water, methanol and isopropyl alcohol. The hydrogenation reaction with methanol as solvent gave better conversion and selectivity towards COL compared to other solvents. This could be due to higher dipole moment as well as higher solubility of hydrogen in methanol.
![[thin space (1/6-em)]](https://www.rsc.org/images/entities/char_2009.gif) :
:![[thin space (1/6-em)]](https://www.rsc.org/images/entities/char_2009.gif) 1) Cu(0)–Ni(0)–AAPTMS@GO catalysta
1) Cu(0)–Ni(0)–AAPTMS@GO catalysta
| Solvent | Conv. (%) | Product selectivity (%) | |||
|---|---|---|---|---|---|
| HCAL | COL | HCOL | Others | ||
| a Catalyst (150 mg), cinnamaldehyde (1.2 g), time (1 h), and temp. (80 °C). | |||||
| Methanol | 85 | 17.6 | 59.8 | 22.4 | 0.2 |
| Isopropyl alcohol | 62 | 22.6 | 51.1 | 25.6 | 0.7 |
| Water | 57 | 45 | 21.8 | 32.8 | 0.4 |
3.3 Reduction of p-nitrophenol
Liu et al.34 have reported the reduction of p-nitro phenol to p-aminophenol with 99% conversion at 100 °C. Motoyama et al.,35 have reported >99% selectivity of nitro group reduction after 4 h reaction time. Various reports for reduction of PNP to PAP with varied conversions are also available in the literature which used metal nanoparticle systems,36–43 Ni/SiO2–AlO3 (ref. 44) and Pd/Cu, Pt/Cu, Pt/Au, Pd/Au and Au/Cu dendrimer encapsulated nanoparticles45 as catalysts. The p-nitrophenol to p-aminophenol by NaBH4, Pd/rGO proved better catalyst than the commercial Pd/C as reported by Sun et al.46 Göksu et al.,47 reported that hydrogenation of nitro/nitrile compounds with ammonia/borane catalysed by NiPd/GO nanoparticles gave ≥99% yield in presence of water and methanol within (5–30 min) at room temperature. A Pd/Cu nanoparticle supported on graphene gives 98% yield with 1.5 h reported by Xu et al.1In the current study the broader utility of Cu–Ni bimetallic graphene oxide nanocomposites as catalysts for hydrogenation of nitro phenol was investigated with NaBH4 as hydrogen source and water as solvent. The (1![[thin space (1/6-em)]](https://www.rsc.org/images/entities/char_2009.gif) :
:![[thin space (1/6-em)]](https://www.rsc.org/images/entities/char_2009.gif) 1) Cu(0)–Ni(0)–AAPTMS@GO as catalyst gave highly impressive results with 100% conversion and selectivity towards p-amino phenol and reaction finished in 16 min at RT, while the 1
1) Cu(0)–Ni(0)–AAPTMS@GO as catalyst gave highly impressive results with 100% conversion and selectivity towards p-amino phenol and reaction finished in 16 min at RT, while the 1![[thin space (1/6-em)]](https://www.rsc.org/images/entities/char_2009.gif) :
:![[thin space (1/6-em)]](https://www.rsc.org/images/entities/char_2009.gif) 2 and 2
2 and 2![[thin space (1/6-em)]](https://www.rsc.org/images/entities/char_2009.gif) :
:![[thin space (1/6-em)]](https://www.rsc.org/images/entities/char_2009.gif) 1 compositions recorded lower selectivity and conversions. These results prove superior to the literature reported results in terms of both conversion and selectivity efficiency and reaction conditions and time needed.
1 compositions recorded lower selectivity and conversions. These results prove superior to the literature reported results in terms of both conversion and selectivity efficiency and reaction conditions and time needed.
The hydrogen abstraction from BH4− and transferring to p-nitrophenolate anion occurred efficiently by the bimetallic alloy particles on the amino functionalised graphene oxide surface. The reduction of aromatic nitro compound was monitored by UV-Vis study. In UV-Vis, the peak at 400 nm indicates p-nitrophenolate anion and at 300 nm indicates the product of p-aminophenol with (1![[thin space (1/6-em)]](https://www.rsc.org/images/entities/char_2009.gif) :
:![[thin space (1/6-em)]](https://www.rsc.org/images/entities/char_2009.gif) 1) Cu(0)–Ni(0)–AAPTMS@GO catalyst shown in ESI Fig. S3.† In Fig. S3(A),† shows the decrease in absorbance at 400 nm, due to the consumption of p-nitrophenolate anion intermediate and the increase of intensity at 300 nm due to the formation of product, p-aminophenol. The representative products were characterized by 1H NMR, 13C NMR and FTIR spectroscopies for conformational study in ESI Fig. S4(a–c).† (1
1) Cu(0)–Ni(0)–AAPTMS@GO catalyst shown in ESI Fig. S3.† In Fig. S3(A),† shows the decrease in absorbance at 400 nm, due to the consumption of p-nitrophenolate anion intermediate and the increase of intensity at 300 nm due to the formation of product, p-aminophenol. The representative products were characterized by 1H NMR, 13C NMR and FTIR spectroscopies for conformational study in ESI Fig. S4(a–c).† (1![[thin space (1/6-em)]](https://www.rsc.org/images/entities/char_2009.gif) :
:![[thin space (1/6-em)]](https://www.rsc.org/images/entities/char_2009.gif) 1) Cu–Ni–AAPTMS@GO catalyst showed very less activity due to the presence of different form of metallic phases, which was confirmed from the XRD results. However, the (1
1) Cu–Ni–AAPTMS@GO catalyst showed very less activity due to the presence of different form of metallic phases, which was confirmed from the XRD results. However, the (1![[thin space (1/6-em)]](https://www.rsc.org/images/entities/char_2009.gif) :
:![[thin space (1/6-em)]](https://www.rsc.org/images/entities/char_2009.gif) 1) Cu(0)–Ni(0)–AAPTMS@GO catalyst displayed the best catalytic activity towards p-amino phenol reduction, when compared to (1
1) Cu(0)–Ni(0)–AAPTMS@GO catalyst displayed the best catalytic activity towards p-amino phenol reduction, when compared to (1![[thin space (1/6-em)]](https://www.rsc.org/images/entities/char_2009.gif) :
:![[thin space (1/6-em)]](https://www.rsc.org/images/entities/char_2009.gif) 2) Cu(0)–Ni(0)–AAPTMS@GO and (2
2) Cu(0)–Ni(0)–AAPTMS@GO and (2![[thin space (1/6-em)]](https://www.rsc.org/images/entities/char_2009.gif) :
:![[thin space (1/6-em)]](https://www.rsc.org/images/entities/char_2009.gif) 1) Cu(0)–Ni(0)–AAPTMS@GO. The high activity of (1
1) Cu(0)–Ni(0)–AAPTMS@GO. The high activity of (1![[thin space (1/6-em)]](https://www.rsc.org/images/entities/char_2009.gif) :
:![[thin space (1/6-em)]](https://www.rsc.org/images/entities/char_2009.gif) 1) Cu(0)–Ni(0)–AAPTMS@GO was due to good dispersion of the (1
1) Cu(0)–Ni(0)–AAPTMS@GO was due to good dispersion of the (1![[thin space (1/6-em)]](https://www.rsc.org/images/entities/char_2009.gif) :
:![[thin space (1/6-em)]](https://www.rsc.org/images/entities/char_2009.gif) 1) ratio of Cu–Ni bimetallic alloy nanoparticles on the functionalized graphene oxide sheets and the enhanced adsorption ability of graphene oxide for p-nitrophenol stems from the π–π stacking interactions. From Fig. S3(B) and (C),† it can be deduced that the reduction of nitro compound to amino compound over (1
1) ratio of Cu–Ni bimetallic alloy nanoparticles on the functionalized graphene oxide sheets and the enhanced adsorption ability of graphene oxide for p-nitrophenol stems from the π–π stacking interactions. From Fig. S3(B) and (C),† it can be deduced that the reduction of nitro compound to amino compound over (1![[thin space (1/6-em)]](https://www.rsc.org/images/entities/char_2009.gif) :
:![[thin space (1/6-em)]](https://www.rsc.org/images/entities/char_2009.gif) 1) Cu(0)–Ni(0)–AAPTMS@GO follow pseudo first-order kinetics for the chosen conditions.
1) Cu(0)–Ni(0)–AAPTMS@GO follow pseudo first-order kinetics for the chosen conditions.
Best features of ideal heterogeneous catalyst are high selectivity, high activity, long lifetime and cost effectiveness. The recyclability of the heterogeneous catalyst is vital parameter and it depends on its stability and the easy separability. The activity can change due to leaching of some metal particles into the reaction medium or may be the coke formation on the catalyst surface in the high temperature reactions. To test its robustness, the recovered catalyst was reused after regeneration followed by wash with water and calcination. No noticeable change up to 6th cycle was observed with activity remaining intact (Fig. 8). The catalyst did not leach out in this medium showing strong interaction between nanoparticles and amino group. The decrease in 7th circle could be due to some leaching Cu metal as compared to Ni. The binding capacity of Ni is higher than Cu, which can be more easily coordinated to the electron donating N atom of organic group present on the amine functionalized graphene oxide surface. The catalytic activity of hydrogenation of unsaturated aldehyde gives good conversion and selectivity and also the catalyst activity decreased (8%) in 5th cycle.
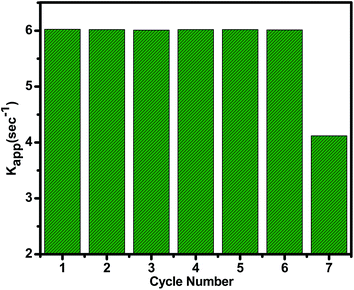 | ||
Fig. 8 The catalytic performance within seven cycles for the reduction of p-nitro phenol catalyzed by (1![[thin space (1/6-em)]](https://www.rsc.org/images/entities/char_2009.gif) : :![[thin space (1/6-em)]](https://www.rsc.org/images/entities/char_2009.gif) 1) Cu(0)–Ni(0)–AAPTMS@GO catalyst. 1) Cu(0)–Ni(0)–AAPTMS@GO catalyst. | ||
The reduction of PNP to PAP performance of (1![[thin space (1/6-em)]](https://www.rsc.org/images/entities/char_2009.gif) :
:![[thin space (1/6-em)]](https://www.rsc.org/images/entities/char_2009.gif) 1) Cu(0)–Ni(0)–AAPTMS@GO was evaluated and compared with the state of the art in the corresponding field in Table 4. The Pd/C and Pd/G catalysts46 the activity decreased in every cycle reaching 85% in the 5th cycle. With CuFe2O4 MNPs catalyst50 catalyst was stable up to 2nd cycles only. So, that our (1
1) Cu(0)–Ni(0)–AAPTMS@GO was evaluated and compared with the state of the art in the corresponding field in Table 4. The Pd/C and Pd/G catalysts46 the activity decreased in every cycle reaching 85% in the 5th cycle. With CuFe2O4 MNPs catalyst50 catalyst was stable up to 2nd cycles only. So, that our (1![[thin space (1/6-em)]](https://www.rsc.org/images/entities/char_2009.gif) :
:![[thin space (1/6-em)]](https://www.rsc.org/images/entities/char_2009.gif) 1) Cu(0)–Ni(0)–AAPTMS@GO catalyst has better recyclability and reusability.
1) Cu(0)–Ni(0)–AAPTMS@GO catalyst has better recyclability and reusability.
The XRD, FTIR, SEM, TEM, HRTEM analysis of sixth cycle of reused catalyst are shown in ESI Fig. S5.† In the XRD spectra of reused (1![[thin space (1/6-em)]](https://www.rsc.org/images/entities/char_2009.gif) :
:![[thin space (1/6-em)]](https://www.rsc.org/images/entities/char_2009.gif) 1) Cu(0)–Ni(0)–AAPTMS@GO catalyst, the strong and active diffraction peak of nano particle at 2θ = 43.51° for (111) plane, disappeared in the 7th cycle, although it can be seen after recycling it for the 6th cycle catalyst [Fig. S5(a) and (b)†]. From FTIR also it can be seen that the stretching vibrations of Si–O–C peak vanished after 6th cycle in [Fig. S5 (c) and (d)†]. The SEM, TEM and HRTEM images [Fig. S5(e)–(g)†] of the 6th cycle reused catalyst show no obvious change in morphology of the nanoparticles i.e., well-dispersed nanoparticles as like the fresh sample. Agglomerated bimetallic Cu–Ni nano particles were observed in the SEM, TEM and HRTEM images [Fig. S5(h)–(j)†] of the (1
1) Cu(0)–Ni(0)–AAPTMS@GO catalyst, the strong and active diffraction peak of nano particle at 2θ = 43.51° for (111) plane, disappeared in the 7th cycle, although it can be seen after recycling it for the 6th cycle catalyst [Fig. S5(a) and (b)†]. From FTIR also it can be seen that the stretching vibrations of Si–O–C peak vanished after 6th cycle in [Fig. S5 (c) and (d)†]. The SEM, TEM and HRTEM images [Fig. S5(e)–(g)†] of the 6th cycle reused catalyst show no obvious change in morphology of the nanoparticles i.e., well-dispersed nanoparticles as like the fresh sample. Agglomerated bimetallic Cu–Ni nano particles were observed in the SEM, TEM and HRTEM images [Fig. S5(h)–(j)†] of the (1![[thin space (1/6-em)]](https://www.rsc.org/images/entities/char_2009.gif) :
:![[thin space (1/6-em)]](https://www.rsc.org/images/entities/char_2009.gif) 1) Cu(0)–Ni(0)–AAPTMS@GO catalyst reused after six times.
1) Cu(0)–Ni(0)–AAPTMS@GO catalyst reused after six times.
4 Conclusions
In conclusion, in an environmentally friendly route different ratios of bimetallic Cu–Ni nanoparticles supported on organic functionalized graphene oxide were effectively prepared with an average particle size of 4 nm by a simple procedure. The 1![[thin space (1/6-em)]](https://www.rsc.org/images/entities/char_2009.gif) :
:![[thin space (1/6-em)]](https://www.rsc.org/images/entities/char_2009.gif) 1 ratio of the nano catalyst was found to be highly efficient (100% conversion and selectivity in <20 min at RT) and reusable and towards reduction of nitro compounds with water as solvent. The same proved ideal for hydrogenation of cinnamaldehyde with good conversion and selectivity with methanol as solvent. The activity was due to synergistic interactions between two metals involving charge transfer from one metal to another metal to form a Cu–Ni hetero structures with specific geometry in addition to the amino functionalized GO surface. The formation of bimetallic Cu–Ni particles was confirmed from XRD and XPS studies. From FT-IR and TEM analysis, covalent binding of the organic group of AAPTMS onto graphene oxide layer was confirmed. TEM and HR-TEM also confirmed that bimetallic Cu–Ni nanoparticles were uniformly distributed on the functionalized graphene oxide surface. The recovered catalyst can be recycled after activation. Bimetallic materials show higher CAL conversion and selectivity towards COL at lower temperatures, 80 °C and at higher temperatures (90–120 °C), while the conversion of CAL increased, selectivity towards COL got decreased due to weak adsorption of hydrogen on bimetallic catalysts surface at those temperatures.
1 ratio of the nano catalyst was found to be highly efficient (100% conversion and selectivity in <20 min at RT) and reusable and towards reduction of nitro compounds with water as solvent. The same proved ideal for hydrogenation of cinnamaldehyde with good conversion and selectivity with methanol as solvent. The activity was due to synergistic interactions between two metals involving charge transfer from one metal to another metal to form a Cu–Ni hetero structures with specific geometry in addition to the amino functionalized GO surface. The formation of bimetallic Cu–Ni particles was confirmed from XRD and XPS studies. From FT-IR and TEM analysis, covalent binding of the organic group of AAPTMS onto graphene oxide layer was confirmed. TEM and HR-TEM also confirmed that bimetallic Cu–Ni nanoparticles were uniformly distributed on the functionalized graphene oxide surface. The recovered catalyst can be recycled after activation. Bimetallic materials show higher CAL conversion and selectivity towards COL at lower temperatures, 80 °C and at higher temperatures (90–120 °C), while the conversion of CAL increased, selectivity towards COL got decreased due to weak adsorption of hydrogen on bimetallic catalysts surface at those temperatures.
Acknowledgements
The authors acknowledge the support received from the School of Chemistry & Physics and College of Agriculture, Engineering & Science, University of KwaZulu-Natal, Durban, South Africa in the form of research facilities and financial support.References
- Y.-S. Feng, J.-J. Ma, Y.-M. Kang and H.-J. Xu, Tetrahedron, 2014, 70, 6100–6105 CrossRef CAS.
- Y. Veena, G. Shweta, K. Rupesh, S. Gajendra and L. Rekh, Synth. Commun., 2012, 42, 213–222 CrossRef.
- J. Feng, J. M. Slocik, M. Sarikaya, R. R. Naik, B. L. Farmer and H. Heinz, Small, 2012, 8(7), 1049–1059 CrossRef CAS.
- G. R. Rao, Curr. Sci., 1998, 75, 901–910 CAS.
- T. Yamauchi, Y. Tsukahara, T. Sakata, H. Mori, T. Yanagida, T. Kawai and Y. Wada, Nanoscale, 2010, 2, 515–523 RSC.
- S. K. Singh, A. K. Singh, K. Aranishi and Q. Xu, J. Am. Chem. Soc., 2011, 133, 19638–19641 CrossRef CAS.
- N. V. Long, T. D. Hien, T. Asaka, M. Ohtaki and M. Nogami, Int. J. Hydrogen Energy, 2011, 36, 8478–8491 CrossRef.
- M. S. Wong, P. J. J. Alvarez, Y. Fang, N. Akçin, M. O. Nutt, J. T. Miller and K. N. Heck, J. Chem. Technol. Biotechnol., 2009, 84, 158–166 CrossRef CAS.
- (a) N. Dimitratos, J. A. Lopez-Sanchez and G. J. Hutchings, Chem. Sci., 2012, 3, 20–44 RSC; (b) S. E. Davis, M. S. Ide and R. J. Davis, Green Chem., 2013, 15, 17–45 RSC.
- (a) C. George, A. Genovese, A. Casu, M. Prato, M. Povia, L. Manna and T. Montanari, Nano Lett., 2013, 13, 752–757 CrossRef CAS; (b) J. Xu, T. White, P. Li, C. He, J. Yu, W. Yuan and Y.-F. Han, J. Am. Chem. Soc., 2010, 132, 10398–10406 CrossRef CAS PubMed.
- N. Dimitratos, A. Villa, D. Wang, F. Porta, D. Su and L. Prati, J. Catal., 2006, 244, 113–121 CrossRef CAS.
- J. K. Edwards, S. J. Freakley, A. F. Carley, C. J. Kiely and G. J. Hutchings, Acc. Chem. Res., 2014, 47, 845–854 CrossRef CAS.
- L. Kesavan, R. Tiruvalam, M. H. A. Rahim, M. I. bin Saiman, D. I. Enache, R. L. Jenkins, N. Dimitratos, J. A. Lopez-Sanchez, S. H. Taylor, D. W. Knight, C. J. Kiely and G. J. Hutchings, Science, 2011, 331, 195–199 CrossRef CAS.
- (a) D. Martin Alonso, S. G. Wettsteina and J. A. Dumesic, Chem. Soc. Rev., 2012, 41, 8075–8098 RSC; (b) H. Zhanga and N. Toshima, Catal. Sci. Technol., 2013, 3, 268–278 RSC.
- V. K. Gupta, I. Tyagi, H. Sadegh, R. S. Ghoshekandi, A. S. H. Makhlouf and B. Maazinejad, Sci. Technol. Dev., 2015, 34, 195–214 CrossRef.
- V. K. Gupta, R. Kumar, A. Nayak, T. A. Saleh and M. A. Barakat, Adv. Colloid Interface Sci., 2013, 193–194, 24–34 CrossRef CAS.
- V. K. Gupta, S. Agarwal and T. A. Saleh, J. Hazard. Mater., 2011, 185, 17–23 CrossRef CAS.
- T. A. Saleh and V. K. Gupta, Adv. Colloid Interface Sci., 2014, 211, 93–101 CrossRef CAS.
- A. K. Geim and K. S. Novoselov, Nat. Mater., 2007, 6, 183–191 CrossRef CAS.
- G. B. B. Varadwaj and V. O. Nyamori, Nano Res., 2016, 9, 3598–3621 CrossRef CAS.
- L. Yang, S. Luo, Y. Li, Y. Xiao, Q. Kang and Q. Cai, Environ. Sci. Technol., 2010, 44, 7641–7646 CrossRef CAS.
- M. G. Prakash, R. Mahalakshmy, K. R. Krishnamurthy and B. Viswanathan, Catal. Today, 2016, 263, 105–111 CrossRef CAS.
- W. Lin, H. Chang, L. He, Y. Yu and F. Zhang, J. Catal., 2013, 303, 110–116 CrossRef CAS.
- G. X. Zhao, X. M. Ren, X. Gao, X. L. Tan, J. X. Li, C. L. Chen, Y. Y. Huang and X. K. Wang, Dalton Trans., 2011, 40, 10945–10952 RSC.
- Y. J. Li, W. Gao, L. J. Ci, C. M. Wang and P. M. Ajayan, Carbon, 2010, 48, 1124–1130 CrossRef CAS.
- H. K. Jeong, Y. P. Lee, R. J. W. E. Lahaye, M. H. Park, K. H. An, I. J. Kim, C.-W. Yang, C. Y. Park, R. S. Ruoff and Y. H. Lee, J. Am. Chem. Soc., 2008, 130, 1362–1366 CrossRef CAS.
- J. J. Niu and J. N. Wang, Electrochim. Acta, 2008, 53, 8058–8068 CrossRef CAS.
- S. Rana, S. Maddila and S. B. Jonnalagadda, Catal. Sci. Technol., 2015, 5, 3235–3241 RSC.
- N. H. Kim, T. Kuila and J. H. Lee, J. Mater. Chem. A, 2013, 1, 1349–1358 RSC.
- G. MO, W.-D. Cheng, Q. Cai, W. Wang, K.-H. Zhang, X.-Q. Xing, Z.-J. Chen and Z.-H. Wu, Mater. Chem. Phys., 2010, 121, 390–394 CrossRef CAS.
- S. Rana, S. Maddila, K. Yalagala and S. B. Jonnalagadda, Appl. Catal., A, 2015, 505, 539–547 CrossRef CAS.
- Q. Zhao, Y. Li, R. Liu, A. Chen, G. Zhang, F. Zhang and X. Fan, J. Mater. Chem. A, 2013, 1, 15039–15045 RSC.
- Handbook of X-ray Photoelectron Spectroscopy, Physical Electronic Division, Perkin-Elmer, 1979, vol. 55, p. 344 Search PubMed.
- H. Liu, J. Deng and W. Li, Catal. Lett., 2010, 137, 261–266 CrossRef CAS.
- M. Takasaki, Y. Motoyama, K. Higashi, S. Yoon, I. Mochida and H. Nagashima, Org. Lett., 2008, 10, 1601–1604 CrossRef CAS.
- S. K. Ghosh, M. Mandal, S. Kundu, S. Nath and T. Pal, Appl. Catal., A, 2004, 4, 61–66 CrossRef.
- S. Wunder, Y. Lu, M. Albrecht and M. Ballauff, ACS Catal., 2011, 1, 908–916 CrossRef CAS.
- I. H. A. E. Maksod, E. Z. Hegazy, S. H. Kenawy and T. S. Saleh, Adv. Synth. Catal., 2010, 352, 1169–1178 CrossRef.
- S. Jana, S. K. Ghosh, S. Nath, S. Pande, S. Praharaj, S. Panigrahi, S. Basu, T. Endo and T. Pal, Appl. Catal., A, 2006, 313, 41–48 CrossRef CAS.
- X. Bai, Y. Gao, H. Liu and L. Zheng, J. Phys. Chem. C, 2009, 113, 17730–17736 CrossRef CAS.
- Z. V. Feng, J. L. Lyon, J. S. Croley, R. M. Crooks, D. A. V. Bout and K. J. Stevenson, J. Chem. Educ., 2009, 86, 368–372 CrossRef CAS.
- S. Sarkar, M. Pradhan, A. K. Sinha, M. Basu, Y. Negishi and T. Pal, Inorg. Chem., 2010, 49, 8813–8827 CrossRef CAS.
- S. Wunder, F. Polzer, Y. Lu, Y. Mei and M. Ballauff, J. Phys. Chem. C, 2010, 114, 8814–8820 CrossRef CAS.
- M. A. Cangiano, M. W. Ojeda, A. C. Carreras, J. A. González and M. C. Ruiz, Mater. Charact., 2010, 61, 1135–1146 CrossRef CAS.
- Z. D. Pozun, S. E. Rodenbusch, E. Keller, K. Tran, W. Tang, K. J. Stevenson and G. Henkelman, J. Phys. Chem. C, 2013, 117, 7598–7604 CrossRef CAS.
- J. Sun, Y. Fu, G. He, X. Sun and X. Wang, Catal. Sci. Technol., 2014, 4, 1742–1748 RSC.
- H. Göksu, S. F. Ho, O. Metin, K. Korkmaz, A. M. Garcia, M. S. Gültekin and S. Sun, ACS Catal., 2014, 4, 1777–1782 CrossRef.
- N. Sahiner, H. Ozay, O. Ozay and N. Aktas, Appl. Catal., B, 2010, 101, 137–143 CrossRef CAS.
- S. Saha, A. Pal, S. Kundu, S. Basu and T. Pal, Langmuir, 2010, 26, 2885–2893 CrossRef CAS.
- J. Feng, L. Su, Y. Ma, C. Ren, Q. Guo and X. Chen, Chem. Eng. J., 2013, 221, 16–24 CrossRef CAS.
Footnote |
| † Electronic supplementary information (ESI) available. See DOI: 10.1039/c6ra26443c |
| This journal is © The Royal Society of Chemistry 2017 |

