
 Open Access Article
 This Open Access Article is licensed under a Creative Commons Attribution-Non Commercial 3.0 Unported Licence
Fabrication of WO2.72/RGO nano-composites for enhanced photocatalysis
Bo Maa,
Erwei Huanga,
Guangjun Wua,
Weili Daia,
Naijia Guanab and
Landong Li *ab
*ab
aSchool of Materials Science and Engineering, National Institute for Advanced Materials, Nankai University, Tianjin, 300350, P. R. China
bKey Laboratory of Advanced Energy Materials Chemistry (Ministry of Education), Collaborative Innovation Center of Chemical Science and Engineering, Tianjin, 300071, P. R. China. E-mail: lild@nankai.edu.cn
First published on 12th January 2017
Abstract
WO2.72 nanoparticles with sizes below 10 nm have been synthesized via controllable alcoholysis followed by thermal treatment. Through an in situ loading process, homogeneous composites containing WO2.72 nanoparticles and reduced graphene oxide, i.e. WO2.72/RGO, can be fabricated. The physico-chemical properties of the as-prepared WO2.72 and WO2.72/RGO composites are investigated by means of XRD, Raman, XPS, TGA, SEM, TEM and UV-vis spectroscopy. The RGO support, as a very good electron conductor, can efficiently transfer the photo-generated electrons formed on WO2.72 and suppress their recombination. As a result, WO2.72/RGO nano-composites exhibit remarkable photocatalytic activity in both the oxygen evolution from water splitting and selective oxidation of benzyl alcohol, several times higher than pristine WO2.72. The better light harvesting properties of WO2.72/RGO nano-composites than WO2.72 nanoparticles can be directly demonstrated by photocurrent response analysis.
Introduction
Since Fujishima and Honda discovered photocatalytic water splitting on a TiO2 electrode in the 1970s,1 semiconductor photocatalysis has received a great deal of attention due to its promising applications in solar energy harvesting, e.g. photocatalytic water splitting2–5 and photocatalytic reduction of carbon dioxide.6–10 Tungsten sub-oxides (WO3−x) with a band gap of 2.4–3.0 eV are recognized as important n-type semiconductors, which have been successfully applied as gas sensors, electrochromic devices and photocatalysts.11,12 Among all the tungsten sub-oxides, monoclinic WO2.72, also expressed as W18O49, has received considerable attention due to its distinctive oxygen defect structure and intense near-infrared photo-absorption.13–16For semiconductors, morphology control is known as an effective strategy to modifying their photocatalytic properties.17,18 Till now, WO2.72 samples with various morphologies, e.g. nanowires, nanorods, nanosheets and hierarchical structures, have been successfully synthesized and applied as robust semiconductor photocatalysts.14–16,19,20 Compared with bulk materials, nanoparticles generally possess higher specific surface areas and stronger adsorption ability toward reactants, both of which are good for photocatalysis. Thus, it is important to find a simple process to obtain semiconductor nanoparticles for efficient photocatalysis.21,22 However, to the best of our knowledge, few researches are focused on WO2.72 nanoparticles, especially in the sizes below 10 nanometers.
Graphene, a flat monolayer of sp2 hybridized carbon atoms arranged in a two-dimensional honeycomb lattice, with a large specific surface area, flexible structure, high intrinsic electron mobility, and good thermal conductivities,23–25 has triggered great research interests since graphene sheets were first separated from graphite in 2004.26 Graphene oxide (GO) is known as a precursor for graphene preparation and it can be produced by the strong oxidation/intercalation of graphite, which introduces various oxide-containing functional groups on the carbon basal plane and edges.27 Consequently, GO can be dispersed in water on the molecular scale.28 Based on these advantages of GO, the efforts of utilizing GO or reduced graphene oxide (RGO) as support material have been devoted to the fabrication of efficient photocatalysts.29 Especially, composites of RGO and stoichiometric tungsten oxide have been recently prepared and applied in different fields.30–36
In this study, sub-10 nm WO2.72 nanoparticles are synthesized via controllable alcoholysis followed by thermal treatment. After compositing with RGO, the homogeneous WO2.72/RGO exhibits greatly enhanced photocatalytic activity than pristine WO2.72 in both oxygen evolution from water splitting and alcohol selective oxidation, due to the synergetic effects between WO2.72 and RGO.
Experimental
Preparation of WO2.72 and WO2.72/RGO composites
All the chemical reagents employed in this study are of analytical grade from Alfa Aesar and used as received without further purification. Graphene oxide (GO) was synthesized by the oxidation of natural graphite powder using Hummers method with some modifications.37,38 (NH4)xWO3−y was synthesized at the ambient atmosphere by a solvent refluxing method. In a typical procedure, 1 g of WCl6 was dissolved in 31.0 mL ethanol to get the W6+ concentration of ∼0.08 M, then 5 mL ammonia solution (25 wt%) was added under vigorous stirring. The mixture was stirred in air for 15 min, followed by refluxing at 373 K for 3.5 h in a flask. 100 mg GO was dispersed in 100 mL ethanol and mixed with the calculated amount of (NH4)xWO3−y and stirred for 4 h at room temperature. After solvent being evaporated, the brown mixture was dried at 353 K overnight. The obtained solid was further pyrolyzed under argon atmosphere at the temperature of 723 K for 2 h to derive the final product WO2.72/RGO-x, where x represents the weight percentage of RGO in the composite.For reference, pure WO2.72 powders were obtained via the same procedure but without adding GO solution and pure WO3 powders were pyrolyzed under air atmosphere instead of argon.
Sample characterization
The X-ray diffraction (XRD) patterns of samples were recorded using a Bruker D8 advance powder diffractometer with Cu-Kα radiation (λ = 0.1542 nm) at a scanning rate of 5° min−1.The specific surface areas of samples were determined through N2 adsorption/desorption isotherms at 77 K collected on a Quantachrome iQ-MP gas adsorption analyzer.
The thermogravimetric analysis (TGA) of samples was performed on a TA SDT Q600 analyzer in air at a heating rate of 10 K min−1.
The Raman spectra of samples were recorded on a Renishaw InVia Raman spectrometer with the green line of an Ar-ion laser (514.53 nm) in micro-Raman configuration.
Diffuse reflectance ultraviolet-visible (UV-Vis) spectra of samples were recorded against BaSO4 on a Varian Cary 300 UV-Vis spectrophotometer.
Scanning electron microscopy (SEM) images of samples were taken on a field emission scanning electron microscope (FE-SEM, Hitachi S-4800). Transmission electron microscopy (TEM) images of samples were taken on a FEI Tecnai G2 F20 electron microscope at an acceleration voltage of 200 kV.
X-ray photoelectron spectra (XPS) and ultraviolet photoelectron spectra (UPS) of samples were recorded on a Thermo Scientific ESCALAB 250Xi spectrometer, which were employed with monochromatic exciting Al-Kα X-ray (1486.6 eV) and He I (21.2 eV), respectively.
Photoluminescence (PL) spectra were recorded on a Spex FL201 fluorescence spectrophotometer. The samples were dry-pressed into self-supporting wafers and then illuminated by 325 nm He–Cd laser as excitation source at ambient temperature.
Photocatalytic evaluations
Photocatalytic water oxidation reactions were performed in a top-irradiation-type Pyrex cell connected to a closed gas circulation and evacuation system with external light irradiation. The light source was a 300 W high pressure integrated type xenon lamp (PLS-SXE, wavelength: 300–780 nm). In a typical experiment, 0.1 g photocatalyst and 0.2 g AgNO3 (as sacrificing reagent) were sequentially added into 100 mL ultra-pure water in the reactor under magnetic vigorous stirring to obtain a well-mixed suspension. After being evacuated for 30 min, the reactor cell was irradiated by the Xe lamp. During the experiment, the temperature of the reactor system was kept at 298 K by flowing temperature-controlled cooling water. The amount of O2 evolved from water splitting was determined by an on-line gas chromatograph (Varian CP-3800, equipped with a thermal conductivity detector and a 4 m 5A molecular sieve column; nitrogen as carrier gas).The photocatalytic oxidation of benzyl alcohol was performed in a top-irradiation-type double-walled quartz cell cooled by water with a Xe lamp (200 W, wavelength: 320–780 nm) as the light source. In each experiment, the catalyst of 0.1 g was dispersed in the 60 mL benzotrifluoride solvent containing 25 mmol benzyl alcohol in the quartz cell under stirring. The suspension was then irradiated with oxygen bubbled in at 20 mL min−1. The organic products were analyzed by GC (Shimadzu GC-2010 Plus) and GC-MS (Shimadzu GCMS-QP2010 SE). The apparent quantum yield of benzyl alcohol oxidation was measured under the same photocatalytic reaction conditions but using 350 nm monochromatic light obtained by band-pass filters. The light intensity is measured to be 3.2 mW cm−2 with an area of 7.1 cm2. The apparent quantum yield (QY) of photocatalytic benzyl alcohol oxidation was calculated according to the follow equations:
The transformation of one benzyl alcohol molecule consumes two photoelectrons:
| 2C6H5CH2–OH + 4h+ → 2C6H5–CHO + 4H+ |
| 4H+ + 4e− + O2 → 2H2O |
Electrochemical measurements
The electrochemical measurements were measured using a three-electrode cell electrochemical workstation (IVIUM CompactStat) in 0.5 M Na2SO4 solution. The saturated Ag/AgCl and platinum foil (1 × 2 cm2) were used as the reference electrode and the counter electrode. The sample of 1 mg was dispersed in 1 mL anhydrous ethanol and then evenly grinded to slurry. The slurry was spread onto ITO glass and the exposed area was kept at 0.15 cm2. The prepared ITO/samples were dried overnight under ambient condition and then used as the working electrode for electrochemical measurements.Results and discussion
The XRD patterns of RGO, WO2.72 and WO2.72/RGO-5 samples are shown in Fig. 1. All of the diffraction peaks of WO2.72 sample can be indexed to JCPDS 36-101, indicating the formation of pure phase of monoclinic WO2.72.39 For RGO sample, the weak and broad diffraction peak at ∼25° corresponds to the (002) peak of graphene is observed.40 For WO2.72/RGO-5, the diffraction peaks corresponding to monoclinic WO2.72 are observed, while the presence of the RGO support (5% weight loading) significantly decreases the intensity of diffraction peaks. The average crystallite size of WO2.72 in pure WO2.72 and WO2.72/RGO composite are calculated to be 9 and 7 nm by using the Scherrer equation. These results indicate that the growth of WO2.72 nanoparticles on the RGO sheets could be restricted to some extent, in consistence with the TEM observations (vide infra).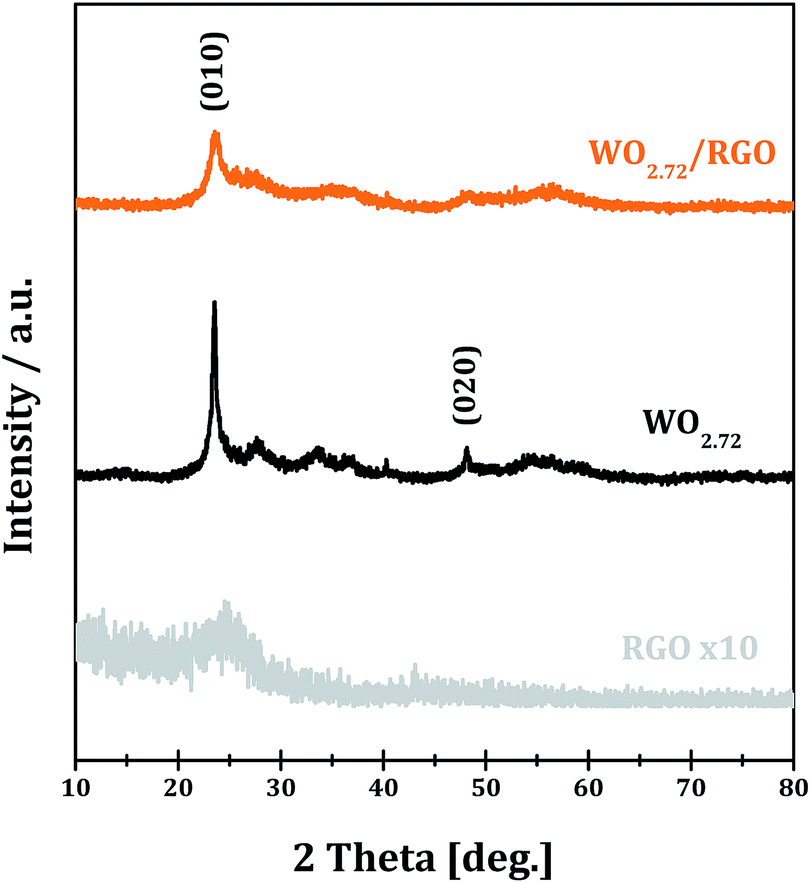 | ||
| Fig. 1 XRD of RGO, WO2.72 and WO2.72/RGO. | ||
Raman spectroscopy is an effective means to characterize carbon materials with usual characteristics of G and D bands. The Raman spectra of the GO, RGO and WO2.72/RGO are shown in Fig. 2. In the case of GO, the G-band peak at around 1595 cm−1 is attributed to a well ordered sp2 carbon-type structure and the D-band at around 1345 cm−1 is attributed to the structural defects of the hexagonal graphitic structure.41,42 The intensity ratio D-band to G-band, i.e. ID/IG, is calculated to be 1.0, indicating the existence of abundant surface defects in GO. Upon annealing to RGO, the ID/IG decreases significantly to 0.8 due to the elimination of some structural defects. While for WO2.72/RGO-5, a lower ID/IG of 0.7 is obtained, revealing that some graphitic structure defects in RGO are further eliminated through compositing with WO2.72. Moreover, a noticeable shift of D-band from 1345 to 1360 cm−1 is observed due to the interaction between WO2.72 nanoparticles and defects in RGO.
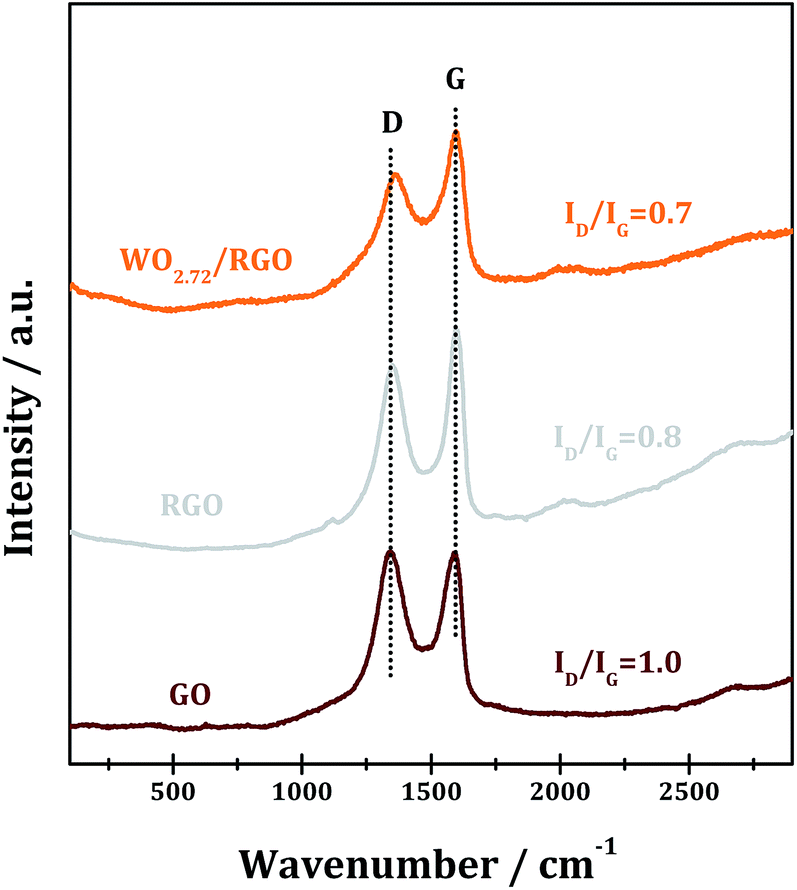 | ||
| Fig. 2 Raman spectra of GO, RGO and WO2.72/RGO. | ||
XPS analysis is performed to reveal the chemical composition and the element existing states in the as-prepared WO2.72/RGO. In the survey spectra of the WO2.72/RGO, the existence of W, O and C could be clearly identified (Fig. 3a). In the high-resolution C 1s XPS of the WO2.72/RGO (Fig. 3b), binding energy values at 284.6, 285.7, 287.1 and 289.0 eV are observed. The binding energy value at 284.6 eV is assigned to the graphitic carbon (C–C bonds), while the another three binding energy values at 285.7, 287.1 and 289.0 eV are assigned to C–O, C![[double bond, length as m-dash]](https://www.rsc.org/images/entities/char_e001.gif) O, and O–CO bonds, respectively.43 In the O 1s XPS (Fig. 3c), two binding energy values are observed, i.e. 530.6 eV due to W–O bonds in WO2.72 and 531.9 eV due to H–O or C–O bonds from residual oxygen-containing groups. The C 1s and O 1s XPS indicate the existence of a small amount of oxygen-containing carbon groups in the WO2.72/RGO.44 The core-level W 4f XPS (Fig. 3d) show the presence of two sets of peaks at 35.7/37.8 and 35.2/37.2 eV, respectively. The strong peaks with binding energy values of 35.7 and 37.8 eV are assigned to W 4f7/2 and W 4f5/2 of the characteristic W6+ oxidation state, while the small peaks at 35.2 and 37.2 eV can be assigned to W 4f7/2 and W 4f5/2 of W5+ oxidation state in tungsten oxides.45
O, and O–CO bonds, respectively.43 In the O 1s XPS (Fig. 3c), two binding energy values are observed, i.e. 530.6 eV due to W–O bonds in WO2.72 and 531.9 eV due to H–O or C–O bonds from residual oxygen-containing groups. The C 1s and O 1s XPS indicate the existence of a small amount of oxygen-containing carbon groups in the WO2.72/RGO.44 The core-level W 4f XPS (Fig. 3d) show the presence of two sets of peaks at 35.7/37.8 and 35.2/37.2 eV, respectively. The strong peaks with binding energy values of 35.7 and 37.8 eV are assigned to W 4f7/2 and W 4f5/2 of the characteristic W6+ oxidation state, while the small peaks at 35.2 and 37.2 eV can be assigned to W 4f7/2 and W 4f5/2 of W5+ oxidation state in tungsten oxides.45
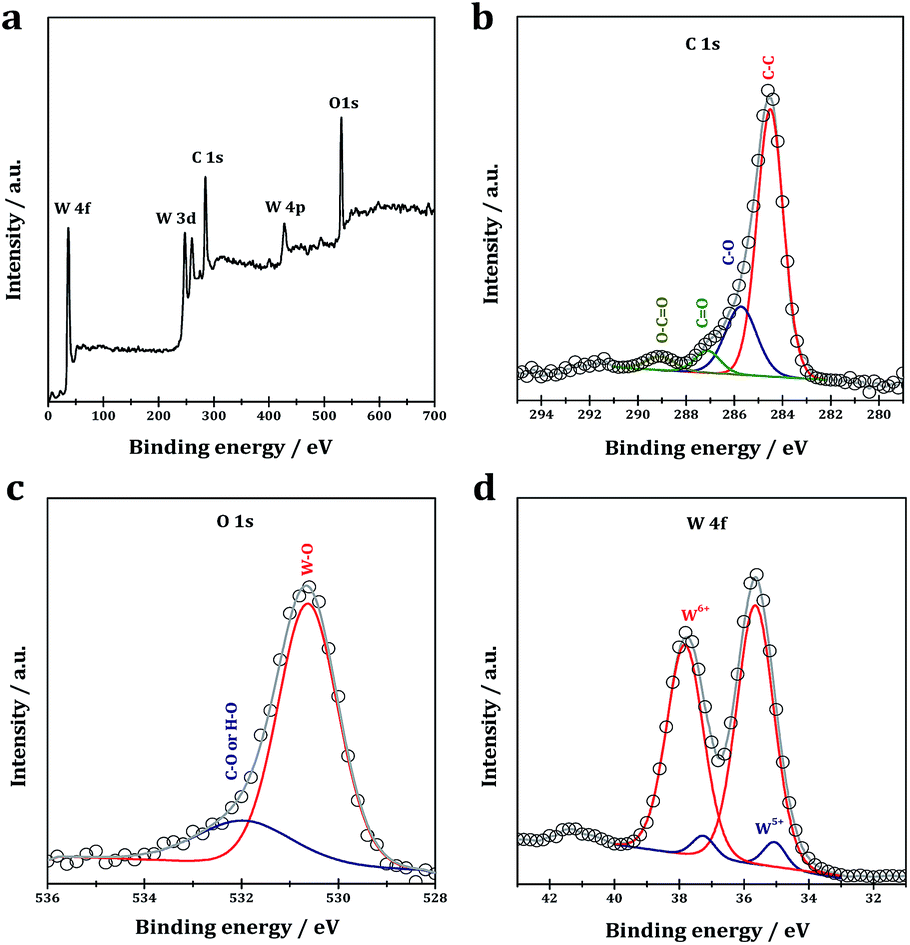 | ||
| Fig. 3 Survey (a), C 1s (b), O 1s (c) and W 4f (d) XPS of WO2.72/RGO-5. | ||
Fig. 4 shows the TGA curves WO2.72/RGO composites with different RGO loadings. The weight loss observed from 300 to 473 K from WO2.72/RGO is mainly due to the loss of water. While the largest weight loss occurs at temperature from 673 to 873 K for all WO2.72/RGO samples should be due to the oxidative destruction of the carbon skeleton, i.e. carbon-based materials oxidized to CO2 in flowing oxygen. According to the weight loss of WO2.72/RGO composites, the weight loading of RGO in the composites is determined to be 3.1, 4.7 and 6.5% for WO2.72/RGO-3, WO2.72/RGO-5 and WO2.72/RGO-7, respectively.
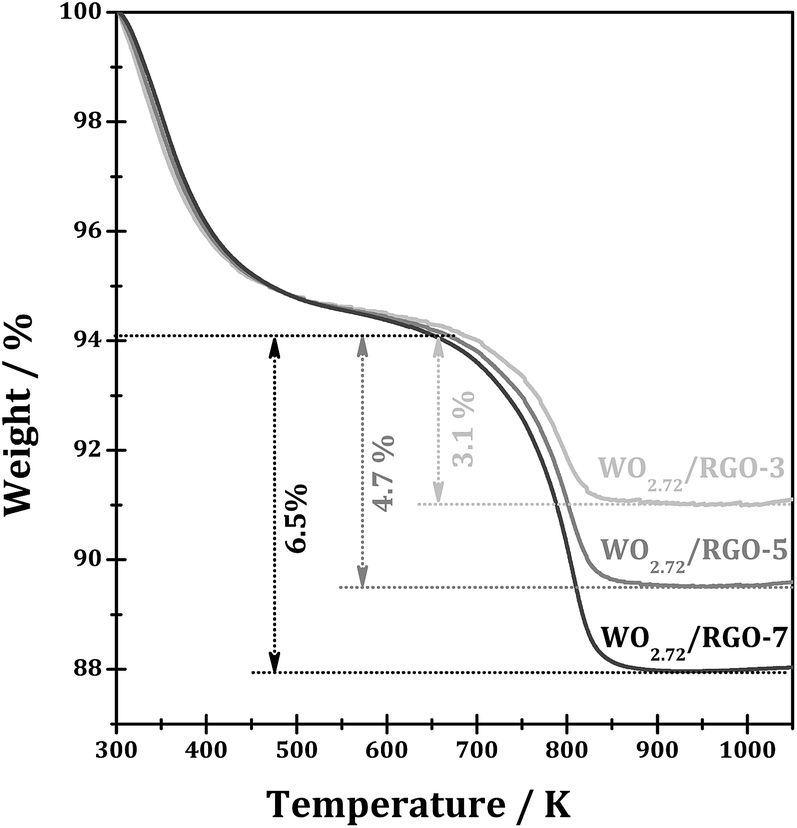 | ||
| Fig. 4 TGA curves of WO2.72/RGO with different RGO loadings. | ||
The SEM images of WO2.72 and WO2.72/RGO-5 are shown in Fig. 5. The pure WO2.72 appears as aggregation of nanoparticles with size of ∼10 nm (Fig. 5a). The uniform nanoparticles obtained demonstrate that thermal decomposition of (NH4)xWO3−y under inert atmosphere is an effective strategy to prepare WO2.72. For WO2.72/RGO composite, the curled and corrugated layered structure of RGO nanosheets with tiny nanoparticles spread over the surface could be identified (Fig. 5b). These tiny nanoparticles, i.e. WO2.72, are homogeneously distributed with sizes below 10 nm, slightly larger than that obtained from XRD analysis (Fig. 1). Besides, the close contact between WO2.72 nanoparticles and RGO support can be illustrated, which is very important for the photocatalytic performance of WO2.72/RGO composite (vide infra).
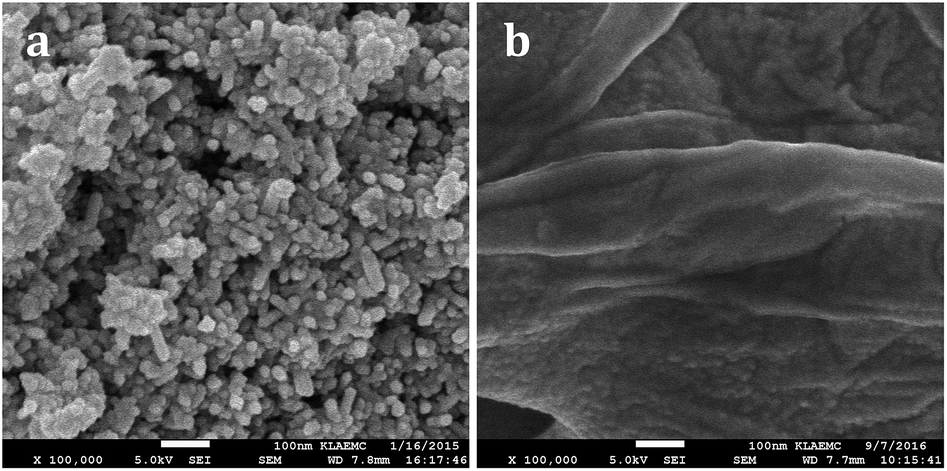 | ||
| Fig. 5 SEM images of WO2.72 (a) and WO2.72/RGO (b) samples. | ||
The morphology and composition of the WO2.72/RGO-5 composite are further characterized by TEM and the representative images as shown in Fig. 6. In the overview TEM image (Fig. 6a), uniform WO2.72 nanoparticles, with size of 3–10 nm, are evenly deposited on RGO nanosheets. The average particle size is calculated to be 6.7 nm for supported WO2.72 (Fig. 6b), in good agreement with XRD analysis (Fig. 1). In the preparation process, the hydrolysis rate of tungsten salt could be well controlled by the existence of ammonia, which releases hydroxyl ions slowly in ethanol with increasing temperature. Since ammonia molecules tend to strongly chelate with tungsten ions, they can work as capping agents to hinder the particle growth. In the HR-TEM image of WO2.72/RGO-5, WO2.72 particles of 5–8 nm could be clearly identified (Fig. 6c), and the selected area electron diffraction patterns (Fig. 6c, inset) reveal the good crystallinity of WO2.72 particles. For a single WO2.72 particle on RGO (Fig. 6d), clear lattice-fringe spacing of 0.38 nm is measured, corresponding to the (010) planes of monoclinic WO2.72 in WO2.72/RGO composite. The TEM analysis results provide us with direct evidence on the formation of sub-10 nm WO2.72 nanoparticles on the surface of RGO sheets.
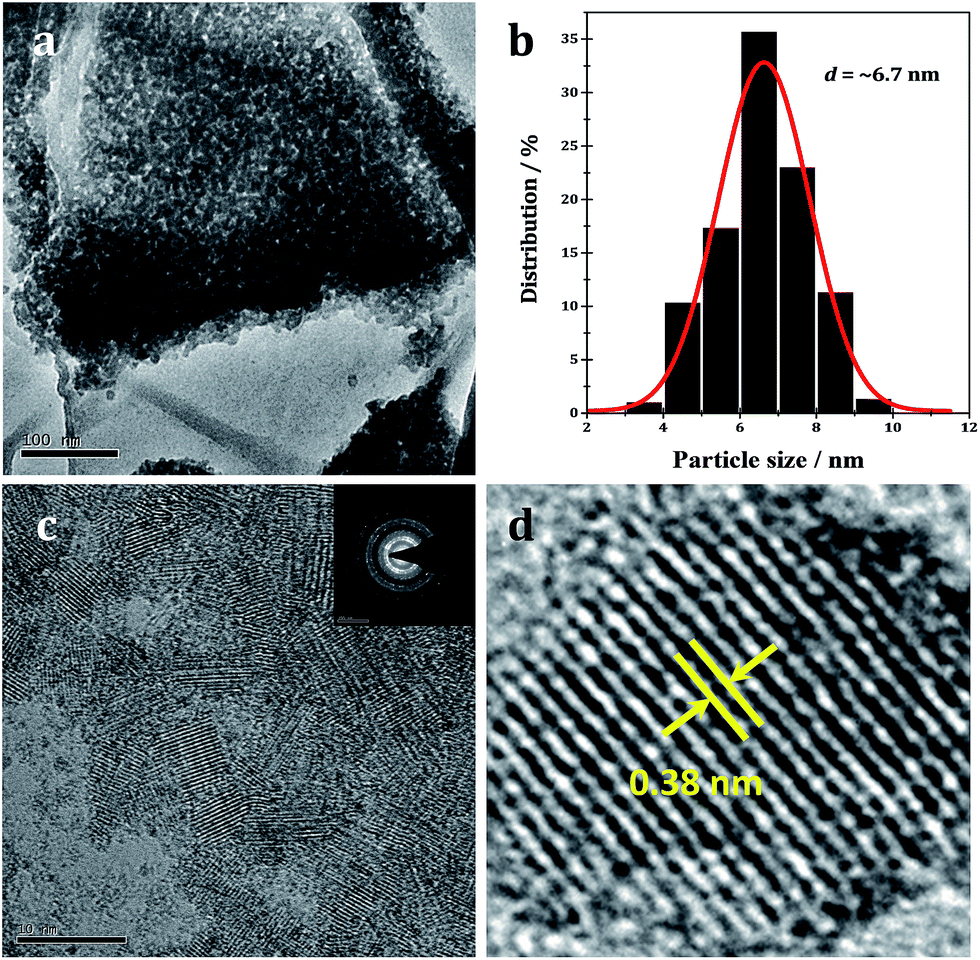 | ||
| Fig. 6 TEM image of WO2.72/RGO (a) and WO2.72 particle size distribution (b) on graphene; HR-TEM image of WO2.72/RGO with SAED patterns shown inset (c) and the enlarged view of lattice fringe (d) in a single WO2.72 nanoparticle. | ||
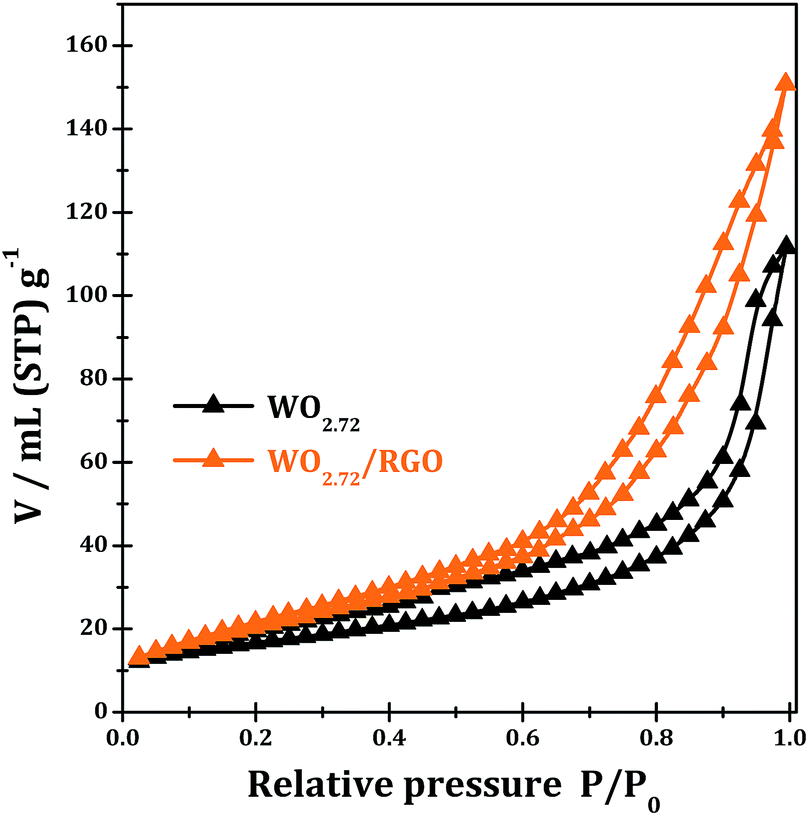
Fig. 7 shows the N2 adsorption–desorption isotherms of the samples WO2.72 and WO2.72/RGO-5. Both of the WO2.72 and WO2.72/RGO samples show similar adsorption isotherms of type IV with a hysteresis loop. The values of the BET specific surface areas of WO2.72 and WO2.72/RGO sample are calculated to be 58 and 76 m2 g−1, respectively. Obviously, the presence of RGO distinctly increases the surface area of the composite due to its intrinsic high surface area and its support effects on the dispersion of WO2.72 area.
 | ||
| Fig. 7 Nitrogen adsorption–desorption isotherms WO2.72 and WO2.72/RGO-5. | ||
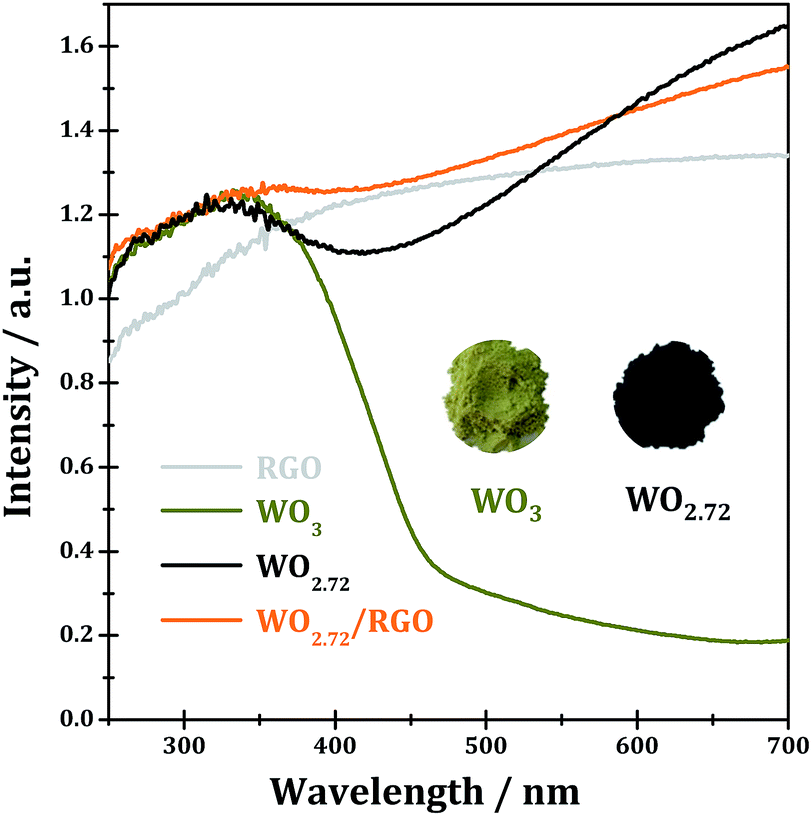
The UV-vis spectra of WO3, WO2.72, RGO and WO2.72/RGO-5 are shown in Fig. 8. Stoichiometric WO3 appears as dark yellow powder and its absorption edge occurs at ∼460 nm originated from the band-to-band transitions (band gap of 2.7 eV).3 Due to the existence of a large number of oxygen vacancies,46,47 the sub-stoichiometric WO2.72 appears as black powder and it shows a broad absorption in the entire UV-vis region (200–700 nm), which should be due to the formation of new discrete energy bands below the conduction band. Under such circumstances, it is impossible to calculate the band gap of WO2.72 by using Kubelka–Munk equation, which is commonly employed in the literature.48–50 While for WO2.72/RGO composite, light absorption in the entire UV-vis region could be observed, similar to the case of WO2.72. It can be expected from UV-vis spectra that WO2.72 and WO2.72/RGO composite might be good photocatalysts under UV-vis light.
 | ||
| Fig. 8 UV-vis spectra of RGO, WO3, WO2.72 and WO2.72/RGO-5. | ||
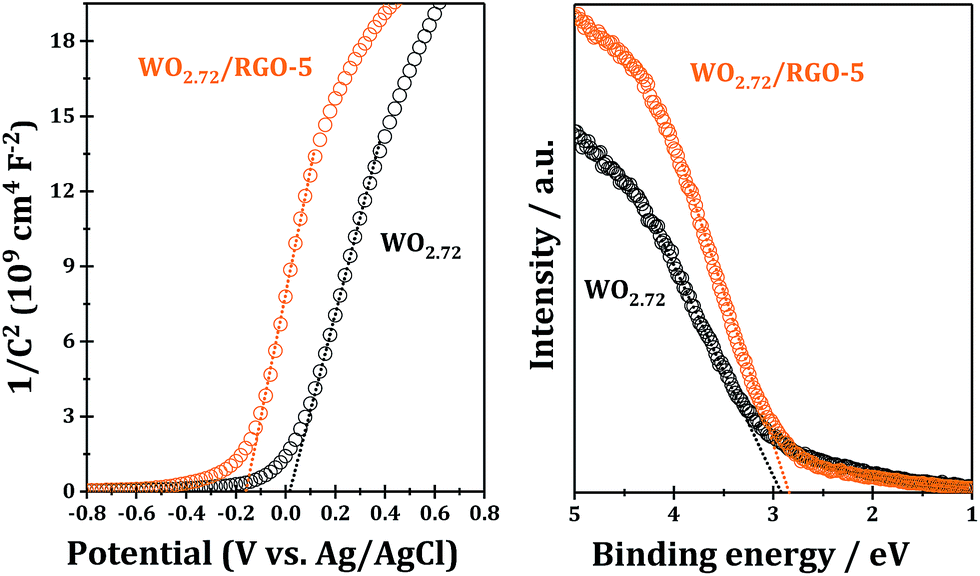
For further information on the band edge positions of WO2.72 and WO2.72/RGO composite, UPS and Mott–Schottky plots were performed, as shown Fig. 9. The Mott–Schottky plots of samples show positive slopes corresponding to n-type semiconductors, and, under such circumstances, the conduction band potential is very close to the flat-band potential, which can be obtained from the x intercept of the linear region in Mott–Schottky plots. The calculated conduction band bottoms of WO2.72 of WO2.72/RGO-5 are 0.22 and 0.04 eV, respectively, versus normal hydrogen electrode (Fig. 9; left chart). From UPS, the valence band tops of WO2.72 and WO2.72/RGO-5 are determined to be 2.83 and 2.92 eV, respectively, versus normal hydrogen electrode (Fig. 9; right chart). On the basis of the results from Mott–Schottky and UPS analysis, the band gaps of WO2.72 and WO2.72/RGO-5 are calculated to be 2.61 and 2.88 eV, respectively. Obviously, compositing with RGO results in a noticeable change in the band structure of WO2.72. Considering its band gap and band edge positions, the as-fabricated WO2.72/RGO-5 should be promising photocatalyst in photocatalytic oxidation reactions under UV light.
 | ||
| Fig. 9 Mott–Schottky plots and UPS of WO2.72/RGO-5 sample. | ||
The light harvesting properties of WO2.72 and WO2.72/RGO composites are investigated in two typical photocatalytic reactions, i.e. oxygen evolution from water splitting and selective oxidation of benzyl alcohol.
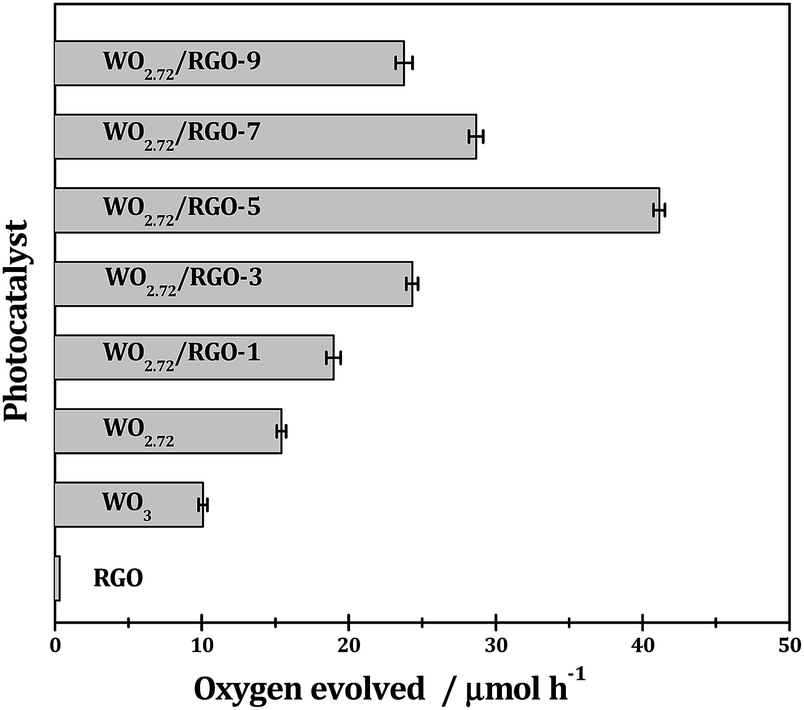
As shown in Fig. 10, with AgNO3 as sacrificial reagent, oxygen evolution from water splitting could be achieved with tungsten oxides semiconductors under irradiation. The sub-10 nm tungsten oxides employed in this study should be more active than their bulk counterparts because smaller particle size generally means easier transfer of charge-carrier and higher photocatalytic efficiency. With similar particle size, the sub-stoichiometric WO2.72 (oxygen evolution rate: 151 μmol g h−1) is more active than stoichiometric WO3 (oxygen evolution rate: 98 μmol g h−1) under UV-vis light since the recombination of photogenerated electron–hole pairs can be effectively suppressed upon the introduction of oxygen vacancies.35 RGO exhibits neglectable activity in the photocatalytic oxygen evolution, however, it can significantly promote the photocatalytic oxygen evolution when compositing with WO2.72. The promotion effects of RGO are very much dependent on its weight loading and a volcano-shaped curve is observed. Typically, 5% weight load of RGO in WO2.72/RGO is optimized and an oxygen evolution of 420 μmol g h−1 is obtained for WO2.72/RGO-5, which is about 2.8 times higher than WO2.72.
 | ||
| Fig. 10 Photocatalytic O2 evolution from water splitting over different samples under UV-vis light. Reaction conditions: 0.1 g photocatalyst; 0.2 g AgNO3 in 100 mL pure water; T = 298 K. | ||
With suitable incident photons, electron–hole pairs can be created in WO2.72, followed by the separation and migration of photo-generated electrons and holes to the solid–solution interface. The photo-generated holes can oxidize water to oxygen at the interface, while the photo-generated electron cannot reduce water to hydrogen owing to the insufficient positive conduction band position of WO2.72.51 With the presence of Ag+ in the reaction system, the photo-generated electrons can reduce Ag+ to Ag at the interface, which close the cycle and initiate the photocatalytic reaction, i.e. oxygen evolution from water splitting with Ag+ ions as sacrificial reagents. RGO, similar to graphene, is known as a very good electron conductor. When compositing with WO2.72, RGO can efficiently transfer the photo-generated electrons away from the WO2.72 to react with electron acceptor Ag+, leaving the photo-generated holes on WO2.72 to oxidize water to oxygen. In such a way, the presence of RGO support can efficiently suppress the recombination of photo-generated electrons and holes, and, therefore, promote the photocatalytic activity.24 Increasing the loading of RGO in WO2.72/RGO should facilitate the transfer of photo-generated electrons, however, it would also reduce the light absorbance due to the light shielding effect of RGO.52,53 As a balance of these two factors, an optimized RGO loading of 5% is obtained for efficient oxygen evolution.
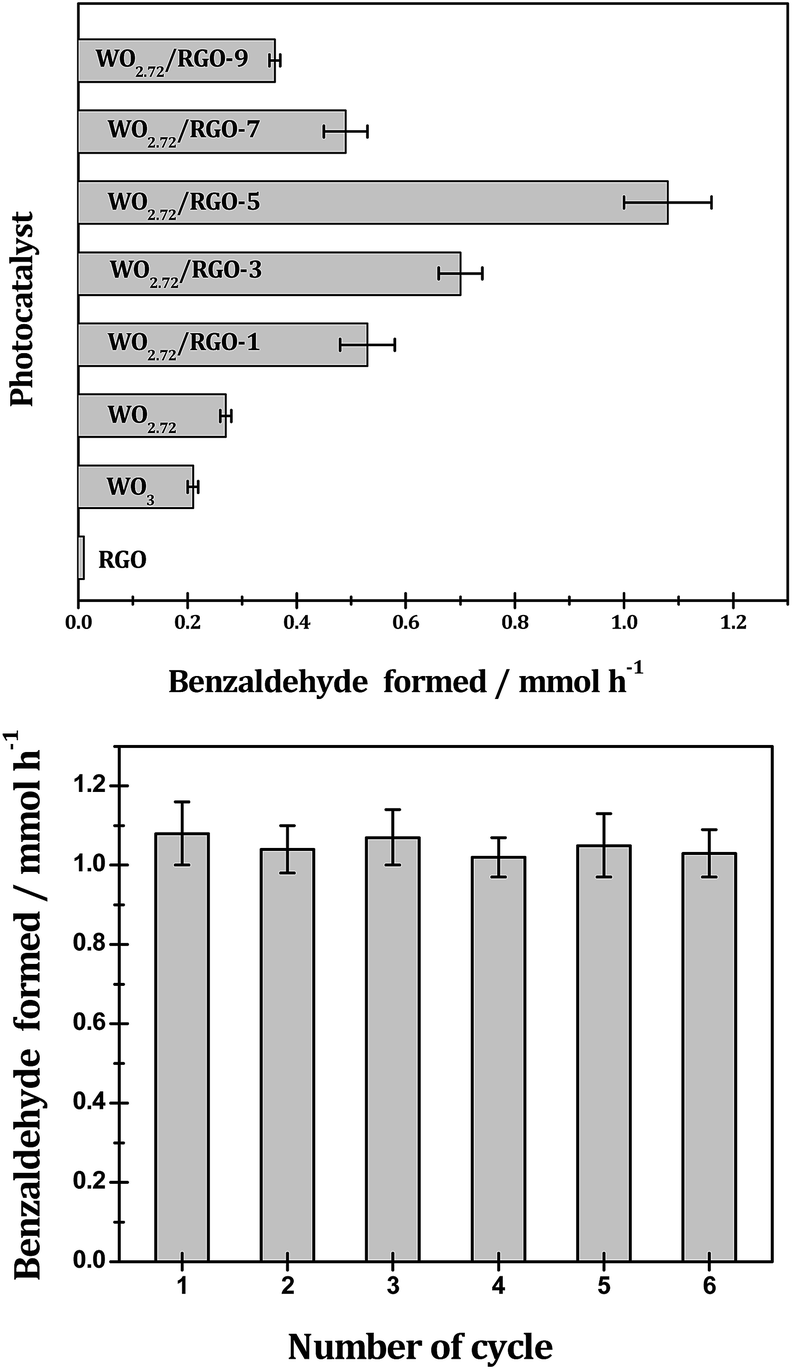
The photocatalytic performance of the WO3, WO2.72 and WO2.72/RGO composites are further evaluated in the photocatalytic oxidation benzyl alcohol, and the results are showed in Fig. 11. The selective photocatalytic oxidation of benzyl alcohol can be achieved on all WO2.72-based catalysts with 91% selectivity toward benzaldehyde (small quantities pf benzoic acid and benzyl benzoate detected as dominating by-products, Table 1). Similar to those observed in the photocatalytic oxygen evolution (Fig. 10), the sub-stoichiometric WO2.72 is exhibits slightly higher photocatalytic activity in benzyl alcohol selective oxidation than stoichiometric WO3, and the presence of RGO support can enhance the photocatalytic activity of WO2.72 to a great extent. Typically, WO2.72/RGO-5 exhibits the highest photocatalytic activity with a benzyl alcohol conversion rate of 10.8 mmol gcat−1 h−1, four times higher than WO2.72 (2.7 mmol gcat−1 h−1). The apparent QY for benzyl alcohol photocatalytic oxidation over WO2.72/RGO-5 is calculated to be as high as 68.9% under monochromatic UV light at 350 nm. In addition to its remarkable photocatalytic activity, WO2.72/RGO-5 exhibits good stability in the oxidation of benzyl alcohol. As shown in Fig. 11, no obvious activity loss can be observed in five recycling tests, demonstrating its great potential in practical application.
 | ||
| Fig. 11 Photocatalytic oxidation of benzyl alcohol to benzaldehyde over different samples under UV-vis light and the recycling test of WO2.72/RGO-5 sample. Reaction conditions: 0.1 g photocatalyst; 25 mmol benzyl alcohol in 60 mL benzotrifluoride as solvent; T = 298 K. | ||
| Photocatalyst | Product selectivity (%) | C balance (%) | ||
|---|---|---|---|---|
| Benzaldehyde | Benzoic acid | Benzyl benzoate | ||
| a Reaction conditions: 0.1 g photocatalyst, 25 mmol benzyl alcohol in 60 mL benzotrifluoride as solvent, T = 298 K, reaction time = 8 h. | ||||
| WO3 | 79 | 6 | 15 | 91 |
| WO2.72 | 91 | 4 | 5 | 94 |
| WO2.72/RGO-1 | 94 | 2 | 4 | 93 |
| WO2.72/RGO-3 | 91 | 5 | 4 | 95 |
| WO2.72/RGO-5 | 92 | 4 | 4 | 92 |
| WO2.72/RGO-7 | 93 | 3 | 4 | 91 |
| WO2.72/RGO-9 | 92 | 3 | 5 | 92 |
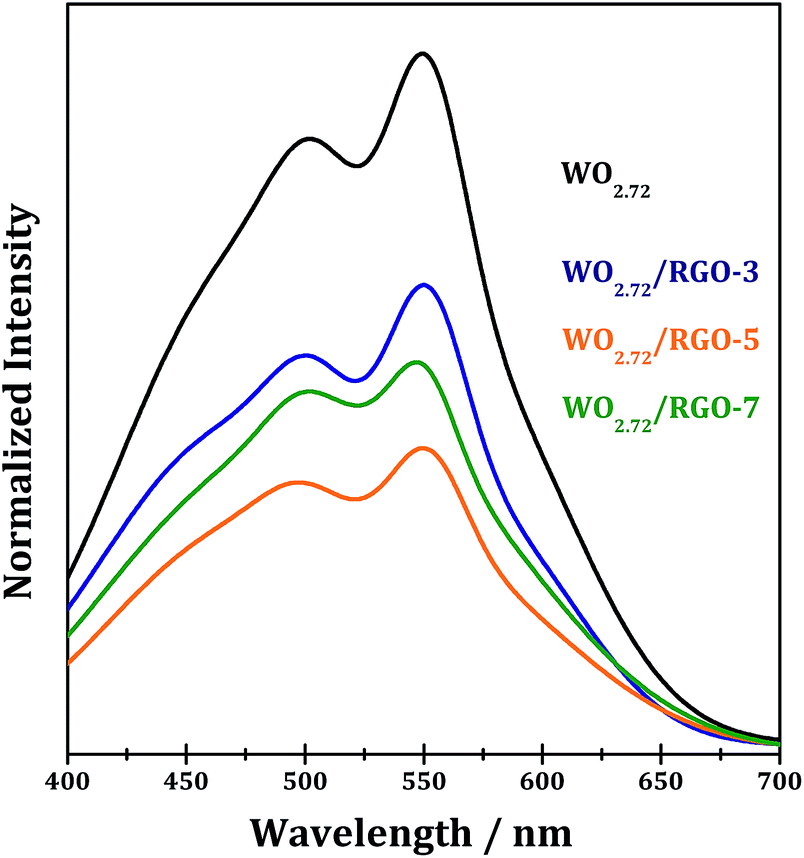
PL spectroscopy is very useful to disclose the efficiency of charge carrier trapping, immigration and transfer in semiconductor materials. Generally, the PL emissions are originated from the radiative recombination of photogenerated electrons and holes. Room temperature emission PL spectra of WO2.72 and WO2.72/RGO samples are measured and shown in Fig. 12. For all samples, PL signals at the wavelength of 400–700 nm are observed, due to the surface and bulk irradiative recombination.54,55 It is observed that compositing with RGO significantly decreases the PL intensity of WO2.72, confirming the role of RGO in promoting the separation of photogenerated electron–hole pairs on WO2.72. For WO2.72/RGO composites with different RGO loadings, the normalized PL intensity are relevant with the photocatalytic activity (Fig. 10 and 11). That is, the lower PL intensity, the higher photocatalytic intensity.
 | ||
| Fig. 12 PL spectra of WO2.72 and WO2.72/RGO composites. | ||
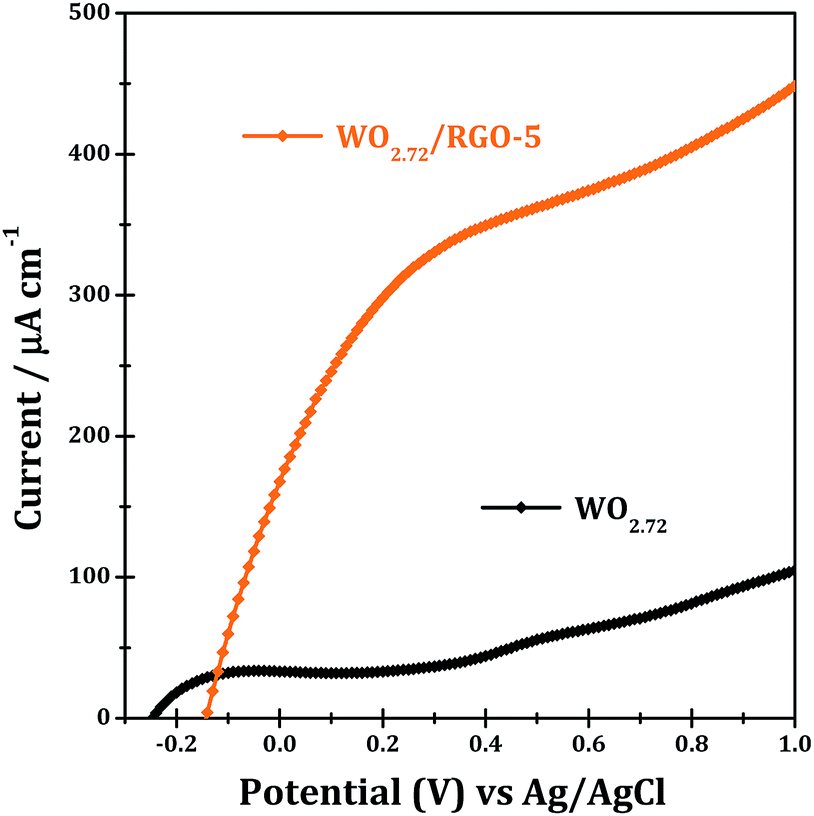
The light harvesting properties of WO2.72 and WO2.72/RGO-5 are finally examined by means of photocurrent responses, and the results are shown in Fig. 13. Pure WO2.72 show significant current responses at bias of 0.2–1.0 eV (vs. Ag/AgCl) under UV-vis light. WO2.72/RGO-5 shows significant current responses at bias of −0.1–1.0 eV, which are several times higher than WO2.72. The presence of 5% RGO support can greatly improve the separation of photo-generated electrons and holes, and accordingly lead to enhanced photocurrent responses (Fig. 13) and photocatalytic activity in different reactions (Fig. 10 and 11).
 | ||
| Fig. 13 Photocurrent responses of WO2.72 and WO2.72/RGO-5 under UV-vis light. | ||
Conclusions
In this study, sub-10 nm WO2.72 particles have been prepared via a controllable alcoholysis route followed by thermal treatment under inert atmosphere. With the in situ addition of GO solution, WO2.72/RGO nano-composites containing WO2.72 nanoparticles and RGO nanosheets in close contact can be successfully fabricated. This is a very simple and reproducible strategy that can be extended to other nano-composite systems.The as-prepared WO2.72/RGO nano-composites with different RGO loadings are well characterized by a series of techniques and applied as photocatalysts in two typical reactions, i.e. oxygen evolution from water splitting and selective oxidation of benzyl alcohol. With the existence of RGO support as a good electron conductor, the photo-generated electrons on WO2.72 can be transferred to RGO, and, therefore, the recombination of photo-generated electrons and holes can be suppressed to a great extent. Accordingly, WO2.72/RGO nano-composites exhibit greatly enhanced photocatalytic activity than pristine WO2.72 in both the oxygen evolution from water splitting and selective oxidation of benzyl alcohol. The promotion effects of RGO support are dependent on RGO loadings and the optimized RGO loading is determined to be 5% in WO2.72/RGO nano-composite. For WO2.72/RGO with RGO weight loading of 5%, oxygen evolution rate of 420 μmol g h−1 and benzyl alcohol oxidation rate of 10.8 mmol gcat−1 h−1 can be obtained under UV-vis light, namely 2.8 and 4.0 times higher than pristine WO2.72 nanoparticles, respectively. The concept of using RGO as a support with good electron conducting properties should be a general strategy to the fabrication of efficient compositing photocatalysts.
Acknowledgements
This work is financially supported by the National High Technology Research and Development Program of China (2015AA033303), the National Natural Science Foundation of China (21421001 and 21303087), Municipal Natural Science Foundation of Tianjin (13RCGFGX01124, 13JCQNJC05900 and 14JCQNJC05700), and the Ministry of Education of China (IRT13022).Notes and references
- A. Fujishima, Nature, 1972, 238, 37–38 CrossRef CAS PubMed.
- A. Kudo and Y. Miseki, Chem. Soc. Rev., 2009, 38, 253–278 RSC.
- T. Hisatomi, J. Kubota and K. Domen, Chem. Soc. Rev., 2014, 43, 7520–7535 RSC.
- S. J. A. Moniz, Energy Environ. Sci., 2015, 8, 731–759 CAS.
- L. Li, J. Yan, T. Wang, Z.-J. Zhao, J. Zhang, J. Gong and N. Guan, Nat. Commun., 2015, 6, 5881 CrossRef PubMed.
- S. Wang and X. Wang, Small, 2015, 11, 3097–3112 CrossRef CAS PubMed.
- S. Wang, W. Yao, J. Lin, Z. Ding and X. Wang, Angew. Chem., Int. Ed., 2014, 53, 1034–1038 CrossRef CAS PubMed.
- S. Wang, Z. Ding and X. Wang, Chem. Commun., 2015, 51, 1517–1519 RSC.
- S. Wang, Y. Hou and X. Wang, ACS Appl. Mater. Interfaces, 2015, 7, 4327–4335 CAS.
- S. Wang and X. Wang, Angew. Chem., Int. Ed., 2016, 55, 2308–2320 CrossRef CAS PubMed.
- D. Chen, L. Gao, A. Yasumori, K. Kuroda and Y. Sugahara, Small, 2008, 4, 1813–1822 CrossRef CAS PubMed.
- J. Yan, T. Wang, G. Wu, W. Dai, N. Guan, L. Li and J. Gong, Adv. Mater., 2015, 27, 1580–1586 CrossRef CAS PubMed.
- Z.-F. Huang, J. Song, L. Pan, F. Lv, Q. Wang, J.-J. Zou, X. Zhang and L. Wang, Chem. Commun., 2014, 50, 10959–10962 RSC.
- G. Xi, S. Ouyang, P. Li, J. Ye, Q. Ma, N. Su, H. Bai and C. Wang, Angew. Chem., Int. Ed., 2012, 51, 2395–2399 CrossRef CAS PubMed.
- D. Wang, J. Sun, X. Cao, Y. Zhu, Q. Wang, G. Wang, Y. Han, G. Lu, G. Pang and S. Feng, J. Mater. Chem. A, 2013, 1, 8653–8657 CAS.
- Z.-F. Huang, J. Song, L. Pan, X. Jia, Z. Li, J.-J. Zou, X. Zhang and L. Wang, Nanoscale, 2014, 6, 8865–8872 RSC.
- F. E. Osterloh, Chem. Soc. Rev., 2013, 42, 2294–2320 RSC.
- S. Liang, L. Wen, S. Lin, J. Bi, P. Feng, X. Fu and L. Wu, Angew. Chem., 2014, 126, 2995–2999 CrossRef.
- G. Xi, J. Ye, Q. Ma, N. Su, H. Bai and C. Wang, J. Am. Chem. Soc., 2012, 134, 6508–6511 CrossRef CAS PubMed.
- H. Bai, N. Su, W. Li, X. Zhang, Y. Yan, P. Li, S. Ouyang, J. Ye and G. Xi, J. Mater. Chem. A, 2013, 1, 6125–6129 CAS.
- P. Wu, W. Zhu, A. Wei, B. Dai, Y. Chao, C. Li, H. Li and S. Dai, Chem.–Eur. J., 2015, 21, 15421–15427 CrossRef CAS PubMed.
- F. Böttger-Hiller, R. Lungwitz, A. Seifert, M. Hietschold, M. Schlesinger, M. Mehring and S. Spange, Angew. Chem., Int. Ed., 2009, 48, 8878–8881 CrossRef PubMed.
- Y. Zhang, Y.-W. Tan, H. L. Stormer and P. Kim, Nature, 2005, 438, 201–204 CrossRef CAS PubMed.
- A. K. Geim and K. S. Novoselov, Nat. Mater., 2007, 6, 183–191 CrossRef CAS PubMed.
- M. J. Allen, V. C. Tung and R. B. Kaner, Chem. Rev., 2009, 110, 132–145 CrossRef PubMed.
- K. S. Novoselov, A. K. Geim, S. V. Morozov, D. Jiang, Y. Zhang, S. V. Dubonos, I. V. Grigorieva and A. A. Firsov, Science, 2004, 306, 666–669 CrossRef CAS PubMed.
- O. C. Compton and S. T. Nguyen, Small, 2010, 6, 711–723 CrossRef CAS PubMed.
- O. C. Compton, Z. An, K. W. Putz, B. J. Hong, B. G. Hauser, L. C. Brinson and S. T. Nguyen, Carbon, 2012, 50, 3399–3406 CrossRef CAS.
- Q. Xiang, J. Yu and M. Jaroniec, Chem. Soc. Rev., 2012, 41, 782–796 RSC.
- B. Chai, J. Li, Q. Xu and K. Dai, Mater. Lett., 2014, 120, 177–181 CrossRef CAS.
- J. Qin, M. Cao, N. Li and C. Hu, J. Mater. Chem., 2011, 21, 17167–17174 RSC.
- M. Zhou, J. Yan and P. Cui, Mater. Lett., 2012, 89, 258–261 CrossRef CAS.
- J. Guo, Y. Li, S. Zhu, Z. Chen, Q. Liu, D. Zhang, W.-J. Moon and D.-M. Song, RSC Adv., 2012, 2, 1356–1363 RSC.
- X. An, C. Y. Jimmy, Y. Wang, Y. Hu, X. Yu and G. Zhang, J. Mater. Chem., 2012, 22, 8525–8531 RSC.
- X. Li, S. Yang, J. Sun, P. He, X. Xu and G. Ding, Carbon, 2014, 78, 38–48 CrossRef CAS.
- B. Li, X. Shao, T. Liu, L. Shao and B. Zhang, Appl. Catal., B, 2016, 198, 325–333 CrossRef CAS.
- W. S. Hummers Jr and R. E. Offeman, J. Am. Chem. Soc., 1958, 80, 1339 CrossRef.
- D. C. Marcano, D. V. Kosynkin, J. M. Berlin, A. Sinitskii, Z. Sun, A. Slesarev, L. B. Alemany, W. Lu and J. M. Tour, ACS Nano, 2010, 4, 4806–4814 CrossRef CAS PubMed.
- Z.-F. Huang, J.-J. Zou, L. Pan, S. Wang, X. Zhang and L. Wang, Appl. Catal., B, 2014, 147, 167–174 CrossRef CAS.
- L. Tang, Y. Wang, Y. Li, H. Feng, J. Lu and J. Li, Adv. Funct. Mater., 2009, 19, 2782–2789 CrossRef CAS.
- D. K. Padhi and K. Parida, J. Mater. Chem. A, 2014, 2, 10300–100312 CAS.
- D. K. Padhi, K. Parida and S. K. Singh, J. Phys. Chem. C, 2015, 119, 6634–6646 CAS.
- J. Paredes, S. Villar-Rodil, A. Martínez-Alonso and J. Tascon, Langmuir, 2008, 24, 10560–10564 CrossRef CAS PubMed.
- M. Fernandez-Merino, L. Guardia, J. Paredes, S. Villar-Rodil, P. Solis-Fernandez, A. Martinez-Alonso and J. Tascon, J. Phys. Chem. C, 2010, 114, 6426–6432 CAS.
- D. Lu, J. Chen, J. Zhou, S. Deng, N. Xu and J. Xu, J. Raman Spectrosc., 2007, 38, 176–180 CrossRef CAS.
- G. Wang, H. Wang, Y. Ling, Y. Tang, X. Yang, R. C. Fitzmorris, C. Wang, J. Z. Zhang and Y. Li, Nano Lett., 2011, 11, 3026–3033 CrossRef CAS PubMed.
- T. R. Gordon, M. Cargnello, T. Paik, F. Mangolini, R. T. Weber, P. Fornasiero and C. B. Murray, J. Am. Chem. Soc., 2012, 134, 6751–6761 CrossRef CAS PubMed.
- A. E. Morales, E. S. Mora and U. Pal, Rev. Mex. Fis. S, 2007, 53, 18–22 CAS.
- D. K. Padhi, K. Parida, G. K. Pradhan and S. K. Singh, Chem. Eng. J., 2014, 255, 78–88 CrossRef CAS.
- D. K. Padhi, K. Parida and S. K. Singh, Inorg. Chem. Front., 2016, 3, 1582–1596 RSC.
- R. Abe, T. Takata, H. Sugihara and K. Domen, Chem. Commun., 2005, 3829–3831 RSC.
- H.-I. Kim, S. Kim, J.-K. Kang and W. Choi, J. Catal., 2014, 309, 49–57 CrossRef CAS.
- K. Chang, Z. Mei, T. Wang, Q. Kang, S. Ouyang and J. Ye, ACS Nano, 2014, 8, 7078–7087 CrossRef CAS PubMed.
- W. Feng, G. Wu, L. Li and N. Guan, Green Chem., 2011, 13, 3265–3272 RSC.
- J. Yan, G. Wu, N. Guan and L. Li, Appl. Catal., B, 2014, 152–153, 280–288 CrossRef CAS.
| This journal is © The Royal Society of Chemistry 2017 |