 Open Access Article
Creative Commons Attribution 3.0 Unported Licence
Fluorescein hydrazone-based supramolecular architectures, molecular recognition, sequential logic operation and cell imaging†
Kamini
Tripathi
a,
Abhishek
Rai
a,
Amarish Kumar
Yadav
b,
Saripella
Srikrishna
b,
Niraj
Kumari
*a and
Lallan
Mishra
 *a
*a
aDepartment of Chemistry, Institute of Science, Banaras Hindu University, Varanasi, India. E-mail: nirajchem@gmail.com; lmishrabhu@yahoo.co.in; Fax: +91-542-2368127; Tel: +91-542-6702449
bDepartment of Biochemistry, Institute of Science, Banaras Hindu University, Varanasi, India
First published on 12th January 2017
Abstract
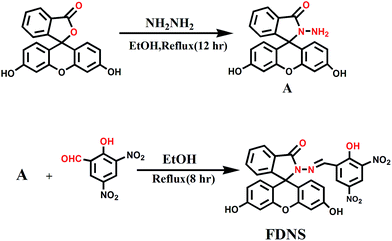
A fluorescein hydrazone (FDNS) is prepared by the coupling of fluorescein hydrazide with 3,5-dinitrosalicylaldehyde. It is well characterized using spectroscopic (IR, UV-visible, 1H, 13C NMR, ESI-MS) techniques and X-ray crystallography. FDNS is embedded with several H-bonding domains which provide interesting intra and inter molecular H-bonded networks. Its crystal packing along the b crystallographic axis using H-bonding interactions provides a fascinating helical structure. It detects Cu2+ ions selectively over many relevant ions and displays a novel peak at λmax = 495 nm. The significant enhancement in its fluorescence is observed with a peak at λem = 517 nm on addition of Hg2+ ions, which is quenched upon the addition of S2− ions. The sensing of Hg2+ ions by FDNS follow a hydrolysis pathway whereas the binding of Cu2+ ions with FDNS provides a colour change. The addition of a solution of tetrabutylammoniumcyanide in methanol to a corresponding solution of FDNS caused a turn to a green colour immediately. But on keeping the solution at room temperature for 72 h, red coloured crystals are obtained. The crystals were authenticated by X-ray crystallography. It was found to be a new compound FKCN in which a tetrabutylammonium cation is co-crystallized with deprotonated FDNS. Its supramolecular assembly via H-bonding provides an interesting ladder type architecture. FDNS displays chronological logic gate-based detection of several ions (Cu2+, Hg2+, EDTA, and S2−) at ppm levels. The real sample analysis, live cell imaging and portable paper strip based detection of Cu2+ and Hg2+ ions via an obvious colour change endows FDNS with great economic significance in recognition processes.
1. Introduction
The design and synthesis of adaptable molecules which can detect multiple analytes is of great significance as they provide the understanding of molecular interactions in recognition processes. Among several designed frameworks, fluorescein derivatives have extensively been exploited as structural scaffolds for optical probes due to their brilliant photophysical properties, such as longer absorption, emission wavelengths and large absorption coefficients.1–6 The spirolactam ring of fluorescein derivatives is a typical model for the design of molecular switches. Few interesting studies of the sensors for multiple-analytes have been reported earlier.7–14 In the area of molecular recognition, simultaneous detection of multiple ions has been the centre of attraction. In this context, toxicity of Hg2+ ions owes to its easy crossing of cell membrane barrier and warrants a simple design of its receptor. On the other hand, Cu2+ plays diverse physiological activities and its excess or scarcity leads Alzheimer's, Wilson's and Parkinson's diseases.15,16 Among the anions, cyanide and sulphide are considered very important toxicants and they are generated from several industrial sources. Therefore, a rapid method to detect multiple ions with a single optical probe accessible in environmental and biological systems is in great demand.17,18 The design of a logic device for the conversion of chemically encoded information into the optical signals has emerged as a demanding area of research.19,20In this context, it has also been observed that such designed molecular systems can display several types of supramolecular architectures if they are embedded specially with H donors and H-acceptor components. In fact, the area of crystal engineering has been enriched with several interesting organic compounds with stunning display of supramolecular architectures. The multiple hydroxyl group containing ligands have proven as perfect candidate as they know how to act as hydrogen donors and acceptors. The recognition at molecular level involves several non covalent interactions like hydrogen bonding, CH–π interaction as well as π–π stacking together with hydrophobic forces.21 The fluorescein dye and its derivatives richly embedded with several H-bonding domains are considered appropriate organic compounds for the construction of different type of supramolecular structures. In the present context, 3,5-dinitrosalicylaldehyde was selected as a coupling component as it was anticipated to impart the fluorescence enhancement of overall framework as compared to earlier used 5-nitrosalicylaldehyde.22
Thus, based on the above precedence, fluorescein hydrazide condensed with 3,5-dinitrosalicylaldehyde provided the desired compound (FDNS) which is characterized using full battery of physico chemical techniques and X-ray crystallography. As anticipated, it was empowered with the discriminatory recognition of Cu2+ and Hg2+ ions and it's FDNS–Cu2+ adduct acted as secondary sensor of CN− ions. The H-bonding components embedded on its skeleton, enable the formation of intra and intermolecular interactions. These interactions lead interesting supramolecular assembly and provide helical structure. It also acts as a module for computing sequential logic operations.
2. Experimental
2.1. Materials and methods
All chemicals were obtained from industrial sources. The CE-440 Elemental analyzer is used for elemental analyses of C, H, and N. Varian 3300 FT-IR and Shimadzu UV-1601 were used for recording their IR and UV-visible spectra, respectively. 1H (500 MHz) and 13C (100 MHz) NMR spectra were recorded via JEOL AL500 FT-NMR spectrometer. Perkin Elmer Fluorescence spectrophotometer is used for the measurement of fluorescence spectrum in aqueous![[thin space (1/6-em)]](https://www.rsc.org/images/entities/char_2009.gif) :
:![[thin space (1/6-em)]](https://www.rsc.org/images/entities/char_2009.gif) MeOH (8
MeOH (8![[thin space (1/6-em)]](https://www.rsc.org/images/entities/char_2009.gif) :
:![[thin space (1/6-em)]](https://www.rsc.org/images/entities/char_2009.gif) 2, v/v, HEPES buffer (1 mM), pH 7.4) at room temperature. ESI-MS was obtained using a mass spectrophotometer of made WATERS Q-TOF Premier-HAB213. The yellow crystals of FDNS were obtained through slow evaporation of its solution in DMSO at room temperature. X-ray diffraction data were collected using Oxford diffraction XCALIBUR-EOS diffractometer with monochromated Mo Kα radiation (λ = 0.71073 Å). The data were solved by using SHELXS-97 Program23 whereas they were refined by full matrix least squares SHELXL-97.24
2, v/v, HEPES buffer (1 mM), pH 7.4) at room temperature. ESI-MS was obtained using a mass spectrophotometer of made WATERS Q-TOF Premier-HAB213. The yellow crystals of FDNS were obtained through slow evaporation of its solution in DMSO at room temperature. X-ray diffraction data were collected using Oxford diffraction XCALIBUR-EOS diffractometer with monochromated Mo Kα radiation (λ = 0.71073 Å). The data were solved by using SHELXS-97 Program23 whereas they were refined by full matrix least squares SHELXL-97.24
2.2. Synthesis
The fluorescein hydrazone (FDNS) is synthesized by refluxing fluorescein hydrazide (0.345 g, 1 mmol) and 3,5-dinitrosalicylaldehyde (0.21 g, 1.1 mmol) in absolute ethanol (20 mL), on water bath for 8 h, under N2 atmosphere. A yellow precipitate was obtained, which was filtered and washed with ethanol to give desired fluorescein hydrazone (FDNS) in 75% yields (Scheme 1). The yellow colour crystals of FDNS were developed by the slow evaporation of a solution of FDNS in DMSO at room temperature. Mp > 200 °C; FT-IR (KBr, cm−1): 3333 (OH), 3082 (Ar-H), 1696 (C![[double bond, length as m-dash]](https://www.rsc.org/images/entities/char_e001.gif) O), 1609 (C
O), 1609 (C![[double bond, length as m-dash]](https://www.rsc.org/images/entities/char_e001.gif) N), 1262 (C–O); 1H NMR (500 MHz, DMSO-d6): δ 9.93 (s, 1H, OH), 9.03(s, CH
N), 1262 (C–O); 1H NMR (500 MHz, DMSO-d6): δ 9.93 (s, 1H, OH), 9.03(s, CH![[double bond, length as m-dash]](https://www.rsc.org/images/entities/char_e001.gif) N, 1H), 8.64 (bs, 1H), 8.54 (bs, 1H), 7.97 (d, 1H, J = 8.0 Hz), 7.63 (m, 2H), 7.14 (d, 2H, J = 7.5 Hz), 6.69 (s, 2H), 6.55 (d, 2H, J = 8.5), 6.47 (d, 2H, J = 10.5); 13C NMR (100 MHz, DMSO-d6): 182.35, 174.19, 168.47, 165.67, 164.05, 158.74, 153.99, 147.35, 152.27, 145.40, 138.41, 135.20, 130.69, 123.69, 122.90, 113.10, 110.20, 104.10, 98.31, 65.01, 51.69; EI-MS m/z 541.1003; elemental analysis (calcd%) for C27H16N4O9: C, 60.00; H, 2.98; N, 10.37; found C, 59.91; H, 2.90; N, 10.17.
N, 1H), 8.64 (bs, 1H), 8.54 (bs, 1H), 7.97 (d, 1H, J = 8.0 Hz), 7.63 (m, 2H), 7.14 (d, 2H, J = 7.5 Hz), 6.69 (s, 2H), 6.55 (d, 2H, J = 8.5), 6.47 (d, 2H, J = 10.5); 13C NMR (100 MHz, DMSO-d6): 182.35, 174.19, 168.47, 165.67, 164.05, 158.74, 153.99, 147.35, 152.27, 145.40, 138.41, 135.20, 130.69, 123.69, 122.90, 113.10, 110.20, 104.10, 98.31, 65.01, 51.69; EI-MS m/z 541.1003; elemental analysis (calcd%) for C27H16N4O9: C, 60.00; H, 2.98; N, 10.37; found C, 59.91; H, 2.90; N, 10.17.
FKCN was synthesized by the addition of excess solution of tetrabutylammoniumcyanide to a solution of FDNS in methanol containing copper nitrate solution in methanol. Red colour crystals suitable for X-ray measurement were obtained. Mp > 200 °C; FT-IR (KBr, cm−1): 3303 (OH), 2963–2873 (aliphatic-H), 1702 (C![[double bond, length as m-dash]](https://www.rsc.org/images/entities/char_e001.gif) O), 1602 (C
O), 1602 (C![[double bond, length as m-dash]](https://www.rsc.org/images/entities/char_e001.gif) N), 1263 (C–O); 1H NMR (500 MHz, DMSO-d6): δ 9.91 (s, 1H, OH), 8.81 (s, CH
N), 1263 (C–O); 1H NMR (500 MHz, DMSO-d6): δ 9.91 (s, 1H, OH), 8.81 (s, CH![[double bond, length as m-dash]](https://www.rsc.org/images/entities/char_e001.gif) N, 1H), 8.47 (s, 1H, Ar), 8.14 (s, 1H, Ar), 7.88 (s, 1H, Ar), 7.54 (m, 2H, Ar), 7.05 (d, 1H, Ar), 6.64 (s, 1H, Ar), 6.47 (m, 2H, Ar), 6.43 (m, 2H, Ar), 3.16 (m, 8H, CH2), 1.55 (m, 8H, CH2), 1.31 (m, 8H, CH2), 0.92 (m, 12H, CH3); 13C NMR (DMSO-d6): 194.61, 163.64, 158.52, 151.90, 151.28, 145.04, 138.00, 133.83, 128.48, 127.61, 122.76, 112.36, 109.83, 102.70, 64.84, 23.06, 19.21, 13.49.
N, 1H), 8.47 (s, 1H, Ar), 8.14 (s, 1H, Ar), 7.88 (s, 1H, Ar), 7.54 (m, 2H, Ar), 7.05 (d, 1H, Ar), 6.64 (s, 1H, Ar), 6.47 (m, 2H, Ar), 6.43 (m, 2H, Ar), 3.16 (m, 8H, CH2), 1.55 (m, 8H, CH2), 1.31 (m, 8H, CH2), 0.92 (m, 12H, CH3); 13C NMR (DMSO-d6): 194.61, 163.64, 158.52, 151.90, 151.28, 145.04, 138.00, 133.83, 128.48, 127.61, 122.76, 112.36, 109.83, 102.70, 64.84, 23.06, 19.21, 13.49.
2.3. Determination of binding constants
The binding constant of the formation of Cu2+/Hg2+ complexes were evaluated using Benesi–Hildebrand (B–H) plot (eqn (1)).25| 1/(A − A0) = 1/{K(Amax − A0)C} + 1/(Amax − A0) | (1) |
The symbol A0 and A corresponds to absorbance of FDNS at λmax = 554 nm and absorbance observed at a particular concentration of the metal ion (C), whereas Amax is obtained at λmax = 495 nm, respectively. The apparent binding constant K (M−1), is calculated from the slope of the linear plot.
2.4. Method for spectroscopic investigation
The stock solution of FDNS (1 × 10⁻⁵ M) was prepared in aqueous![[thin space (1/6-em)]](https://www.rsc.org/images/entities/char_2009.gif) :
:![[thin space (1/6-em)]](https://www.rsc.org/images/entities/char_2009.gif) MeOH (8
MeOH (8![[thin space (1/6-em)]](https://www.rsc.org/images/entities/char_2009.gif) :
:![[thin space (1/6-em)]](https://www.rsc.org/images/entities/char_2009.gif) 2 v/v) solution and solutions of metal ions (1 × 10⁻² M) were prepared using their nitrate salts in water. A solution of tetrabutylammoniumcyanide (1 × 10⁻² M) was prepared in distilled water. Before UV-visible and fluorescence measurements all samples were equilibrated for 1 min.
2 v/v) solution and solutions of metal ions (1 × 10⁻² M) were prepared using their nitrate salts in water. A solution of tetrabutylammoniumcyanide (1 × 10⁻² M) was prepared in distilled water. Before UV-visible and fluorescence measurements all samples were equilibrated for 1 min.
2.5. Real sample analysis of Cu2+ and Hg2+ ions
The three water samples (river, pond and lake) were used to prepare the required samples after filtration. All the water samples (3.0 mL) were spiked independently with different concentrations (0–10 μM) of Cu2+ and Hg2+ ions followed by the addition of FDNS (10 μM) to corresponding solutions.2.6. Detection limit
The limit of detection was evaluated by means of UV-visible and florescence titrations. The absorption and emission spectrum of FDNS was measured at 10 times, and the standard deviation of blank measurement was achieved. The graph of the UV-visible absorbance at λmax = 495 nm and florescence λmax = 517 nm was plotted repetitively vs. the concentration of Cu2+ and Hg2+ ions to get the slope. The limit of detection was calculated using equation LOD = 3σ/k where σ is standard deviation of blank measurement.262.7. Cell culture, compound treatments and fluorescence imaging
Cervical cancer cell lines (ME-180) obtained from National Centre for Cell Science (NCCS), Pune, India, were cultured in Dulbecco's modified Eagle's medium (DMEM, HiMedia) supplemented with 10% FBS and 1× antibiotic cocktail in CO2 incubator at 37 °C. For cell imaging experiment, the cultured cells were washed with 1× PBS followed by trypsinization for 2 min and collected in Eppendorf tube. Cells were incubated with FDNS (10 μM) for 45 min at room temperature and in other set, cells were initially treated with FDNS (10 μM) for 30 min followed by addition of Hg2+ (50 μM) for 15 min, while control set was treated with solvent alone (methanol and water in 1![[thin space (1/6-em)]](https://www.rsc.org/images/entities/char_2009.gif) :
:![[thin space (1/6-em)]](https://www.rsc.org/images/entities/char_2009.gif) 9 ratio). After incubation, cells were centrifuged at 2000 rpm for 1 min and washed twice with 1× PBS for 2 min each. Cells were mounted in 1× PBS and images were captured with Nikon Ni-U fluorescence microscope using FITC filter-Ex-465-496, DM 505, BA 515-555. Fluorescence intensity was measured using Nikon-NIS-element BR software.
9 ratio). After incubation, cells were centrifuged at 2000 rpm for 1 min and washed twice with 1× PBS for 2 min each. Cells were mounted in 1× PBS and images were captured with Nikon Ni-U fluorescence microscope using FITC filter-Ex-465-496, DM 505, BA 515-555. Fluorescence intensity was measured using Nikon-NIS-element BR software.
3. Results and discussion
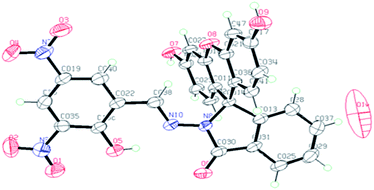
The compound FDNS is characterized by IR, 1H NMR, 13C NMR, ESI-MS spectral data and elemental analysis. Its structure was further legitimate by X-ray crystallography and molecular structure (ORTEP diagram) is depicted in Fig. 1.IR spectrum of FDNS displays a distinct peak at ν 1609 cm−1 assigned to ν(HC![[double bond, length as m-dash]](https://www.rsc.org/images/entities/char_e001.gif) N) stretching vibration (Fig. S1†). Its 1H and 13C NMR spectrum are shown in Fig. S2 and S3† respectively and supports the existence of CH
N) stretching vibration (Fig. S1†). Its 1H and 13C NMR spectrum are shown in Fig. S2 and S3† respectively and supports the existence of CH![[double bond, length as m-dash]](https://www.rsc.org/images/entities/char_e001.gif) N group at δ 9.04 ppm in solution. ESI-MS also supports the formation of FDNS with the peak at m/z 541.1003 corresponding to [FDNS + H]+ (Fig. S4†). Appearance of a peak at δ 65.01 ppm for spiro carbon in its 13C NMR spectrum supported the presence of spiro-cyclic ring in its structure.27 The UV-visible spectrum of FDNS showed peak at λmax = 401 nm (ε = 25
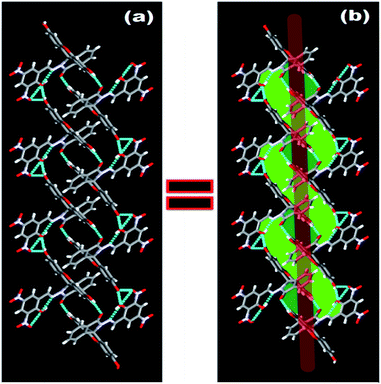
N group at δ 9.04 ppm in solution. ESI-MS also supports the formation of FDNS with the peak at m/z 541.1003 corresponding to [FDNS + H]+ (Fig. S4†). Appearance of a peak at δ 65.01 ppm for spiro carbon in its 13C NMR spectrum supported the presence of spiro-cyclic ring in its structure.27 The UV-visible spectrum of FDNS showed peak at λmax = 401 nm (ε = 25![[thin space (1/6-em)]](https://www.rsc.org/images/entities/char_2009.gif) 800 M−1 cm−1) designated to intra-molecular charge transfer transition. Some structural parameters are presented in Table S1† whereas the selected bond distances (Å) and bond angles (deg) were presented in Table S2.† The selected parameters for weak interactions are listed as Table S3.† It is quite interesting to visualise the molecule FDNS as a typical paddle-wheel type structure, having a dihedral angle of 85.62° between two coordination planes (Fig. 2a). An intramolecular hydrogen bond formation between O5–H006⋯N10 could be seen as depicted in Fig. 2b. It provides a six-membered pseudo-ring consisting of N10–C038–C032–C16C–O5–H006 system. The bond distance between H006⋯N10 is found as 1.814 Å with a bond angle of 147.17° between O5–H006⋯N10. The molecule is associated through two type of intermolecular H-bond formation (Fig. 2c). One bond is formed between –OH (O9–H007) of one molecule and one of the nitro groups (O2–N3–O1) of another molecule of FDNS. The second intermolecular H-bond is formed between carbonyl group (C030–O6) of one FDNS molecule with a hydroxyl group (H003⋯O7) of other FDNS. A weaker aromatic stacking interaction between xanthene moieties of two FDNS molecules also occur at interplanar separation of 4.25 Å as depicted in (Fig. 2d). The hydrogen bondings played significant role in the construction of supramolecular architecture propagating along different crystallographic axes. The packing structure of FDNS shows three different structures along three different axes. Along ‘a’ axis, it looks like a series of incandescent body connected via a single wire (Fig. S5†), whereas along ‘b’ as a double helical structure (Fig. 3) and along ‘c’ axis as a H-shaped structure (Fig. S6†).
800 M−1 cm−1) designated to intra-molecular charge transfer transition. Some structural parameters are presented in Table S1† whereas the selected bond distances (Å) and bond angles (deg) were presented in Table S2.† The selected parameters for weak interactions are listed as Table S3.† It is quite interesting to visualise the molecule FDNS as a typical paddle-wheel type structure, having a dihedral angle of 85.62° between two coordination planes (Fig. 2a). An intramolecular hydrogen bond formation between O5–H006⋯N10 could be seen as depicted in Fig. 2b. It provides a six-membered pseudo-ring consisting of N10–C038–C032–C16C–O5–H006 system. The bond distance between H006⋯N10 is found as 1.814 Å with a bond angle of 147.17° between O5–H006⋯N10. The molecule is associated through two type of intermolecular H-bond formation (Fig. 2c). One bond is formed between –OH (O9–H007) of one molecule and one of the nitro groups (O2–N3–O1) of another molecule of FDNS. The second intermolecular H-bond is formed between carbonyl group (C030–O6) of one FDNS molecule with a hydroxyl group (H003⋯O7) of other FDNS. A weaker aromatic stacking interaction between xanthene moieties of two FDNS molecules also occur at interplanar separation of 4.25 Å as depicted in (Fig. 2d). The hydrogen bondings played significant role in the construction of supramolecular architecture propagating along different crystallographic axes. The packing structure of FDNS shows three different structures along three different axes. Along ‘a’ axis, it looks like a series of incandescent body connected via a single wire (Fig. S5†), whereas along ‘b’ as a double helical structure (Fig. 3) and along ‘c’ axis as a H-shaped structure (Fig. S6†).
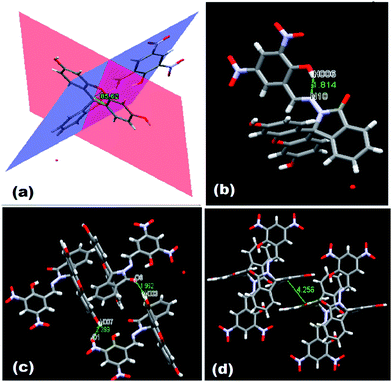 | ||
| Fig. 2 Different structures of FDNS (a) paddle wheel structure (b) intra molecular H-bonding, (c) inter molecular H-bonding, and (d) π–π stacking interaction. | ||
3.1. Spectral recognition of Cu2+ and Hg2+ by FDNS
Binding of several cations with FDNS were checked by adding their excess solution (10.0 eq.) separately to a solution of FDNS (10−5 M, aqueous![[thin space (1/6-em)]](https://www.rsc.org/images/entities/char_2009.gif) :
:![[thin space (1/6-em)]](https://www.rsc.org/images/entities/char_2009.gif) MeOH, 8
MeOH, 8![[thin space (1/6-em)]](https://www.rsc.org/images/entities/char_2009.gif) :
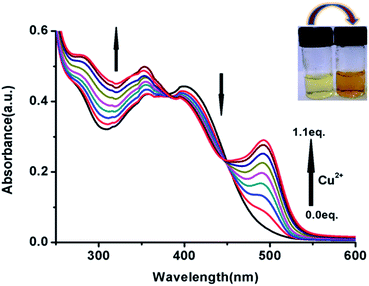
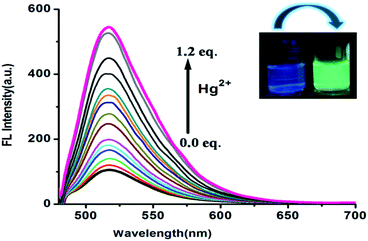
:![[thin space (1/6-em)]](https://www.rsc.org/images/entities/char_2009.gif) 2 v/v, HEPES buffer (1 mM), pH 7.4) (Fig. S7†). On addition of a fixed amount (10.0 equiv.) of Cu2+ ions to the FDNS, a momentous enrichment in absorbance at λmax = 495 nm was observed with a concomitant disappearance of the band at λmax = 401 nm. It induces a clear colour change of FDNS solution from a yellow to light brown. However, the addition of other competitive metal ions (Li+, Hg2+, Ca2+, Cd2+, Fe3+, Na+, Al3+, Zn2+, Pb2+, Mg2+, Cu2+, Co2+, Ni2+, and Ag+ ions) did not show any considerable colour change and spectral variation under the same conditions. It suggested a high selectivity of FDNS toward Cu2+ ions (Fig. S8†). The fluorescence response of FDNS with different cations was also studied as depicted in Fig. S9.† The non fluorescent FDNS did not show any distinct change in its emission pattern on the addition Cu2+ ions. However, under the similar condition, a passionate fluorescence enhancement in presence of excess Hg2+ ions was observed with a peak at λem = 517 nm. It could be ascribed to the combinatorial effect of ring opening of FDNS and chelation of Hg2+ ions to it. The spectral pattern remains unbothered on the addition of several other competing metal ions.
2 v/v, HEPES buffer (1 mM), pH 7.4) (Fig. S7†). On addition of a fixed amount (10.0 equiv.) of Cu2+ ions to the FDNS, a momentous enrichment in absorbance at λmax = 495 nm was observed with a concomitant disappearance of the band at λmax = 401 nm. It induces a clear colour change of FDNS solution from a yellow to light brown. However, the addition of other competitive metal ions (Li+, Hg2+, Ca2+, Cd2+, Fe3+, Na+, Al3+, Zn2+, Pb2+, Mg2+, Cu2+, Co2+, Ni2+, and Ag+ ions) did not show any considerable colour change and spectral variation under the same conditions. It suggested a high selectivity of FDNS toward Cu2+ ions (Fig. S8†). The fluorescence response of FDNS with different cations was also studied as depicted in Fig. S9.† The non fluorescent FDNS did not show any distinct change in its emission pattern on the addition Cu2+ ions. However, under the similar condition, a passionate fluorescence enhancement in presence of excess Hg2+ ions was observed with a peak at λem = 517 nm. It could be ascribed to the combinatorial effect of ring opening of FDNS and chelation of Hg2+ ions to it. The spectral pattern remains unbothered on the addition of several other competing metal ions.
3.2. Spectral titrations
The spectrophotometric titrations were performed to analyse the interaction of FDNS with Cu2+ ions at 25 °C in aqueous![[thin space (1/6-em)]](https://www.rsc.org/images/entities/char_2009.gif) :
:![[thin space (1/6-em)]](https://www.rsc.org/images/entities/char_2009.gif) MeOH (8
MeOH (8![[thin space (1/6-em)]](https://www.rsc.org/images/entities/char_2009.gif) :
:![[thin space (1/6-em)]](https://www.rsc.org/images/entities/char_2009.gif) 2 v/v, HEPES buffer(1 mM), pH 7.4). As shown in Fig. 4, a new absorption band centred at λmax = 495 nm gradually arises on the incremental addition of Cu2+ (0–1 equiv.) with concomitant change in the colour from yellow to light brown (inset of Fig. 4). An isobestic point is observed at λmax = 382 and 448 nm. The stoichiometric affiliation between FDNS and Cu2+ was found to be 1
2 v/v, HEPES buffer(1 mM), pH 7.4). As shown in Fig. 4, a new absorption band centred at λmax = 495 nm gradually arises on the incremental addition of Cu2+ (0–1 equiv.) with concomitant change in the colour from yellow to light brown (inset of Fig. 4). An isobestic point is observed at λmax = 382 and 448 nm. The stoichiometric affiliation between FDNS and Cu2+ was found to be 1![[thin space (1/6-em)]](https://www.rsc.org/images/entities/char_2009.gif) :
:![[thin space (1/6-em)]](https://www.rsc.org/images/entities/char_2009.gif) 1 based on the change in absorbance at λmax = 495 nm. The fluorescent spectra as shown in Fig. 5, were obtained on excitation at λex = 495 nm.
1 based on the change in absorbance at λmax = 495 nm. The fluorescent spectra as shown in Fig. 5, were obtained on excitation at λex = 495 nm.
Free FDNS was found weak-fluorescent. However, on incremental addition of Hg2+ ions to FDNS solution, a strong fluorescence with a band centred at λem = 517 nm was displayed. It was attributed to chelation enhanced fluorescence (CHEF) effect.28–30 The change in colour under UV light occurs as depicted in inset of Fig. 5. Thus, FDNS has very alluring “turn-on” fluorescence selectivity, for detection of toxic Hg2+ ions.31–36FDNS remains non fluorescent on the addition of Cu2+ ions owing to paramagnetic effect arising from spin–orbit coupling of the Cu2+ ions.36 Moreover, in case of absorbance, addition of Cu2+ ions followed an exponential increase (Fig. S10†) while in case of fluorescence, there is a linear increase on incremental addition of Hg2+ ions (Fig. S11†). The binding constant for Cu2+ and Hg2+ at R2 = 0.99, computed using the Benesi–Hildebrand method are found as 2.55 × 10⁵ and 4.79 × 10⁴ M−1 respectively. The corresponding graphs are shown in Fig. S12 and S13,† respectively. The maximum point at 0.5 for Cu2+ and Hg2+ in Job's plots also indicated that FDNS formed 1![[thin space (1/6-em)]](https://www.rsc.org/images/entities/char_2009.gif) :
:![[thin space (1/6-em)]](https://www.rsc.org/images/entities/char_2009.gif) 1 complexes with Cu2+ and Hg2+ (Fig. S14 and S15†). The detection limit of FDNS for Cu2+ and Hg2+ was found as 4.13 × 10⁻⁷ M and 2.50 × 10⁻⁷ M respectively, (Fig. S16 and S17†). It suggested that FDNS is an efficient system for monitoring traces of Cu2+ and Hg2+ ions. Thus, present probe turned out to be a multiple ion sensor exploiting both chromogenic and fluorogenic applications with a better detection limit as compared to earlier reported probe.22 Additionally, among several reported colorimetric probes,37 the present probe again turned out to be comparable with the detection limit and also in some case with stronger binding of Cu2+ ions.38 The quantum yield of FDNS (0.035) is enhanced upon binding with the Hg2+ ions (0.095) using fluorescein as a standard (0.5 in ethanol). However, some of the fluorescent probe reported earlier39 could not enhance the quantum yield on binding of Hg2+ ions. Thus, FDNS again turned out to be sensitive probe for Hg2+ ions.
1 complexes with Cu2+ and Hg2+ (Fig. S14 and S15†). The detection limit of FDNS for Cu2+ and Hg2+ was found as 4.13 × 10⁻⁷ M and 2.50 × 10⁻⁷ M respectively, (Fig. S16 and S17†). It suggested that FDNS is an efficient system for monitoring traces of Cu2+ and Hg2+ ions. Thus, present probe turned out to be a multiple ion sensor exploiting both chromogenic and fluorogenic applications with a better detection limit as compared to earlier reported probe.22 Additionally, among several reported colorimetric probes,37 the present probe again turned out to be comparable with the detection limit and also in some case with stronger binding of Cu2+ ions.38 The quantum yield of FDNS (0.035) is enhanced upon binding with the Hg2+ ions (0.095) using fluorescein as a standard (0.5 in ethanol). However, some of the fluorescent probe reported earlier39 could not enhance the quantum yield on binding of Hg2+ ions. Thus, FDNS again turned out to be sensitive probe for Hg2+ ions.
3.3. Selectivity of FDNS to Cu2+ and Hg2+ ions
It is challenging to achieve selectivity of specific analyte over competing species in the area of the development of sensors. To appraise the selectivity of FDNS for Cu2+ and Hg2+ ions in reality, competition experiments were also carried out. FDNS was added separately to a solution of Cu2+ and Hg2+ ions in the existence of other cations, such as Li+, Ca2+, Cd2+, Cr3+, Fe3+, K+, Na+, Al3+, Zn2+, Pb2+, Mg2+, Co2+, Ni2+, Ag+. As shown in Fig. S18,† for detection of Cu2+ ions, these ions did not reveal any noticeable interference in the absorption spectrum. Similarly, for detection of Hg2+ ions no significant interference was observed in the emission spectrum (Fig. S19†).3.4. Reversibility of FDNS for sensing Cu2+ and Hg2+
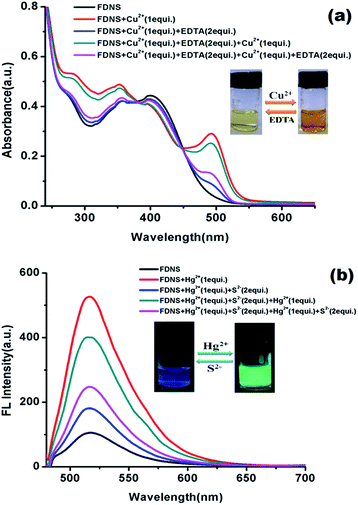
Reversibility is significant parameter to check the practicability of a sensor. To realize the reversibility of the proposed FDNS–Cu2+ and FHY–Hg2+ species, EDTA and S2− addition experiments were performed in the aqueous![[thin space (1/6-em)]](https://www.rsc.org/images/entities/char_2009.gif) :
:![[thin space (1/6-em)]](https://www.rsc.org/images/entities/char_2009.gif) MeOH solution, respectively. It was found that on addition of 2 equiv. EDTA solution to FDNS–Cu2+ adduct the absorbance decreased completely and reappears on further addition of Cu2+ ions (Fig. 6a). It was repeated to six cycles (Fig. S20†). Similarly, the response of FHY–Hg2+ adduct with Na2S was found reversible. After adding specific concentration of Na2S (2 equiv.), fluorescence intensity was quenched (Fig. 6b) which was almost completely recovered on further addition of Hg2+ ions. This restoration capability indicates that FDNS could be re-used with suitable management.
MeOH solution, respectively. It was found that on addition of 2 equiv. EDTA solution to FDNS–Cu2+ adduct the absorbance decreased completely and reappears on further addition of Cu2+ ions (Fig. 6a). It was repeated to six cycles (Fig. S20†). Similarly, the response of FHY–Hg2+ adduct with Na2S was found reversible. After adding specific concentration of Na2S (2 equiv.), fluorescence intensity was quenched (Fig. 6b) which was almost completely recovered on further addition of Hg2+ ions. This restoration capability indicates that FDNS could be re-used with suitable management.
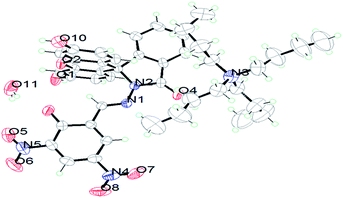
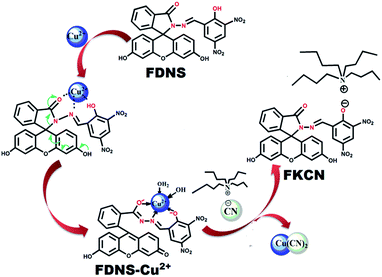
It was interesting to observe a clear change in colour from brown to green on addition of tetrabutylammonium cyanide solution to FDNS–Cu2+ adduct, which finally change into red colour solution (Fig. S21†). In due course of time (72 h), red coloured crystals of a new compound (FKCN) were obtained. It was characterized using spectroscopic (IR, 1H, 13C NMR) and X-ray crystallography. It was observed that the tetrabutylammonium cation was co-crystallized with FDNS. The molecular structure (ORTEP diagram) of FKCN is depicted in Fig. 7 and its structural refinement parameters are given in Table S1.† IR spectrum of FKCN displays a distinct peak at ν 1603 cm−1 assigned to ν(HC![[double bond, length as m-dash]](https://www.rsc.org/images/entities/char_e001.gif) N) vibration (Fig. S22†). 1H spectrum (Fig. S23†) of FKCN further confirms the existence of CH
N) vibration (Fig. S22†). 1H spectrum (Fig. S23†) of FKCN further confirms the existence of CH![[double bond, length as m-dash]](https://www.rsc.org/images/entities/char_e001.gif) N proton at δ 8.81 ppm. Its 13C NMR spectrum (Fig. S24†) showed a peak at δ 64.84 ppm and supports the presence of spiro carbon in its structure. The UV-visible spectrum of FKCN showed peaks at λmax = 399 nm (ε = 26
N proton at δ 8.81 ppm. Its 13C NMR spectrum (Fig. S24†) showed a peak at δ 64.84 ppm and supports the presence of spiro carbon in its structure. The UV-visible spectrum of FKCN showed peaks at λmax = 399 nm (ε = 26![[thin space (1/6-em)]](https://www.rsc.org/images/entities/char_2009.gif) 600 M−1 cm−1) assigned to intra-molecular charge transfer transition. It crystallizes in a triclinic crystal system with P
600 M−1 cm−1) assigned to intra-molecular charge transfer transition. It crystallizes in a triclinic crystal system with P![[1 with combining macron]](https://www.rsc.org/images/entities/char_0031_0304.gif) space group. In FKCN, dihedral angle between spirolactam and xanthene plane is found as 89.64(2)° as depicted in Fig. S25.†
space group. In FKCN, dihedral angle between spirolactam and xanthene plane is found as 89.64(2)° as depicted in Fig. S25.†
Intermolecular hydrogen bonds between two molecules of FKCNvia co-crystallised water molecule O11–H1w⋯O3, O10–H10⋯O11 stabilizes the crystal structure and forms supramolecular structure with cavity (Fig. S26†) while incorporation of another intermolecular hydrogen bonding of type O1–H010⋯O3 between hydroxyl group (O1–H010) of a FKCN to carbonyl group of another neighbouring FKCN forms ladder like structure (Fig. 8).
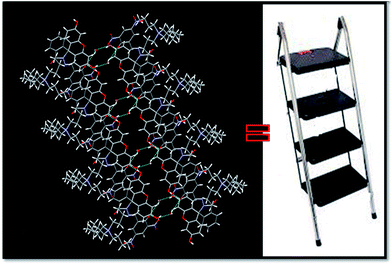 | ||
| Fig. 8 Intermolecular hydrogen bonds between two molecules of FKCNvia co-crystallised water molecule showing the formation of ladder structure. | ||
3.5. Probable mechanism of recognition of cations
IR spectrum (Fig. S27†) of a solid isolated by the addition of Cu2+ ions to FDNS, showed major peaks at 1614.58 and 1645.8 cm−1. These peaks were assigned to ν(CH![[double bond, length as m-dash]](https://www.rsc.org/images/entities/char_e001.gif) N) and ν(C
N) and ν(C![[double bond, length as m-dash]](https://www.rsc.org/images/entities/char_e001.gif) O) respectively and shifted significantly as compared to peak observed for free FDNS. It supported that both groups of FDNS had coordinated with Cu2+ ion. The ESI-MS data of this adduct displayed a peak at m/z 639.0066 (Fig. S28†) which corresponds to the parent ion as [FDNS + Cu2+ + 2H2O] + 1. It further supported the formation of a 1
O) respectively and shifted significantly as compared to peak observed for free FDNS. It supported that both groups of FDNS had coordinated with Cu2+ ion. The ESI-MS data of this adduct displayed a peak at m/z 639.0066 (Fig. S28†) which corresponds to the parent ion as [FDNS + Cu2+ + 2H2O] + 1. It further supported the formation of a 1![[thin space (1/6-em)]](https://www.rsc.org/images/entities/char_2009.gif) :
:![[thin space (1/6-em)]](https://www.rsc.org/images/entities/char_2009.gif) 1 copper adduct as evidenced from the absorption titrations.40,41 The isolation of FKCN supported that FDNS–Cu2+ adduct interact with tetrabutylammonium cyanide via displacement approach as shown in Scheme 2. The binding of FDNS with Hg2+ ions was substantiated by its 1H NMR titrations in a mixture of DMSO-d6 and D2O. As shown in Fig. S29,† on the incremental addition of Hg2+, the imine proton (CH
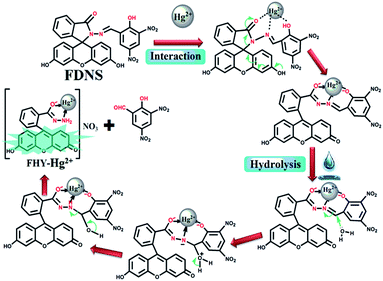
1 copper adduct as evidenced from the absorption titrations.40,41 The isolation of FKCN supported that FDNS–Cu2+ adduct interact with tetrabutylammonium cyanide via displacement approach as shown in Scheme 2. The binding of FDNS with Hg2+ ions was substantiated by its 1H NMR titrations in a mixture of DMSO-d6 and D2O. As shown in Fig. S29,† on the incremental addition of Hg2+, the imine proton (CH![[double bond, length as m-dash]](https://www.rsc.org/images/entities/char_e001.gif) N) shifted from δ 9.03 to 9.23 ppm. It supported the coordination of Hg2+ to FDNS. The phenolic proton (OH) of FDNS also moved to downfield by δ = 0.29 ppm (9.93 to 10.12 ppm) and finally disappeared. Interestingly, a new peak emerged at δ = 10.42 ppm. It was assigned to an aldehyde proton. The above data imply that Hg2+ ion may first coordinated to the FDNS and then results in its hydrolysis. The ESI-MS of solid thus obtained gave a peak at m/z = 544.4615 (Fig. S30†). It supported the formation of fluorescein hydrazide (FHY)–Hg2+ adduct,42–44 further supported by its IR spectrum (Fig. S31†). Thus, based on these observations, a tentative mechanism of binding of Hg2+ ions to FDNS is proposed as shown in Scheme 3.
N) shifted from δ 9.03 to 9.23 ppm. It supported the coordination of Hg2+ to FDNS. The phenolic proton (OH) of FDNS also moved to downfield by δ = 0.29 ppm (9.93 to 10.12 ppm) and finally disappeared. Interestingly, a new peak emerged at δ = 10.42 ppm. It was assigned to an aldehyde proton. The above data imply that Hg2+ ion may first coordinated to the FDNS and then results in its hydrolysis. The ESI-MS of solid thus obtained gave a peak at m/z = 544.4615 (Fig. S30†). It supported the formation of fluorescein hydrazide (FHY)–Hg2+ adduct,42–44 further supported by its IR spectrum (Fig. S31†). Thus, based on these observations, a tentative mechanism of binding of Hg2+ ions to FDNS is proposed as shown in Scheme 3.
3.6. pH effects on sensing by FDNS
To check the sensing ability of FDNS at physiological level, pH effect of free FDNS and FDNS–Cu2+/Hg2+ adducts on the absorption and emission spectra were recorded over a wider range of pH (2.0–12.0). It was observed that the solution of FDNS showed insignificant absorption and emission in pH range 2.0–6.0; signifying that the FDNS was stable over this pH range.45 But as depicted in Fig. S32(a),† an intense absorption was observed after Cu2+ ions addition to FDNS solution. (pH 7.0 or more.)Similarly, the fluorescence intensity of FHY–Hg2+ assembly also increases in the region of pH 7.0–12.0 as depicted in Fig. S32(b).† Thus, the response behaviour of FDNS separately to Cu2+ and Hg2+ ions could be studied under physiological conditions.
3.7. Time-dependence detection process of Cu2+ and Hg2+
The reaction time profile of FDNS separately with Cu2+ and Hg2+ ions are also studied. The kinetics of the reaction was complete within 40 and 25 seconds for Cu2+ and Hg2+ respectively. It showed that this probe react very rapidly with selective ions under the experimental conditions as shown in Fig. S33(a) and S33(b),† respectively.3.8. Sequential logic gate operations
Sequential circuits useful for the memory devices, function via feedback loop where one of the output obtained is used as the input and recognised as the ‘memory element’.46 Thus, a sequential logic circuit is designed on the basis of Cu2+ and EDTA as chemical inputs which are designated as input A and input B. The absorption at λmax = 495 nm and visual detection are considered as OUT1 and OUT2, respectively. A value of 0.12 was calculated as threshold value of OUT1 as depicted in Fig. S34.† A logic circuit having two inputs (input A and input B) and two outputs have been constructed and the concerned truth table is shown in Fig. 9. Furthermore, the switchability of FDNS controlled by Hg2+ and S2− also commune information as two inputs and two outputs. The fluorescence signal at 517 nm functions as output 1 and the colour change of FDNS after addition of Hg2+ in UV light as output 2 and corresponding sequential logic circuits are depicted in Fig. S35 and S36.† A value of 200 as threshold value was fixed as OUT1 at λem = 517 nm for the fluorescence intensity. ‘1’ is denoted for the fluorescence intensity greater than threshold value and ‘0’ is represented for the intensity lower than the threshold value which corresponds to the ‘ON’ and ‘OFF’ states of the readout signals.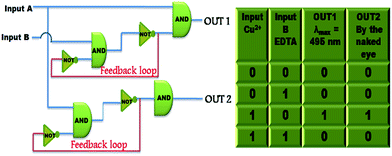 | ||
| Fig. 9 Truth table and sequential logic circuits displaying memory units with two inputs (input A (Cu2+) and input B (EDTA)) and two outputs in the presence of chemical inputs. | ||
This system is also utilized for the construction of a security keypad lock depending on the sequential addition of Cu2+ and Hg2+ as inputs 1 and 2 respectively (Fig. S37†). The receptor FDNS shows no significant emission band at 517 nm in the absence of any chemical input hence output is 0 (OFF-state). The addition of Cu2+ to FDNS gives the output ‘0’ (OFF-state) but it is reversed to ‘1’ (ON-state) with the chronological addition of another input Hg2+. However, on changing the input sequence, Hg2+ as the first input with subsequent addition of Cu2+ as second input, the fluorescence intensity is observed below its threshold limit, thus output is represented as zero. Inputs Cu2+ and Hg2+ were represented as ‘B’ and ‘H’ respectively. There are two possibilities of inputs sequence: (a) addition of ‘B’ followed by ‘H’ where the receptor FDNS causes emission above threshold limit at λem 517 nm and this ‘ON’ state is assigned by ‘U’ which generate a secret code ‘BHU’. In the reverse sequence, ‘H’ is followed by ‘B’, the fluorescence at 517 nm get quenched which is ‘OFF’ state and is denoted by ‘S’. This sequence (HBS) failed to open the keypad lock. Hence, for the construction of the molecular keypad lock, ‘BHU’, inputs in specific sequence is essential. The schematic representation of keypad lock with corresponding truth table is depicted in Fig. 10.
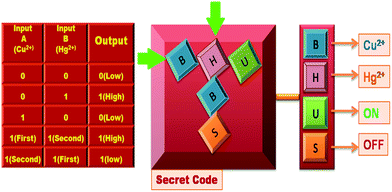 | ||
| Fig. 10 Schematic representation of keypad locks and truth table of lock to access a secret code by observing the fluorescence at 517 nm with different inputs. | ||
More than 700 different combinations are observed by the use of numerical digits (0–9) and letters (A–Z) as ‘PIN’ in a two-digit password.47 Thus, unlocking the keypad lock becomes more complex which substantially enhances the security of the devices at molecular level. Thus, keypad lock can be unlocked only by the users who know the correct passwords.
3.9. Role of FDNS in the analysis of Cu2+ and Hg2+ ions in water samples
The role of FDNS for analysis of Cu2+ and Hg2+ ions in natural water were done by using proof-of-concept experiments without any prior sanitization.48 Three water sample were collected from the different sources such as River Ganga (Assi), pond (Durgakund) and lake (Motijheel), all from Varanasi City, India. The solution of Hg(NO3)2 (0–10 μM) were spiked into these samples followed by addition of FDNS (10 μM). A good linear curve was obtained between fluorescence intensity versus concentration of Hg2+ in the range of 2–10 μM (Fig. S38†). This clearly shows the potential relevance of FDNS for detection of Hg2+ ions in ecological water (Table S4†). Similarly, nitrate salt of Cu2+ ions (0–10 μM) were spiked into the water samples solution followed by the addition of FDNS (10 μM). Here also a linear graph between the absorption and the Cu2+ ion concentration in the range of 2–8 μM (Fig. S39†). The data are presented Table S5.† The experimental results suggested FDNS is relevant for effective analysis of Cu2+ or Hg2+ ions in natural water sources.3.10. Fast track detection of Cu2+ and Hg2+ ions
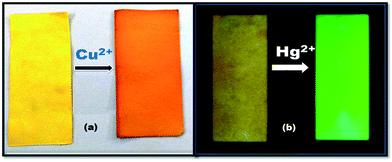
To ensure the cleanliness of the drinking water and consumable food stuffs in remote places is a great challenge now days. Therefore, for on-site detection of Cu2+ and Hg2+ ions a manageable test strips were equipped, as they did not need any complicated equipments. Since, for this filter-paper strips were first soaked in FDNS solution and then air dried. After that filter-paper dipped in a Cu2+ solution (1 equiv.). A distinct visible light brown colour change was observed immediately as shown in Fig. 11a. The test-strips change its colour to fluorescent green under UV light in the presence of Hg2+ ion only (Fig. 11b). This makes the probes pretty useful for quick on-site detection of metal ions in real samples.493.11. Live cell imaging of FDNS and detection of Hg2+ ions in cervical cancer cell lines
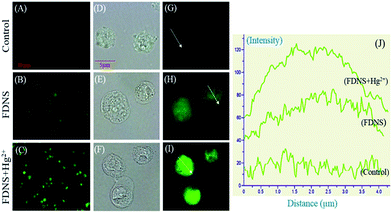
The uptake of FDNS by ME-180 cervical cancer cells is detected by fluorescence microscopy. FDNS treated live cells showed green fluorescence throughout the cells while control treated with solvent has no fluorescence (Fig. 12A and B).Interestingly, FDNS mediated fluorescence was enhanced about 1.5 folds upon the addition of mercury (Hg2+) (Fig. 12C). Magnified bright field images as depicted in Fig. 12D–F showed that cells are intact. The Fig. 12H and I show that compound is distributed throughout the cell and their intensity graph is depicted in Fig. 12J. Hence, compound FDNS has wider permeability in ME-180 cervical cancer cells.
4. Conclusions
In summary, fluorescein hydrazone FDNS is synthesized by the condensation of 3,5-dinitrosalicylaldehyde with fluorescein hydrazide. It is effectively characterized using spectroscopic techniques and further supported by its X-ray crystallography. This molecule empowers the formation of interesting supramolecular structures via intermolecular H-bonding. FDNS exhibits a colorimetric response to Cu2+ ions with naked eye visibility followed by spectral titrations without any interference from several relevant metal ions. The addition of a solution of tetrabutylammoniumcyanide in methanol to a corresponding solution of FDNS–Cu2+ ensemble enables it as a secondary sensor of CN− ions and provides a novel organic compounds FKCN containing deprotonated FDNS co-crystallized with tetrabutylammonium cation. The Hg2+ and Cu2+ are selectively detected in the presence of several other metal ions with a detection limits of 4.13 × 10⁻⁷ M and 2.50 × 10⁻⁷ M, respectively. The sensing mechanisms of FDNS for Cu2+ ions follows opening of spirolactam ring on its binding to FDNS. However, binding of Hg2+ ions to FDNS leads hydrolysis of CH![[double bond, length as m-dash]](https://www.rsc.org/images/entities/char_e001.gif) N group bringing “turn on” fluorescence. The other potential applications of FDNS involves its uses as memory device, paper strip tests for the analysis of Cu2+ and Hg2+ ions in the contaminated samples. The live cell imaging also promotes its application in real world.
N group bringing “turn on” fluorescence. The other potential applications of FDNS involves its uses as memory device, paper strip tests for the analysis of Cu2+ and Hg2+ ions in the contaminated samples. The live cell imaging also promotes its application in real world.
Acknowledgements
The financial assistance from DST (DST/INSPIRE FACULTY AWARD/2012, N. K.), UGC-BSR Faculty Fellowship (LM), and Banaras Hindu University fellowship (K. T.), are gratefully acknowledged.References
- A. Ajaya ghosh, P. Carol and S. Sreejith, J. Am. Chem. Soc., 2005, 127, 14962 CrossRef CAS PubMed.
- J. W. Lee, H. S. Jung, P. S. Kwon, J. W. Kim, R. A. Bartsch, Y. Kim, S. Kim and J. S. Kim, Org. Lett., 2008, 10, 3801 CrossRef CAS.
- L. Xue, Q. Liu and H. Jiang, Org. Lett., 2009, 11, 3454 CrossRef CAS PubMed.
- M. Leermakers, W. Baeyens, P. Quevauviller and M. Horvat, Trends Anal. Chem., 2005, 24, 383 CrossRef CAS.
- C. C. Huang and H. T. Chang, Anal. Chem., 2006, 78, 8332 CrossRef CAS PubMed.
- S. Cai, Y. Lu, S. He, F. Wei, L. Zhao and X. Zeng, Chem. Commun., 2013, 49, 822 RSC.
- T. Hirano, K. Kikuchi, Y. Urano, T. Higuchi and T. Nagano, J. Am. Chem. Soc., 2000, 122, 12399 CrossRef CAS.
- G. K. Walkup, S. C. Burdette, S. J. Lippard and R. Y. Tsien, J. Am. Chem. Soc., 2000, 122, 5644 CrossRef CAS.
- T. Hirano, K. Kikuchi, Y. Urano, T. Higushi and T. Nagano, Angew. Chem., Int. Ed., 2000, 39, 1052 CrossRef CAS PubMed.
- S. C. Burdette, G. K. Walkup, B. Spingler, R. Y. Tsien and S. J. Lippard, J. Am. Chem. Soc., 2001, 123, 7831 CrossRef CAS PubMed.
- K. R. Gee, Z. L. Zhou, W. J. Qian and R. Kennedy, J. Am. Chem. Soc., 2002, 124, 776 CrossRef CAS.
- S. C. Burdette, C. J. Frederickson, W. Bu and S. J. Lippard, J. Am. Chem. Soc., 2003, 125, 1778 CrossRef CAS PubMed.
- M. Suresh, A. Ghosh and A. Das, Chem. Commun., 2008, 44, 3906 RSC.
- W. J. Shi, J. Y. Liu and D. K. P. Ng, Chem.–Asian J., 2012, 7, 196 CrossRef CAS.
- K. J. Barnham, C. L. Masters and A. I. Bush, Nat. Rev. Drug Discovery, 2004, 3, 205 CrossRef CAS.
- E. Gaggelli, H. Kozlowski, D. Valensin and G. Valensin, Chem. Rev., 2006, 106, 1995 CrossRef CAS.
- X. Zeng, L. Dong, C. Wu, L. Mu, S. F. Xue and Z. Tao, Sens. Actuators, B, 2009, 141, 506 CrossRef CAS.
- L. Tang, F. Li, M. Liu and R. Nandhakumar, Spectrochim. Acta, Part A, 2011, 78, 1168 CrossRef.
- N. Sharma, S. I. Reja, V. Bhalla and M. Kumar, Dalton Trans., 2014, 43, 15929 RSC.
- H. Y. Lee, K. M. K. Swamy, J. Y. Jung, G. Kim and J. Yoon, Sens. Actuators, B, 2013, 182, 530 CrossRef CAS.
- R. Prajapati, L. Mishra, S. J. Grabwoski, G. Govil and S. K. Dubey, J. Mol. Struct., 2008, 879, 1 CrossRef CAS.
- Y. Yang, F. Huo, C. Yin, Y. Chu, J. Chao, Y. Zhang, J. Zhang, S. Li, H. Lv, A. Zheng and D. Liu, Sens. Actuators, B, 2013, 177, 1189 CrossRef CAS.
- G. M. Sheldrick, SHELXS-97 Program for the Solution of Crystal Structures, University of Göttingen, Göttingen, Germany, 1997 Search PubMed.
- G. M. Sheldrick, Phase annealing in SHELX-90, Acta Crystallogr., Sect. A: Found. Crystallogr., 1990, 46, 467 CrossRef.
- H. A. Benesi and J. H. Hildebrand, J. Am. Chem. Soc., 1949, 71, 2703 CrossRef CAS.
- A. Hakonen Plasmon, Anal. Chem., 2009, 81, 4555 CrossRef.
- D. Wang, X. Xiang, X. Yang, X. Wang, Y. Guo, W. Liu and W. Qin, Sens. Actuators, B, 2014, 201, 246 CrossRef CAS.
- E. M. Nolan and S. J. Lippard, Chem. Rev., 2008, 108, 3443 CrossRef CAS.
- A. Tamayo, B. Pedras, C. Lodeiro, L. Escriche, J. Casabo, L. Capelo, B. Covelo, R. Kiveka and R. Sillanpa, Inorg. Chem., 2007, 46, 159 Search PubMed.
- Y. Zhang, Y. Yang, J. Hao, C. Yin, F. Huo, J. Chao and D. Liu, Spectrochim. Acta, Part A, 2014, 132, 27 CrossRef CAS.
- Y. Yang, K. Yook and J. Tae, J. Am. Chem. Soc., 2005, 1, 16760 CrossRef.
- G. Zhang, D. Zhang, S. Yin, X. Yang, Z. Shuai and D. Zhu, Chem. Commun., 2005, 6, 2161 RSC.
- X. Guo, X. Qian and L. Jia, J. Am. Chem. Soc., 2004, 126, 2272 CrossRef CAS.
- G. Hennrich, W. Walther, U. Resch-genger and H. Sonnenschein, Inorg. Chem., 2001, 40, 641 CrossRef CAS.
- Y. Zhao, Z. Lin, C. He, H. Wu and C. Duan, Inorg. Chem., 2006, 45, 10013 CrossRef CAS.
- A. P. De Silva, H. Q. N. Gunarante, T. Gunnlaugsson, A. J. M. Huxley, C. P. McCoy, J. T. Rademacher and T. E. Rice, Chem. Rev., 1997, 97, 1515 CrossRef CAS.
- X. Wu, X. Gong, W. Dong, J. Ma, J. Chao, C. Li, L. Wang and C. Dong, RSC Adv., 2016, 6, 59677 RSC and references therein.
- H. M. Chawla, R. Shukla and S. Pandey, Tetrahedron Lett., 2013, 54, 2063 CrossRef CAS.
- E. M. Nolan, M. E. Racine and S. J. Lippard, Inorg. Chem., 2006, 45, 2742 CrossRef CAS PubMed.
- Z. Q. Guo, W. H. Zhu, L. J. Shen and H. Tian, Angew. Chem., 2007, 119, 5645 CrossRef.
- J. Mao, L. N. Wang, W. Dou, X. L. Tang, Y. Yan and W. S. Liu, Org. Lett., 2007, 9, 4567 CrossRef CAS.
- H. Cheng and Y. Qian, RSC Adv., 2015, 5, 82887 RSC.
- H. A. Benesi and J. H. Hildebrand, J. Am. Chem. Soc., 1949, 71, 2703 CrossRef CAS.
- S. Tatay, P. Gavin, E. Coronado and E. Palomares, Org. Lett., 2006, 8, 3857 CrossRef CAS.
- E. M. Nolan and S. J. Lippard, J. Am. Chem. Soc., 2003, 125, 14270 CrossRef CAS.
- T. Mistri, R. Alam, R. Bhowmick, A. Katarkar, K. Chaudhuri and M. Ali, New J. Chem., 2016, 40, 330 RSC.
- M. Suresh, A. Ghosh and A. Das, Chem. Commun., 2008, 3906 RSC.
- H. L. Li, J. L. Fan, F. L. Song, H. Zhu, J. J. Du, S. G. Sun and X. J. Peng, Chem.–Eur. J., 2010, 16, 12349 CrossRef CAS.
- L. D. Chebrolu, S. Thurakkal, H. S. Balaraman and R. Danaboyina, Sens. Actuators, B, 2014, 8, 204 Search PubMed.
Footnote |
| † Electronic supplementary information (ESI) available: Spectral data crystallographic data and structure refinement parameters, selected bond lengths and bond angles, hydrogen bonds, π⋯π interactions. CCDC 1498576 and 1502946 for FDNS and FKCN. For ESI and crystallographic data in CIF or other electronic format see DOI: 10.1039/c6ra26255d |
| This journal is © The Royal Society of Chemistry 2017 |

