
 Open Access Article
 This Open Access Article is licensed under a
 Creative Commons Attribution 3.0 Unported Licence
Linking particle size to improved electrochemical performance of SiO anodes for Li-ion batteries†
Tao Huanga,
Yaxiong Yanga,
Kaichao Pua,
Jiaxun Zhanga,
Mingxia Gaoa,
Hongge Pana and
Yongfeng Liu *ab
*ab
aState Key Laboratory of Silicon Materials, Key Laboratory of Advanced Materials and Applications for Batteries of Zhejiang Province, School of Materials Science and Engineering, Zhejiang University, Hangzhou 310027, P. R. China. E-mail: mselyf@zju.edu.cn
bKey Laboratory of Advanced Energy Materials Chemistry (Ministry of Education), Nankai University, Tianjin 300071, China
First published on 12th January 2017
Abstract
We demonstrate a first attempt to understand the particle size-dependence of electrochemical Li storage properties of silicon monoxide (SiO). SiO powder particles of different sizes are obtained by planetary ball milling at 300 rpm for 0–12 h. The 10 h-milled SiO sample exhibits relatively uniform particle morphology with significantly reduced particle size, which induces optimal electrochemical Li storage properties. The specific surface area of the 10 h-milled SiO sample is determined to be approximately 20.1 m2 g−1, which is more than 22 times that of pristine SiO (∼0.9 m2 g−1). The first discharge and charge capacities of the 10 h-milled SiO sample are 2684 and 2091 mA h g−1, respectively, at 100 mA g−1. After 150 cycles, the discharge capacity of the 10 h-milled sample remains at 1159 mA h g−1, while the discharge capacity is only 777 mA h g−1 for the pristine SiO sample. The mechanism of the capacity loss upon cycling is also analysed and discussed.
Introduction
Rechargeable Li-ion batteries (LIBs) have been widely used in the field of portable electronics, and they are regarded as one of the most promising candidates for powering electric vehicles and grid-scale energy storage systems.1,2 To meet the ever-increasing energy demands, developing new electrode materials with high energy density and long cycle life is particularly critical for next-generation LIBs.3 In this respect, Si-based materials have attracted significant attention as alternative anode materials due to their ultra-high theoretical capacities, low discharge potential and abundant sources.4 The theoretical specific capacity of pure Si is as high as 4200 mA h g−1 when it is lithiated to Li22Si5, which is more than 10 times larger than that of the graphite carbon (372 mA h g−1) used in existing technology.5 However, Si-based anodes also suffer from a significant volume change of up to 400% during Li insertion and extraction, which leads to rapid capacity fading upon cycling. Tremendous work has been conducted to address this issue by reducing the particle size,6,7 producing porous structures,8–12 forming silicon–metal alloys,13,14 fabricating thin films,15–17 creating Si/C composites,18–20 dispersing silicon nanoparticles into an inactive/active matrix,21–23 etc. Unfortunately, the practical applications of Si-based anodes in LIBs have not been realized.Alternatively, the partial oxidation of Si is also proposed as a feasible strategy for decreasing the volume change of Si during lithiation/delithiation.24–26 In particular, SiO is of considerable interest due to its unique microstructure, in which Si nanoparticles are distributed in a matrix of Si suboxides.27 Such a structural feature relieves the strain deformation that originates from the change in volume upon lithiation/delithiation cycling, which consequently alleviates the pulverization of the active material.28 In this regard, pristine SiO possesses better cycle performance than pure micrometre-sized Si powder.29 However, many experimental studies revealed rapid capacity fading and poor initial columbic efficiency for SiO.30–32 To improve the electrochemical performance of SiO, several strategies have been proposed in recent years, including nanocomposite construction, surface coating, and element doping.33–36 Doh et al. reported that the ball-milled SiO/C composite showed a reversible charge capacity value of 688 mA h g−1 at the 30th cycle with 99% coulombic efficiency.37 Guo et al. demonstrated that the electrochemical capacity of the SiO/graphene nanocomposite prepared by an in situ chemical synthesis approach remained at 890 mA h g−1 after 100 cycles.38 Woo et al. discovered that the B-doped SiO has a specific capacity of 947 mA h g−1 at a rate of 0.5C and an excellent capacity retention of 93.3% over 100 cycles.36 The capacity retention of the W-coated SiO increased from 52.0% to 63.2% at a rate of 0.5C after 100 cycles.39 Liu et al. successfully prepared SiO/Sn–Co–C and SiO/Sn–Fe–C composites by ultrahigh energy ball milling, and they revealed only a 22% capacity loss and a 700 mA h g−1 specific capacity at a current of 1C for 100 cycles for the 50 wt% SiO–50 wt% Sn30Co30C40 composite electrode.40 Although the cycle performance of SiO has been remarkably improved, the reported energy density of SiO anodes decreased noticeably to values generally below 1000 mA h g−1. In addition, it should be noted that the SiO-based nanocomposites were always prepared by high-energy ball milling. However, the effect of particle size on the electrochemical Li storage behaviour of pristine SiO is unclear.
In this work, we report a first attempt to understand the relationship between the particle size and electrochemical properties of SiO. SiO powder particles of different sizes were obtained by planetary ball milling at 300 rpm for 0–12 h. The 10 h-milled sample exhibited optimal electrochemical performance due to the dramatically reduced particle size and relatively uniform particle morphology. The specific surface area of the 10 h-milled sample was determined to be approximately 20.1 m2 g−1, which is more than 22 times that of the pristine SiO (∼0.9 m2 g−1). While cycling at 100 mA g−1, the 10 h-milled sample delivered a discharge capacity of 2684 mA h g−1 with a calculated initial coulombic efficiency of 78%. After 150 cycles, the discharge capacity of the 10 h-milled sample remained at 1159 mA h g−1, which corresponds to a capacity retention of 55.4%. A two-stage process of capacity fading upon cycling was elucidated for the SiO anode.
Experimental
Commercial SiO powder (325 mesh) was purchased from Sigma-Aldrich (USA) and ball milled on a planetary ball mill (QM-3SP4, Nanjing) at 300 rpm for 4–12 h under an argon atmosphere. The ball-to-sample weight ratio was approximately 50![[thin space (1/6-em)]](https://www.rsc.org/images/entities/char_2009.gif) :1. Handling of samples was always carried out under anaerobic (O2: < 0.1 ppm) and anhydrous (H2O: < 0.1 ppm) conditions inside a MBRAUN glovebox (Germany) filled with pure argon to prevent the materials from being contaminated by air and moisture.
:1. Handling of samples was always carried out under anaerobic (O2: < 0.1 ppm) and anhydrous (H2O: < 0.1 ppm) conditions inside a MBRAUN glovebox (Germany) filled with pure argon to prevent the materials from being contaminated by air and moisture.
Structural identification was performed on a MiniFlex 600 Rigaku X-Ray Diffractometer (XRD) with Cu-Kα radiation operating at 40 kV and 15 mA. The XRD data were collected in 0.02° increments between 2θ scattering angles of 10° and 80°. A custom-designed container was used to prevent the sample from being contaminated by air and moisture. The sample morphologies were examined using a field emission scanning electron microscope (SEM, Hitachi SU70 Japan) and a high-resolution transmission electron microscope (HRTEM, FEI Tecnai G2 F30, USA, operating at 300 kV). For TEM observation, a suspension of the as-received SiO in anhydrous alcohol was drop-cast onto carbon-coated copper grids and dried under ambient condition. The Si/O atomic ratio was examined with an energy-dispersive X-ray spectrometer (EDS) attached to the Tecnai G2 F30 TEM instrument. X-ray photoelectron spectroscopy (XPS) analysis was conducted on a Thermo Scientific ESCALAB 250Xi system equipped with an Al-Kα (1486.6 eV) X-ray source. The depth profile of the element distribution on the cycled electrode surface was acquired by sputtering with Ar+ on a spot of Φ 2.5 mm at 15 kV and 10 mA. All samples were measured after 0, 12.5, 25, and 37.5 min of Ar ion sputtering. The sputtering rate was estimated to be 1.2 nm min−1 for ZnO and Al2O3 film. The XPS data were calibrated using the adventitious C 1s signal at 284.8 eV as a reference and the binding energy spectra were fitted using the XPSPEAK software. The specific surface area (SSA) of the powder samples was determined from N2 sorption isotherms recorded at 77 K using the Brunauer–Emmett–Teller (BET) method on a Quantachrome Nova 1000e analyser (USA). For the cycled electrodes, anhydrous diethyl carbonate (DEC) was used to wash away the electrolyte that remained on the surface before XRD and SEM examination.
The electrochemical properties were evaluated on CR2025 coin-type half cells assembled in an argon-filled glovebox with oxygen and water contents of less than 0.1 ppm. The working electrode was prepared by coating the slurry consisting of 70 wt% SiO as the active material, 20 wt% acetylene black as the conductive agent, and 10 wt% sodium alginate as the binder on a 13 mm copper foil, and then dried in vacuum at 120 °C for 12 h. The mass loading of the active material was ca. 1.5 mg cm−2 for each electrode. Pure lithium foil was used as both the reference and counter electrode, a solution of 1 M LiPF6 with ethylene carbonate (EC)/dimethyl carbonate (DMC) (1:1 by volume) was used as the electrolyte, and a Celgard 2400 membrane was used as the separator. To exactly evaluate the effects of the particle size on the electrochemical lithium storage properties, no additives such as vinyl carbonate (VC) or fluoroethylene carbonate (FEC) were included in the electrolyte. The assembled cells were galvanostatically discharged (lithiation)/charged (delithiation) in a voltage range of 0.01–2 V (vs. Li/Li+) at a constant current density of 100 mA g−1 using a Neware battery testing system (Shenzhen, China) at room temperature. Cyclic voltammetry (CV) measurements were carried out on an Arbin potentiostat (BT-2000, USA) at a scan rate of 0.1 mV s−1. The electrochemical impedance spectroscopy (EIS) results were recorded with an Ivium Vertex electrochemical workstation (The Netherlands) using a 5 mV amplitude, with a frequency ranging from 100 kHz to 10 mHz.
Results and discussion
The pristine and milled SiO samples were first subjected to compositional and structural characterization with EDS and XRD. As shown in Fig. 1(a), EDS analysis indicated that the atomic ratio of Si/O in the pristine sample was approximately 1:1. XRD examination (Fig. 1(b)) displayed a typical amorphous nature for the pristine SiO sample because only a broad peak located between 15–30° (2θ) was detected, which was further confirmed by the HRTEM image (Fig. 1(c)) associated with the selected-area diffraction (SAD) patterns (Fig. 1(d)). These results are in good agreement with previous reports where the amorphous SiO is regarded as amorphous Si distributed in a Si suboxide matrix.36,41 After a ball milling treatment at 300 rpm for 12 h, no noticeable change was observed in the XRD patterns, which indicates the persistence of the amorphous feature.
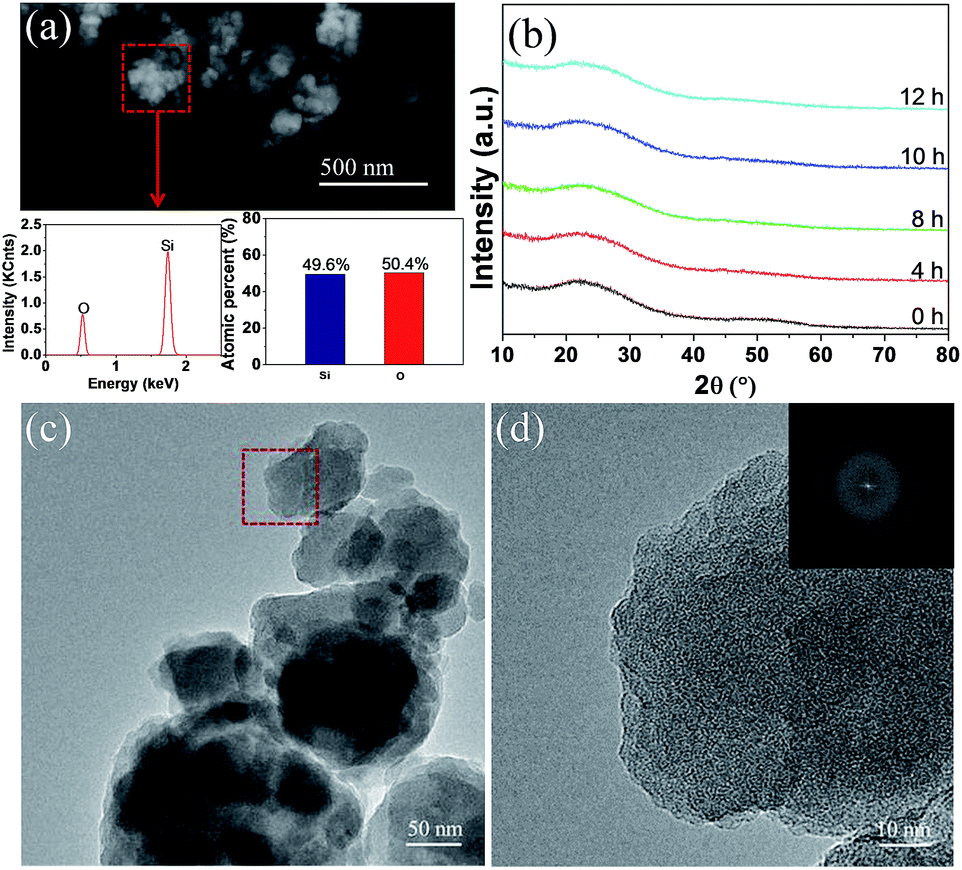 | ||
| Fig. 1 EDS results (a), XRD patterns (b), HRTEM (c) and SAD (d) images of the pristine SiO sample. | ||
Fig. 2 displays the SEM images of the pristine and milled SiO samples. It is clear that the ball milling treatment induces a remarkable reduction in the particle size of SiO. The pristine SiO exhibited very irregular particle morphology, and the size of most particles was larger than 5 μm (Fig. 2(a)). After ball milling for 4 h, the particle size distinctly reduced to approximately 2 μm, with a relatively uniform morphology (Fig. 2(b)). As the ball milling was prolonged to 8 h and 10 h, the particle size further reduced to below 1.5 μm, and even particles smaller than 1 μm were observed with good particle dispersion in the sample (Fig. 2(c) and (d)). However, by further extending the ball milling time to 12 h, the smaller particles tended to aggregate and the particle size increased to approximately 1 μm (Fig. 2(e)). This phenomenon was confirmed quantitatively by BET measurements. As shown in Fig. 2(f), the calculated specific surface area first increased from 0.9 m2 g−1 for pristine SiO to 20.1 m2 g−1 for the 10 h-milled sample, and then decreased to 18.6 m2 g−1 when the milling time was extended to 12 h. Specifically, the specific surface area increases by more than 21 times after 10 h of ball milling, which should facilitate an improvement in the electrochemical properties of SiO. Further characterization on size distribution also provided additional evidence for the reduced particle size as shown in Fig. S1 (ESI†).
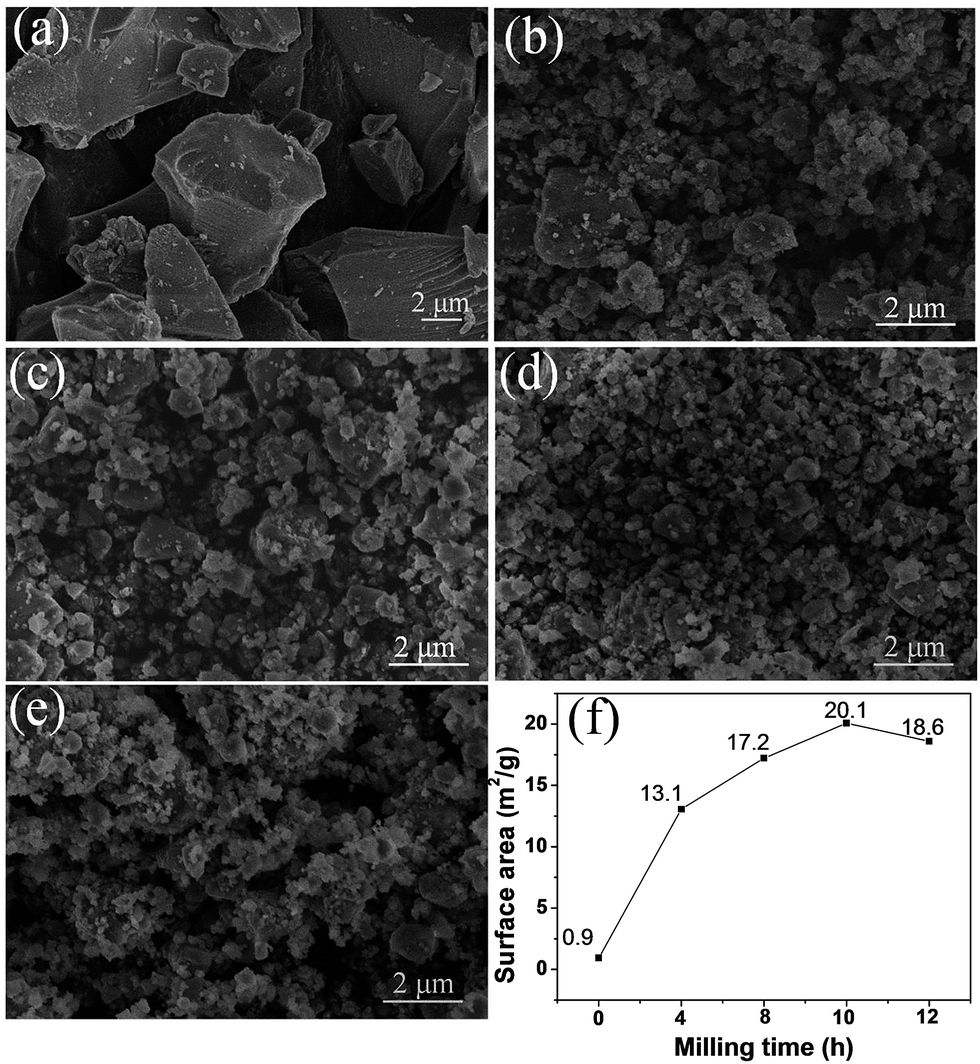 | ||
| Fig. 2 SEM images of pristine SiO (a), SiO milled for 4 h (b), 8 h (c), 10 h (d) and 12 h (e). BET results (f) of pristine and milled SiO samples. | ||
Fig. 3 shows the XPS results (the Si 2p spectra) for the pristine and milled SiO samples. The Si 2p XPS spectra show two dominant peaks at 102.9 and 99.5 eV with slight asymmetry in their shapes, which can be resolved into three peaks at 103.5, 102.8 and 102.0 eV and two peaks at 100.4 and 99.3 eV, respectively, by peak fitting. According to previous reports,41 these five peaks correspond to the binding energy positions of Si4+, Si3+, Si2+, Si+ and Si0, respectively, which indicates the presence of significant amounts of suboxides. This fact confirms that the amorphous SiO used in the present study consists of amorphous Si surrounded by the Si suboxide matrix, as extensively reported.27–29 On the basis of peak fitting, the amounts of various Si oxidation sates were calculated and summarized in Table 1. It is observed that the ball milling treatment induced a slight decrease in the amount of Si0 and Si+ while the amount of Si2+ and Si3+ states increased slightly.
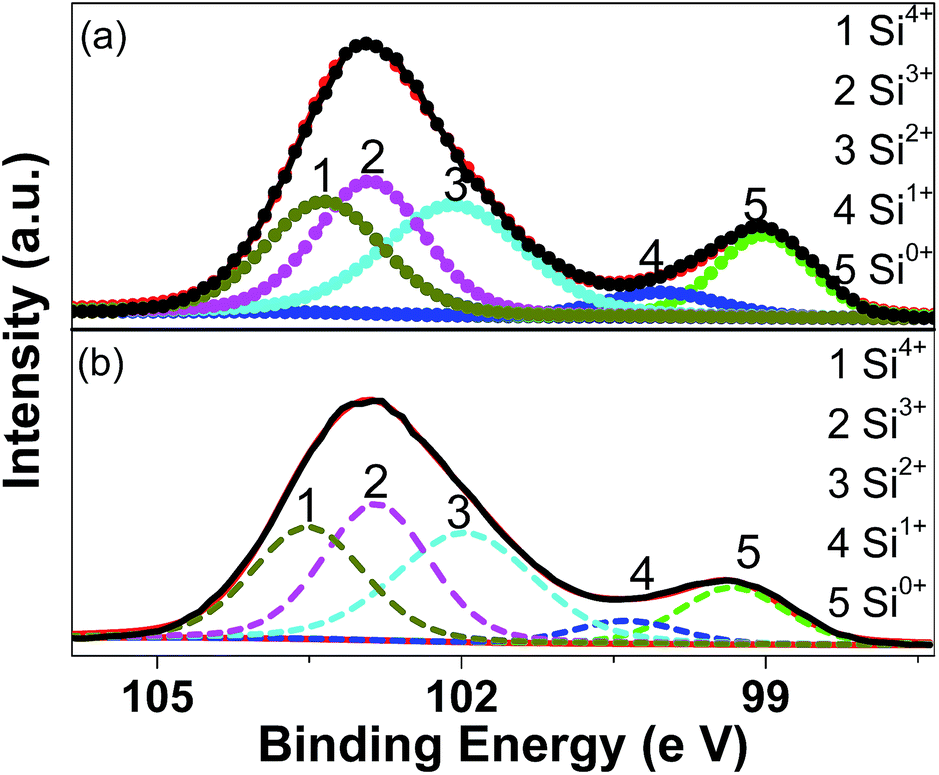 | ||
| Fig. 3 XPS spectra of Si 2p for pristine (a) and 10 h-milled (b) SiO samples. | ||
| Sample | Si0 (%) | Si+ (%) | Si2+ (%) | Si3+ (%) | Si4+ (%) |
|---|---|---|---|---|---|
| Pristine SiO | 14.5 | 5.2 | 29.1 | 26.9 | 24.2 |
| SiO milled for 10 h | 11.9 | 4.8 | 30.0 | 28.6 | 24.8 |
The electrochemical Li-storage performance of the pristine and milled SiO samples was evaluated by assembling CR2025 coin-type cells with Li metal as the counter and reference electrode. Fig. 4(a) illustrates the first charge/discharge curves at a current density of 100 mA g−1. All samples exhibited similar discharge/charge behaviours as Li insertion primarily occurred at voltages below 0.2 V and Li extraction primarily occurred at voltages below 0.65 V without evident discharge/charge plateaus, which agrees well with the lithiation/delithiation process of the amorphous Si.42 Interestingly, the ball-milling treatment increased the available electrochemical Li-storage capacity. The pristine SiO electrode delivered an initial discharge capacity of 2329 mA h g−1 and a charge capacity of 1827 mA h g−1 with a calculated coulombic efficiency of 78%. After 10 h of ball milling, the initial discharge capacity increased to 2684 mA h g−1 and the charge capacity increased to 2091 mA h g−1, which correspond to a 13% increase with respect to the pristine SiO electrode. Although the discharge and charge capacities were reduced to 2494 and 1951 mA h g−1, respectively, when ball-milling time was further extended to 12 h, these values are still higher than those of the pristine SiO electrode. As stated above, the ball-milling treatment dramatically reduced the particle size of SiO, which enlarged the specific surface area and shortened the mass transport distance and consequently increased the utilization efficiency of the active materials. This explains the enhanced discharge/charge capacities of the milled SiO anode.
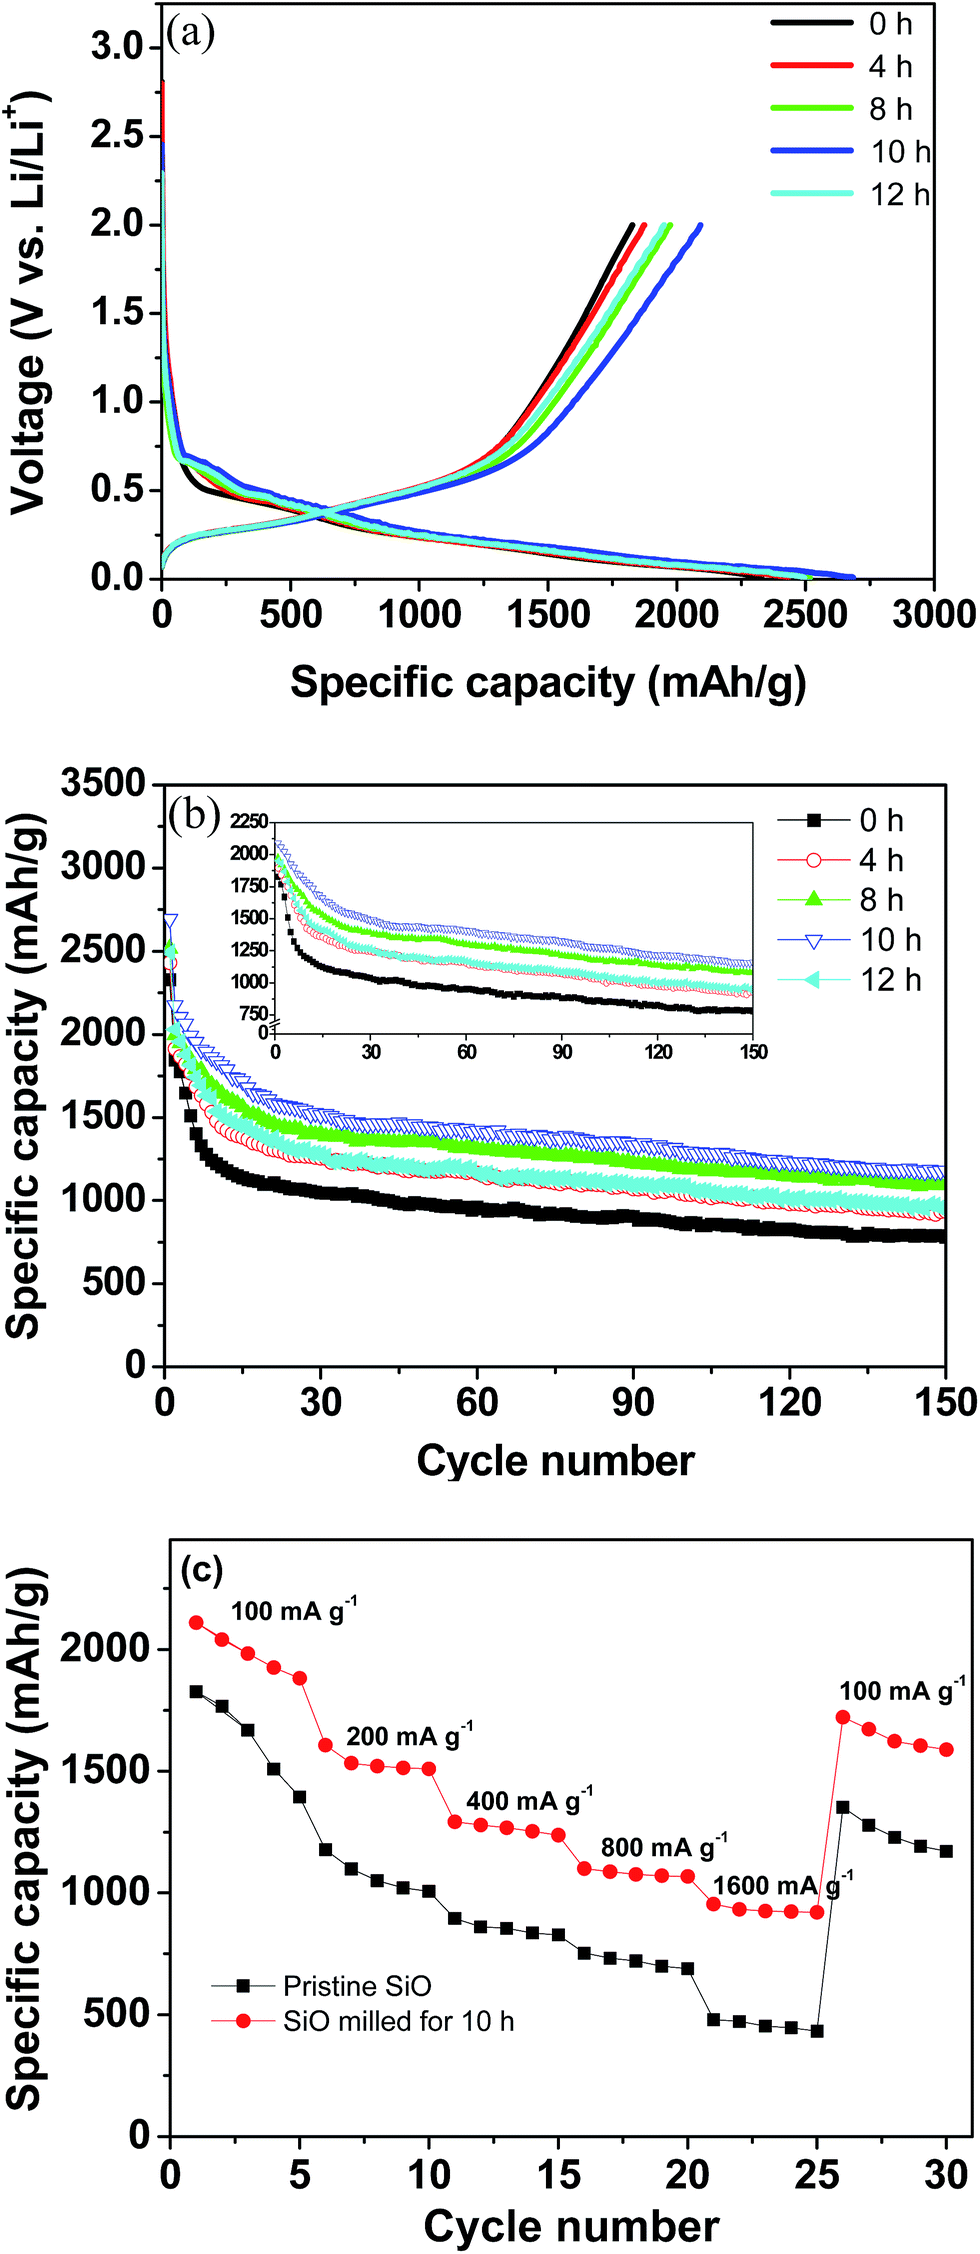 | ||
| Fig. 4 Electrochemical performance of the pristine and milled SiO samples. (a) First discharge/charge curves, (b) cycling performance, and (c) rate capacity. | ||
Fig. 4(b) shows the discharge capacity curves plotted against the cycle number of the pristine and milled SiO samples. It is clear that upon cycling, the fading process of the discharge capacities can be divided into two domains for both the pristine and milled SiO samples. In the first 15 cycles, the discharge capacities rapidly declined, and then they slightly but gradually decreased with further cycling. A similar phenomenon was also observed for the charge capacities, as shown in inset of Fig. 4(b). In spite of the identical fading tendencies, the milled SiO anodes exhibited a significantly better cycling stability than the pristine SiO anodes. After 150 cycles, the reversible capacity of the 10 h-milled SiO anode remained at 1159 mA h g−1 and the capacity retention was determined to be 55.4%. However, the reversible capacity was reduced to 777 mA h g−1 for the pristine SiO anode, which corresponds to a retention of 42.5%. Encouragingly, the cycling capacity retention of the SiO anode increased by 30% after the 10 h ball-milling treatment.
Moreover, the rate capability of the SiO anode was also improved by ball milling treatment. As shown in Fig. 4(c), it was seen that the 10 h-milled SiO anode delivered a reversible capacity of approximately 930 mA h g−1 at a current density as high as 1600 mA g−1. However, the reversible capacity of the pristine SiO anode was only 450 mA h g−1 at the same current density. The improved rate performance of the milled SiO anode can be attributed to the reduced particle size, which increases the specific surface area and shortens the diffusion distance.
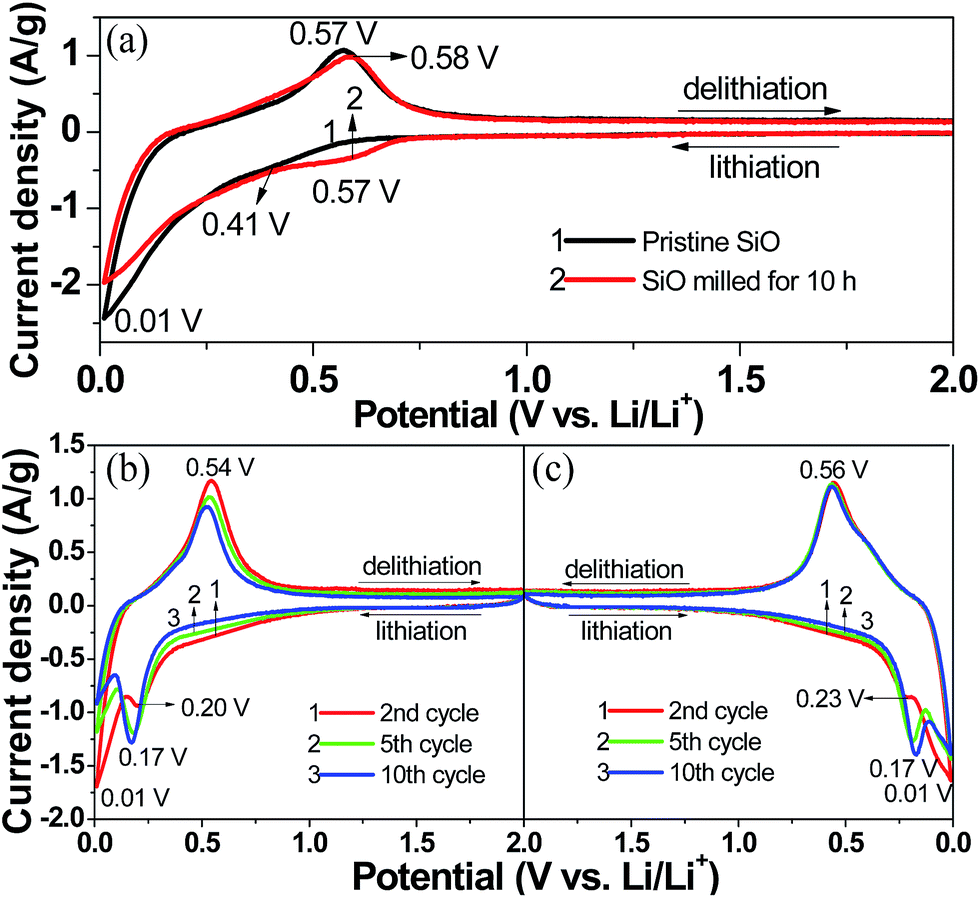
Fig. 5(a) compares the first CV curves of the pristine and 10 h-milled SiO anodes between 0.01 and 2 V at a scan rate of 0.1 mV s−1. In the cathodic scan, the pristine SiO started inserting lithium at approximately 0.57 V. As the cathodic scan progressed, a weak shoulder at 0.30–0.57 V and a distinct peak at 0.01 V emerged in the CV curve, which correspond to the formation of a solid electrolyte interphase (SEI) film and the lithiation of Si-based active species, respectively, as was previously reported.43,44 The anodic peak appeared with considerable intensity at 0.45–0.70 V, which agrees well with the delithiation reaction of the Li–Si alloy.45 The 10 h-milled SiO exhibited a very similar CV behaviour as the pristine sample except for an obvious increase in the initial lithiation potential (∼0.72 V). This is closely related to the increased reactivity caused by the reduced particle size and the enhanced specific surface area. In the second scan, the weak shoulder that is assigned to the formation of the SEI film disappeared. Moreover, upon cycling, a new cathodic peak at approximately 0.17 V developed and gradually intensified along with the weakening of the peak at 0.01 V, as observed in the CV curves of both the pristine (Fig. 5(b)) and 10 h-milled (Fig. 5(c)) SiO samples. This is in good agreement with the lithiation behaviour of amorphous Si.15
 | ||
| Fig. 5 CV curves of the pristine and 10 h-milled SiO anodes. (a) 1st cycle, (b) 2–5 cycles for the pristine sample, (c) 2–5 cycles for the 10 h-milled sample. | ||
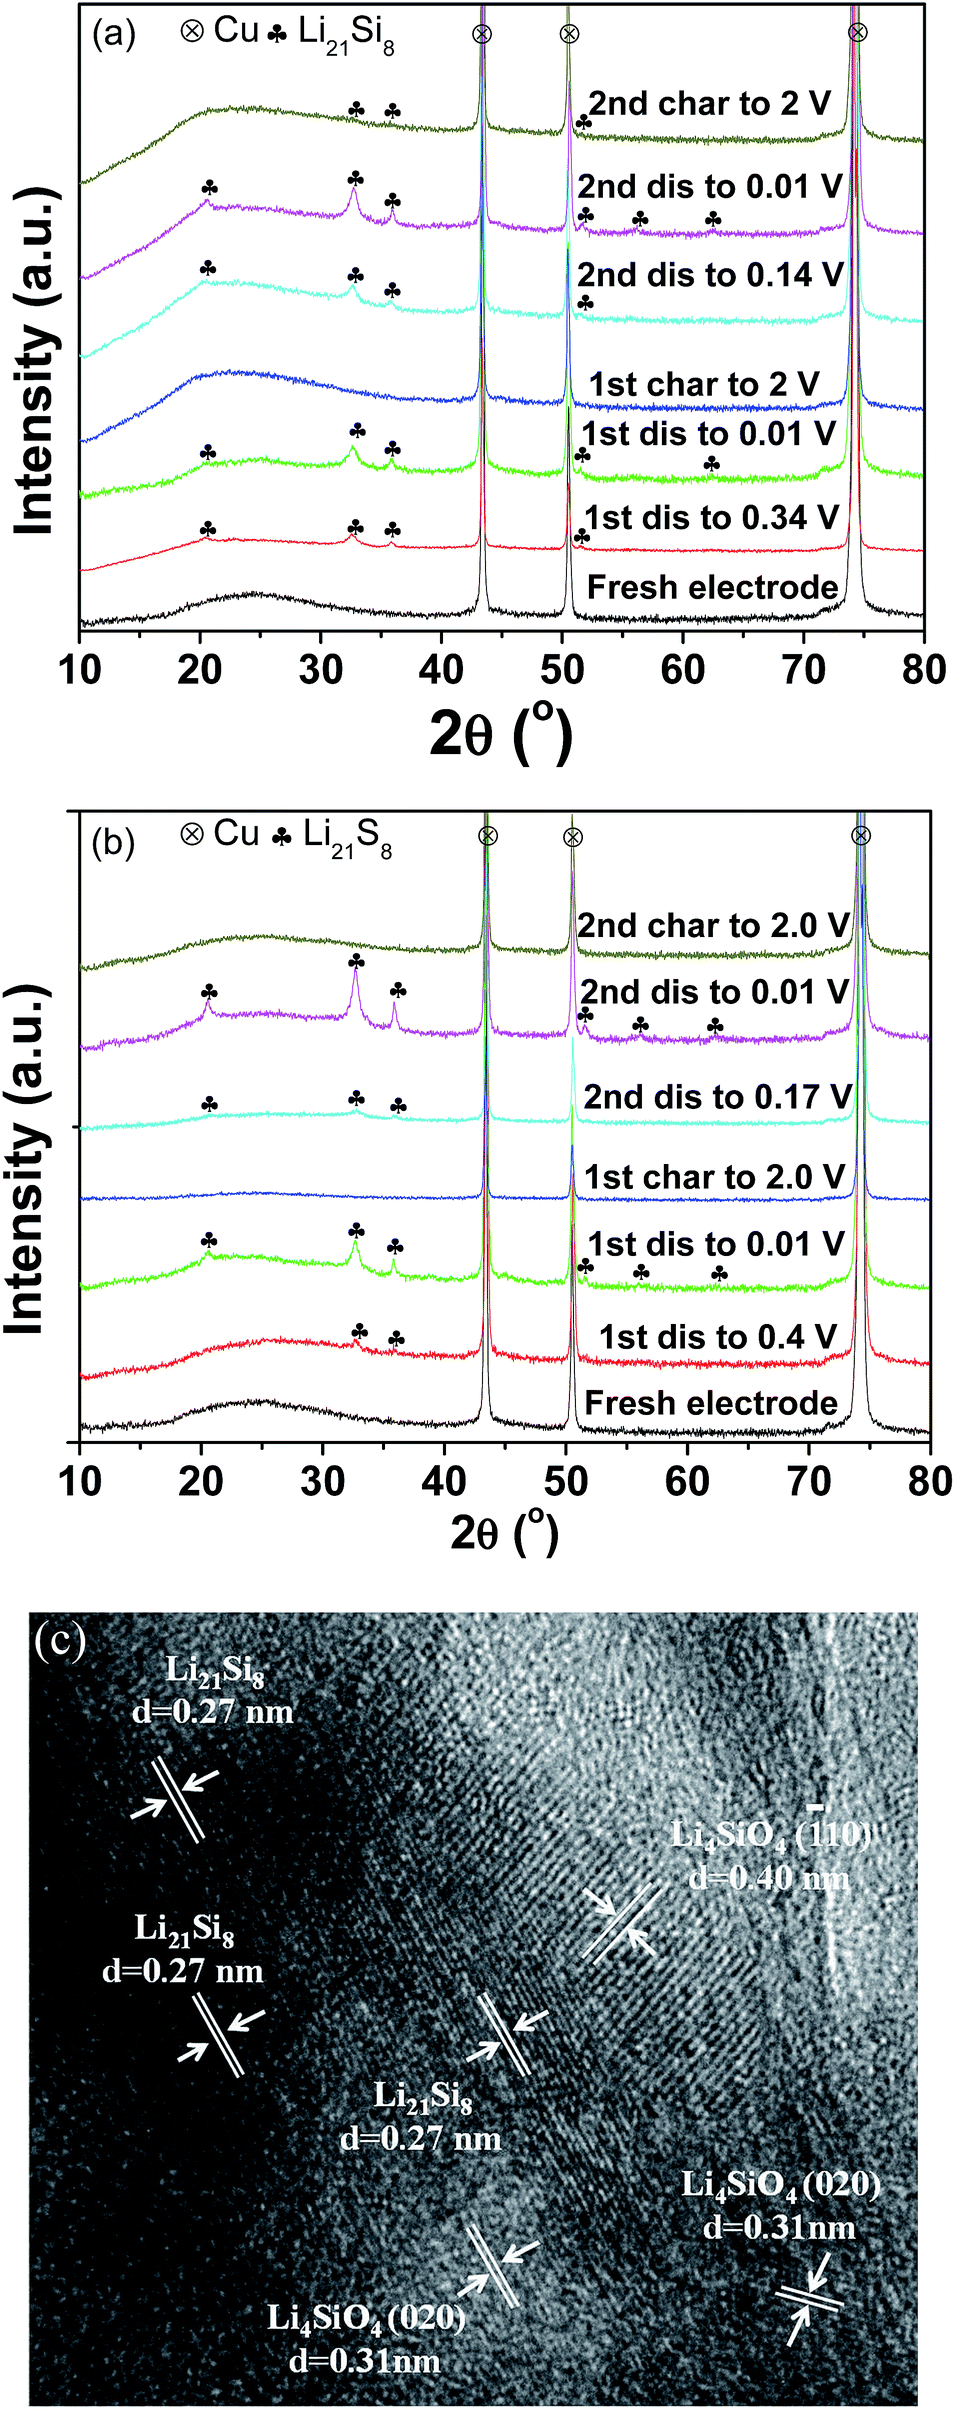
To shed light on the lithiation/delithiation mechanism of the pristine and milled SiO, the samples collected at different charge/discharge stages were subject to XRD analyses. The results are shown in Fig. 6(a) and (b). It was observed that the pristine and milled samples exhibited nearly identical XRD changes in the first discharging/charging process. While discharging to 0.01 V, the characteristic reflection of Li21Si8 developed gradually and intensified. In the charging process, the active sample recovered its amorphous state. These results indicate that Si is the major active species in this case. Further HRTEM observation confirmed that the sample initially discharged to 0.01 V was mainly composed of Li21Si8 (Fig. 6(c)). Meanwhile, nanocrystalline Li4SiO4 was also identified from the interplanar distances of 0.31 and 0.40 nm, which correspond to the separations between the (020) and (![[1 with combining macron]](https://www.rsc.org/images/entities/char_0031_0304.gif) 10) planes, respectively. According to the discussion above, it can be determined that in the first discharging/charging process, the active Si was lithiated and converted to Li21Si8, and the Si suboxides reacted with Li to form Li4SiO4. Thus, the reversible electrochemical capacity mainly originated from the lithiation/delithiation of Si. The formation of Li4SiO4 contributed a large irreversible capacity and is responsible for the low initial coulombic efficiency.
10) planes, respectively. According to the discussion above, it can be determined that in the first discharging/charging process, the active Si was lithiated and converted to Li21Si8, and the Si suboxides reacted with Li to form Li4SiO4. Thus, the reversible electrochemical capacity mainly originated from the lithiation/delithiation of Si. The formation of Li4SiO4 contributed a large irreversible capacity and is responsible for the low initial coulombic efficiency.
 | ||
| Fig. 6 XRD patterns of the pristine (a) and 10 h-milled (b) SiO anodes at different discharge/charge states; HRTEM image (c) of the 10 h-milled anode discharged to 0.01 V in the first cycle. | ||
Fig. 7(a) and (b) present the XRD patterns of the pristine and milled SiO anodes charged to 2.0 V as a function of the cycles. As shown in Fig. 7(a), Li21Si8 reflections were observed in the sample charged to 2.0 V after the 2nd cycle, and their intensities were somewhat increased after further cycling. This indicates that upon cycling, partial Li was trapped in the pristine sample and contributed to some of the irreversible capacity observed, which should be a reason for the capacity fading of the pristine SiO sample. Interestingly, no Li trapping was detected for the 10 h-milled sample even after 10 cycles (Fig. 7(b)), which consequently explains its improved cycling stability.
 | ||
| Fig. 7 XRD patterns of the pristine (a) and 10 h-milled (b) SiO anodes charged to 2.0 V at different cycles. | ||
Fig. 8(a)–(f) displays the photographs of the cycled wafer electrodes of the pristine and milled SiO. It is clear that for the pristine SiO sample, the exposed Cu current collector was observed only after 10 cycles, which can be attributed to the exfoliation of active materials due to the pulverization and fracture caused by the large volume change upon discharging/charging. This notion was further evidenced by the SEM images. As shown in Fig. 9, there are a large number of cracks and interstices, and even a degree of collapse, on the surface of the electrode after 10 and 150 cycles. This induces a poor cycling stability, as shown in Fig. 4(b). Encouragingly, the 10 h-milled SiO electrode exhibited good integrity even after 50 cycles, and only small amounts of the active materials were exfoliated (Fig. 8(f)). Further observation using SEM revealed that the surface of the cycled 10 h-milled SiO anode was relatively smooth, with only some small cracks observed (Fig. 9(e) and (f)), even after 150 cycles. These results indicate that the reduced particle size effectively retards the particle pulverization and fracture, therefore improving the cycling stability of the SiO anode. In addition, it should be mentioned that the surface state of the SiO anode was also superior to that of the milled Si anode (Fig. S2, ESI†), which reasonably explains the relatively better cycling durability of the SiO anode than that of the Si anode (Fig. S3, ESI†).
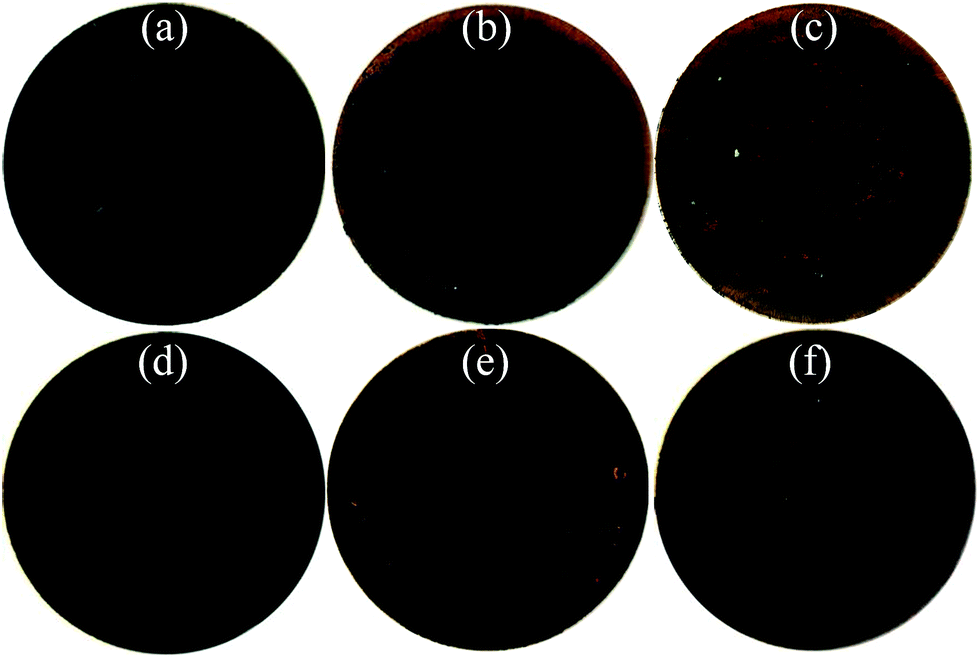 | ||
| Fig. 8 Photographs of pristine (a–c) and 10 h-milled (d–f) SiO electrodes, (a and d) before cycling, (b and e) after 10 cycles, and (c and f) after 50 cycles. | ||
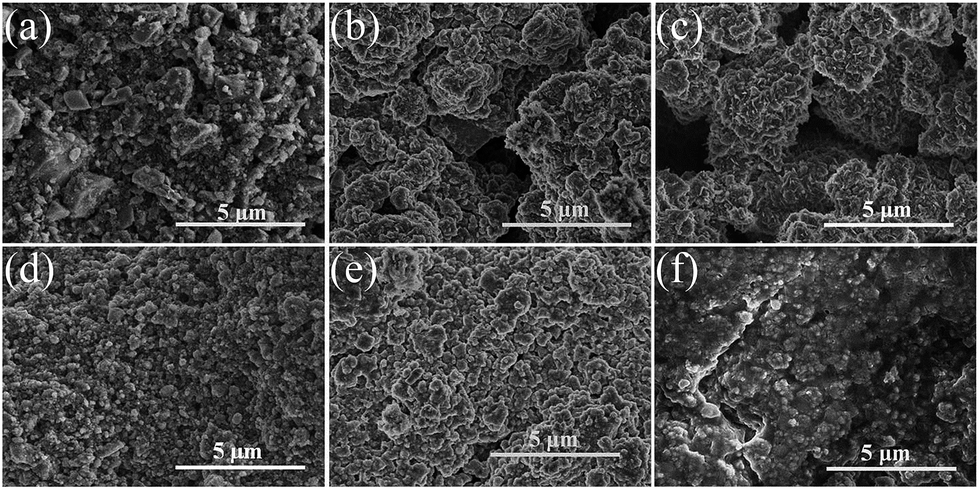 | ||
| Fig. 9 SEM images of pristine (a–c) and 10 h-milled (d–f) SiO electrodes, (a and d) before cycling, (b and e) after 10 cycles, and (c and f) after 150 cycles. | ||
To evaluate the effect of particle size on the formation of SEI film and the surface electrochemical activity, EIS measurement was conducted under delithiation state after 1 and 150 cycles, and data were analysed by fitting to an equivalent electrical circuit. The results are shown in Fig. 10 and Table 2. As shown in Fig. 10(d), Rel represents the electrolyte resistance; Rsei is the resistance of the SEI film, which corresponds to the first semicircle at the high frequency range; Rct is the charge transfer resistance through the electrode/electrolyte interface, which corresponds to the middle semicircle at the medium frequency range; the Warburg resistance (Wo) is related to the impedance of lithium-ions diffusion in the electrode, which corresponds to the inclined line at the low frequency range; and CPEsei and CPEct are constant phase elements of the SEI film and the electrode electrolyte interface, respectively.46 The fitting results presented a distinct increase in the Rsei and Rct values upon cycling, which should be the most important reasons for the capacity fading. However, it is worth highlighting that the Rsei and Rct values of the 10 h-milled SiO anode are largely smaller than those of the pristine sample. As shown in Table 2, the Rsei value of the pristine SiO anode was determined to be 68.3 Ω after 150 cycles, while it was only 32.7 Ω for the 10 h-milled sample, suggesting that the reduced particle size induces a relatively stable surface SEI film due to the restrained particle pulverization. It is clear that in Fig. S4 and S5 (ESI†), a smooth, integrated organic layer was observed on the electrode surface of the 10 h-milled sample even after 150 cycles. Further XPS depth analyses revealed that the SEI layer of the 10 h-milled SiO is slightly thinner than that of the pristine sample because the intensity of Si 2p XPS peak is more fastly increased upon sputtering for the milled SiO electrode than that for the pristine SiO electrode (Fig. S6, ESI†). As for Rct, it was estimated to be 84.2 Ω for the 10 h-milled SiO anode after 150 cycles, which is less than 1/2 of the charge-transfer resistance of the pristine sample (198.3 Ω). This should be closely related to the enhanced specific surface area as a result of the reduced particle size. In addition, the relatively stable, thin surface SEI film is also helpful to persist a good electrochemical reactivity, which is another reason for the smaller Rct value of the milled SiO anode.
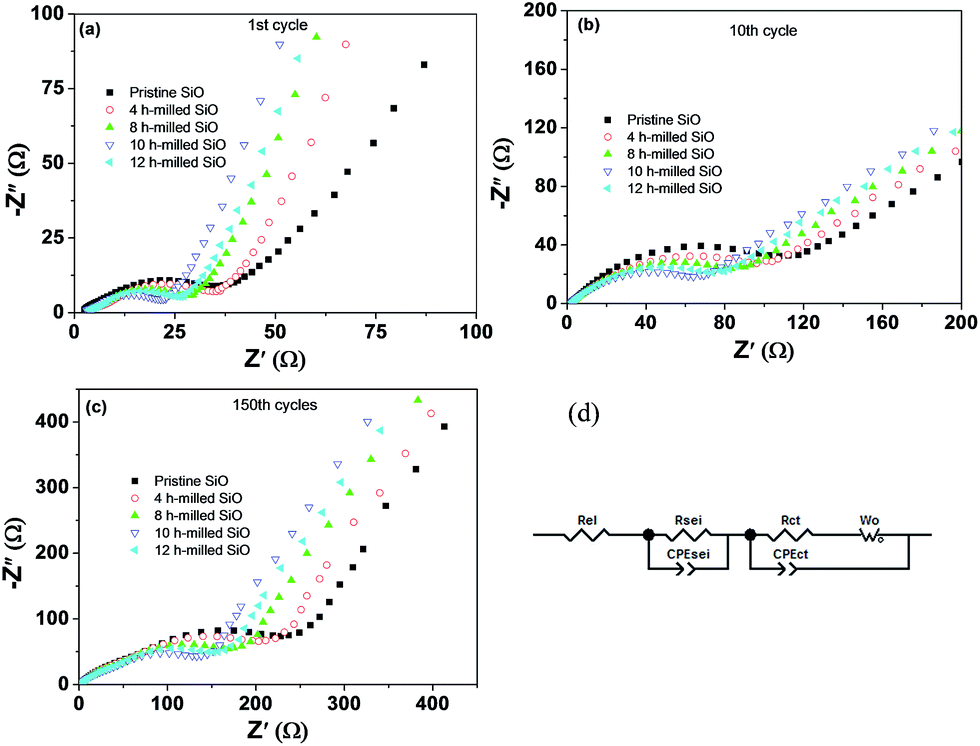 | ||
| Fig. 10 EIS spectra of pristine and 10 h-milled SiO electrodes after different cycles (a–c) and the equivalent circuit (d). | ||
| Sample | 1st cycle | 10th cycle | 150th cycle | |||
|---|---|---|---|---|---|---|
| Rsei (Ω) | Rct (Ω) | Rsei (Ω) | Rct (Ω) | Rsei (Ω) | Rct (Ω) | |
| Pristine SiO | 11.6 | 13.1 | 37.3 | 123.2 | 68.3 | 198.3 |
| SiO milled for 4 h | 9.3 | 12.3 | 32.9 | 98.6 | 57.6 | 159.5 |
| SiO milled for 8 h | 7.7 | 11.9 | 28.5 | 70.4 | 47.3 | 123.4 |
| SiO milled for 10 h | 6.0 | 10.7 | 21.9 | 43.4 | 32.7 | 84.2 |
| SiO milled for 12 h | 7.0 | 11.4 | 25.2 | 53.1 | 42.9 | 108.5 |
Conclusions
The particle size-dependence of electrochemical Li storage properties of silicon monoxide (SiO) is systematically investigated. Commercial SiO was subjected to ball milling on a planetary ball mill at 300 rpm to obtain powder particles of different sizes. XRD results showed the typical amorphous nature for the SiO samples before and after ball milling. Ball milling induced a remarkable reduction in the particle size of SiO. After 10 h of ball milling, the particle size reduced from larger than 5 μm to below 500 nm with good dispersion of the particles. BET analyses indicated that the specific surface area increased from 0.9 m2 g−1 for pristine SiO to 20.1 m2 g−1 for the 10 h-milled sample, which represents a more than 21 times increase in the specific surface area. XPS results revealed that the pristine SiO composed of Si4+, Si3+, Si2+, Si+ and Si0, and the ball-milling treatment induced a slight decrease in the amount of Si0 and Si+ while the amount of Si2+ and Si3+ states increased slightly. Galvanostatic charge/discharge experiments showed an initial discharge capacity of 2684 mA h g−1 and a charge capacity of 2091 mA h g−1, which corresponds to a 13% increase with respect to the pristine SiO sample. After 150 cycles, the reversible capacity of the 10 h-milled SiO anode remained at 1159 mA h g−1 and the capacity retention was determined to be 55.4%. However, the reversible capacity was only 777 mA h g−1 for the pristine SiO anode, which corresponds to a retention of 42.5%. Structural and morphological examination revealed that ball-milling treatment significantly reduced the particle size, enlarged the specific surface area and shortened the mass transport distance of SiO, which effectively increased the utilization efficiency of the active materials and restrained the particle pulverization and fracture. Therefore, the ball-milling treatment improved the electrochemical performance of the SiO anode.Acknowledgements
We gratefully acknowledge the financial support received from the National Natural Science Foundation of China (51471152, 51571178), the National Materials Genome Project (2016YFB0700600), and the National Youth Top-Notch Talent Support Program.Notes and references
- G. Jeong, Y. Kim, H. Kim, Y. Kim and H. Sohn, Energy Environ. Sci., 2011, 4, 1986–2002 CAS.
- M. Armand and J. M. Tarascon, Nature, 2008, 451, 652–657 CrossRef CAS PubMed.
- J. M. Tarascon and M. Armand, Nature, 2001, 414, 359–367 CrossRef CAS PubMed.
- Y. Wang and J. R. Dahn, J. Electrochem. Soc., 2006, 153, A2188–A2191 CrossRef CAS.
- T. D. Hatchard and J. R. Dahn, J. Electrochem. Soc., 2004, 151, A838–A842 CrossRef CAS.
- H. Kim, M. Seo, M. Park and J. Cho, Angew. Chem., Int. Ed., 2010, 49, 2146–2149 CrossRef CAS PubMed.
- X. H. Liu, L. Zhong, S. Huang, S. X. Mao, T. Zhu and J. Y. Huang, ACS Nano, 2012, 6, 1522–1531 CrossRef CAS PubMed.
- D. Kang, J. A. Corno, J. L. Gole and H. Shin, J. Electrochem. Soc., 2008, 155, A276–A281 CrossRef CAS.
- B. M. Bang, H. Kim, J. Lee, J. Cho and S. Park, Energy Environ. Sci., 2011, 4, 3395–3399 CAS.
- B. M. Bang, H. Kim, H. Song, J. Cho and S. Park, Energy Environ. Sci., 2011, 4, 5013–5019 CAS.
- Z. Bao, M. R. Weatherspoon, S. Shian, Y. Cai, P. D. Graham, S. M. Allan, G. Ahmad, M. B. Dickerson, B. C. Church, Z. Kang, H. W. I. Abernathy, C. J. Summers, M. Liu and K. H. Sandhage, Nature, 2007, 446, 172–175 CrossRef CAS PubMed.
- H. Kim, B. Han, J. Choo and J. Cho, Angew. Chem., Int. Ed., 2008, 47, 10151–10154 CrossRef CAS PubMed.
- F. M. Courtel, D. Duguay, Y. Abu-Lebdeh and I. J. Davidson, J. Power Sources, 2012, 202, 269–275 CrossRef CAS.
- J. Lee, N. Choi and S. Park, Energy Environ. Sci., 2012, 5, 7878–7882 CAS.
- S. Bourderau, T. Brousse and D. M. Schleich, J. Power Sources, 1999, 81, 233–236 CrossRef.
- A. A. Arie, J. O. Song and J. K. Lee, Mater. Chem. Phys., 2009, 113, 249–254 CrossRef CAS.
- J. Graetz, C. C. Ahn, R. Yazami and B. Fultz, Electrochem. Solid-State Lett., 2003, 6, A194–A197 CrossRef CAS.
- A. Magasinski, P. Dixon, B. Hertzberg, A. Kvit, J. Ayala and G. Yushin, Nat. Mater., 2010, 9, 353–358 CrossRef CAS PubMed.
- T. Zhang, J. Gao, L. J. Fu, L. C. Yang, Y. P. Wu and H. Q. Wu, J. Mater. Chem., 2007, 17, 1321–1325 RSC.
- Y. Liu, Z. Y. Wen, X. Y. Wang, A. Hirano, N. Imanishi and Y. Takeda, J. Power Sources, 2009, 189, 733–737 CrossRef CAS.
- S. Iwamura, H. Nishihara and T. Kyotani, J. Phys. Chem. C, 2012, 116, 6004–6011 CAS.
- J. Luo, X. Zhao, J. Wu, H. D. Jang, H. H. Kung and J. Huang, J. Phys. Chem. Lett., 2012, 3, 1824–1829 CrossRef CAS PubMed.
- A. M. Chockla, M. G. Panthani, V. C. Holmberg, C. M. Hessel, D. K. Reid, T. D. Bogart, J. T. Harris, C. B. Mullins and B. A. Korgel, J. Phys. Chem. C, 2012, 116, 11917–11923 CAS.
- D. Wang, M. Gao, H. Pan, J. Wang and Y. Liu, J. Power Sources, 2014, 256, 190–199 CrossRef CAS.
- S. Sim, P. Oh, S. Park and J. Cho, Adv. Mater., 2013, 25, 4498–4503 CrossRef CAS PubMed.
- H. Wu, G. Chan, J. W. Choi, I. Ryu, Y. Yao, M. T. McDowell, S. W. Lee, A. Jackson, Y. Yang, L. Hu and Y. Cui, Nano Today, 2012, 7, 309–314 CrossRef.
- K. Schulmeister and W. Mader, J. Non-Cryst. Solids, 2003, 320, 143–150 CrossRef CAS.
- M. Miyachi, H. Yamamoto, H. Kawai, T. Ohta and M. Shirakata, J. Electrochem. Soc., 2005, 152, A2089–A2091 CrossRef CAS.
- T. Zhang, J. Gao, H. P. Zhang, L. C. Yang, Y. P. Wu and H. Q. Wu, Electrochem. Commun., 2007, 9, 886–890 CrossRef CAS.
- A. Netz and R. A. Huggins, Solid State Ionics, 2004, 175, 215–219 CrossRef CAS.
- J. Kim, H. Sohn, H. Kim, G. Jeong and W. Choi, J. Power Sources, 2007, 170, 456–459 CrossRef CAS.
- W. Liu, Y. Yen, H. Wu, M. Winter and N. Wu, J. Appl. Electrochem., 2009, 39, 1643–1649 CrossRef CAS.
- K. W. Lim, J. Lee, J. Yang, Y. Kim, H. Y. Jeong, S. Park and H. S. Shin, ACS Appl. Mater. Interfaces, 2014, 6, 6340–6345 CAS.
- G. Jeong, J. Kim, Y. Kim and Y. Kim, J. Mater. Chem., 2012, 22, 7999–8004 RSC.
- X. Hou, J. Wang, M. Zhang, X. Liu, Z. Shao, W. Li and S. Hu, Silicon, 2014, 4, 34615–34622 CAS.
- J. Woo, S. Baek, J. Park, Y. Jeong and J. H. Kim, J. Power Sources, 2015, 299, 25–31 CrossRef CAS.
- C. Doh, C. Park, H. Shin, D. Kim, Y. Chung, S. Moon, B. Jin and H. Kim, J. Power Sources, 2008, 179, 367–370 CrossRef CAS.
- C. Guo, D. Wang, Q. Wang, B. Wang and T. Liu, Int. J. Electrochem. Sci., 2012, 7, 8745–8752 CAS.
- J. H. Yom, J. K. Lee and W. Y. Yoon, J. Appl. Electrochem., 2015, 45, 397–403 CrossRef CAS.
- B. Liu, A. Abouimrane, Y. Ren, M. Balasubramanian, D. Wang, Z. Z. Fang and K. Amine, Chem. Mater., 2012, 24, 4653–4661 CrossRef CAS.
- A. Hohl, T. Wieder, P. A. van Aken, T. E. Weirich, G. Denninger, M. Vidal, S. Oswald, C. Deneke, J. Mayer and H. Fuess, J. Non-Cryst. Solids, 2003, 320, 255–280 CrossRef CAS.
- M. N. Obrovac and L. Christensen, Electrochem. Solid-State Lett., 2004, 7, A93–A96 CrossRef CAS.
- M. Zhou, M. L. Gordin, S. Chen, T. Xu, J. Song, D. Lv and D. Wang, Electrochem. Commun., 2013, 28, 79–82 CrossRef CAS.
- X. Yang, Z. Wen, X. Xu, B. Lin and S. Huang, J. Power Sources, 2007, 164, 880–884 CrossRef CAS.
- B. Yu, Y. Hwa, C. Park and H. Sohn, J. Mater. Chem. A, 2013, 1, 4820–4825 CAS.
- S. Yang, H. Song and X. Chen, Electrochem. Commun., 2006, 8, 137–142 CrossRef CAS.
Footnote |
| † Electronic supplementary information (ESI) available: Fig. S1–S6. See DOI: 10.1039/c6ra25714c |
| This journal is © The Royal Society of Chemistry 2017 |