 Open Access Article
Creative Commons Attribution 3.0 Unported Licence
Novel core–shell structured Si/S-doped-carbon composite with buffering voids as high performance anode for Li-ion batteries
Dan Shaoab,
Inna Smolianovaac,
Daoping Tanga and
Lingzhi Zhang *a
*a
aKey Laboratory of Renewable Energy, Guangzhou Institute of Energy Conversion, Chinese Academy of Sciences, Guangzhou 510640, China
bGuangzhou Institute of Energy Testing, Guangzhou 510170, China
cUniversity of Chinese Academy of Sciences, 19 Yu Quan Road, Beijing, 100049, China
First published on 12th January 2017
Abstract
A novel core–shell structured Si/S-doped-carbon composite with buffering voids (Si/v-SC), was prepared by a facile hydrothermal method using glucose as carbon source and simultaneously chemical polymerization of 3,4-ethylenedioxythiophene (EDOT) in the presence of Si@SiO2 nanoparticles, and followed by carbonization and removal of the SiO2 layer. The results showed that the Si nanoparticles were embedded in the S-doped-carbon buffer space to form a core–shell structure. Compared to the Si/carbon composite (Si/v-C) without S-doping in carbon layer, the Si/v-SC composite electrode showed improved cycling and rate performance, exhibiting a reversible capacity of 664 mA h g−1 over 300 cycles at the current of 0.4 A g−1 and a high capacity of 537 mA h g−1 even at 10 A g−1. The effects of S-doping on the properties of carbon material were further investigated. XRD and Raman test revealed that the S-doping increased the interspace of carbon crystal face, and improved the amorphous structure of carbon and thus the initial coulombic efficiency.
Introduction
Silicon (Si) is one of the most promising next generation anode materials for lithium-ion batteries (LIBs) due to its ultrahigh theoretical capacity (4200 mA h g−1) and the low Li-uptake potential.1–6 Unfortunately, the major obstacles to the practical use in LIBs for Si anode are its low intrinsic electrical conductivity and the severe volume change (400%) during the lithiation and delithiation processes which lead to the pulverization of Si active particles, unstable solid electrolyte interface film (SEI) on the surface of the Si anode and consequently causes rapid capacity decay of the cell.1–7Carbon is usually used as a matrix in the Si/carbon composites, aiming to utilize the good flexibility, conductivity and SEI formation ability of carbon component.8–10 The carbon matrix can not only act as conductive medium to compensate for the intrinsic low conductivity of Si component, but also accommodate the large volume variation of Si particles over cycling, thus improving the cycle stability and rate capability.11,12 Unfortunately, because of insufficient internal volume for accommodating the severe volume change of Si particles, especially over long cycling at high current density, these conventional Si/carbon composites show limited success for the use of anode materials in LIBs.13,14 Creating suitable voids between the carbon layer and Si particles in Si/carbon composite facilitates to further buffer the volume variation of Si is one of effective methods to overcome this problem.15–17 Previously, we also reported a novel Si/porous-C composite with buffering voids.18 However, the carbon components in these Si composites usually cause a large irreversible capacity loss during the first cycle and correspondingly a low initial coulombic efficiency (CE), which limits the practical use of these Si/carbon composites in industry.18
Heteroatom such as S- and N-doped carbon as anode materials of LIBs have shown high lithiation capacity (even exceeding the theoretical capacity of graphitic carbon anode) and longer cycling life.19,20 We previously reported Si/3,4-ethylene-dioxythiophene:poly(styrenesulfonate) (PEDOT:PSS) and Si/S-doped-carbon composite as anode materials which exhibited extraordinary high CE.21,22 However, the cycling stability of these composites is not satisfied enough for the practical applications, due to the poor distribution of Si particles and the insufficient internal volume in the composite for accommodating the severe volume variation.
In this paper, a novel silicon/S-doped carbon composite, core–shell structured Si/S-doped carbon composite with buffering voids (Si/v-SC), was prepared by a facile hydrothermal method in the presence of Si nanoparticles, followed by a carbonizing process and subsequent removal of SiO2 template. The structural characterization and electrochemical properties of the composite have been investigated in detail. The effects of S-doping on the properties of carbon materials without coupling with Si nanoparticles were comparably investigated as a simplifying system.
Experiment
Materials
Si nanoparticles were purchased from Xuzhou Jie chuang New Material Technology Company. EDOT (99%) was purchased from Sigma-Aldrich Company. PSS (MW: 70![[thin space (1/6-em)]](https://www.rsc.org/images/entities/char_2009.gif) 000) was purchased from Acros Organics. Glucose (>99%), Fe2(SO4)3 (>99%) and (NH4)S2O8 (>98%) were obtained from Tianjin Fuchen Chemicals Reagent Factory. Hydrofluoric acid (HF) (≥40%) was purchased from Guangzhou Chemicals Reagent Company. The electrolyte of 1 M LiPF6 and 5% fluoroethylene carbonate (FEC) in ethylene carbonate (EC, >99.9%)/diethylene carbonate (DEC, >99.9%)/dimethyl carbonate (DMC, >99.9%) (v/v/v = 1
000) was purchased from Acros Organics. Glucose (>99%), Fe2(SO4)3 (>99%) and (NH4)S2O8 (>98%) were obtained from Tianjin Fuchen Chemicals Reagent Factory. Hydrofluoric acid (HF) (≥40%) was purchased from Guangzhou Chemicals Reagent Company. The electrolyte of 1 M LiPF6 and 5% fluoroethylene carbonate (FEC) in ethylene carbonate (EC, >99.9%)/diethylene carbonate (DEC, >99.9%)/dimethyl carbonate (DMC, >99.9%) (v/v/v = 1![[thin space (1/6-em)]](https://www.rsc.org/images/entities/char_2009.gif) :
:![[thin space (1/6-em)]](https://www.rsc.org/images/entities/char_2009.gif) 1
1![[thin space (1/6-em)]](https://www.rsc.org/images/entities/char_2009.gif) :
:![[thin space (1/6-em)]](https://www.rsc.org/images/entities/char_2009.gif) 1, water content < 20 ppm) was purchased from Zhangjiagang Guotai Huarong New Chemical Materials Company. All chemicals were used as received. The Celgard 2400 was employed as a separator.
1, water content < 20 ppm) was purchased from Zhangjiagang Guotai Huarong New Chemical Materials Company. All chemicals were used as received. The Celgard 2400 was employed as a separator.
Preparation of Si/v-SC composite
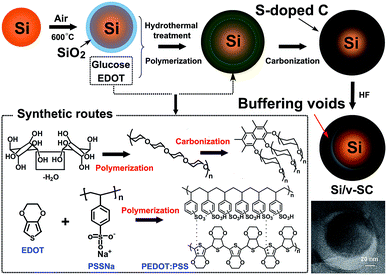
Si/v-SC was prepared by a facile hydrothermal method using glucose as carbon source and simultaneously chemical polymerization of 3,4-ethylenedioxythiophene (EDOT) as sulfur source in the presence of Si@SiO2 nanoparticles which obtained after oxidation of Si nanoparticles, followed by carbonization and removal of the SiO2 layer. The schematic fabrication process of Si/v-SC was illustrated in Fig. 1. In a typical procedure, Si nanoparticles (0.3 g) was calcined in an air atmosphere at 600 °C for 3 h to form a layer of SiO2 coating on the surface to get Si@SiO2 nanoparticles (0.35 g). EDOT (0.3 g) was added to a solution of PSS (0.58 g) in 30 mL deionized water, and stirred further for 2 h. Glucose (1 g) was then added into the above solution. After stirring for 2 h, the catalyst solution of (NH4)S2O8 (0.5 g)/Fe2(SO4)3 (2 mg) was then added to the reaction mixture. In this solution, Si@SiO2 nanoparticles (0.35 g) was added and dispersed by sonication for 2 h. This suspension was then heat-treated in a sealed steel autoclave at 150 °C for 6 h under an Ar atmosphere at a heating rate of 3 °C min−1. A solid precipitate (noted as Si/v-SC-P) was recovered, washed with water/ethanol, dried under vacuum at 60 °C for 24 h, and then calcined at 800 °C for 3 h under Ar atmosphere. The obtained composite was then treated with 10 wt% HF solution for 2 h to remove the SiO2 layer. The final product of Si/v-SC composite was dried under vacuum at 60 °C for 24 h after centrifugation and washing with water/ethanol. As comparison, Si/carbon composite with buffering voids composite (Si/v-C) was prepared through the same method without the S-containing EDOT, PSS and (NH4)S2O8/Fe2(SO4)3.In order to investigate the effects of S-doping on the properties of carbon matrix, S-doped carbon materials with different S-doping contents were prepared. EDOT (0, 0.05, 0.1, 0.2, 0.3 g) was added to a solution of PSS (0, 0.1, 0.2, 0.4, 0.6 g) in 30 mL deionized water, respectively, and stirred further for 2 h. Glucose (1 g) was then added into the above solution. After stirring for 2 h, the catalyst solution of (NH4)S2O8 (0, 0.08, 0.16, 0.33, 0.5 g)/Fe2(SO4)3 (0, 0.32, 0.64, 1.32, 2 mg) was then added in the corresponding solution. The suspension was then heat-treated in a sealed steel autoclave at 150 °C for 6 h at a heating rate of 3 °C min−1. Solid precipitate was recovered, washed with water/ethanol, dried under vacuum at 60 °C for 24 h, and then calcined at 800 °C for 3 h under Ar gas protection. The obtained product noted as SC-1, SC-2, SC-3, SC-4 and SC-5, respectively.
Characterization
Fourier transform infrared spectra (FTIR) were carried out on a tensor 27 spectrometer from 4000 to 400 cm−1 (Bruker, Germany). The morphology and microstructure of samples were characterized by transmission electron microscope (TEM) (JEOL JEM 2100F, Japan) and scanning electron microscope (SEM) (Hitachi S-4800, Japan). The conductivity of the products was measured through 2-wire Ohms method using the IM6e electrochemical workstation (Zahner, Germany) at 25 °C. The crystal structures and composition of samples were studied by X-ray diffraction (XRD) (PANALYTICAL, the Netherlands) and HR800 Confocal Raman system (HORIBA Jobin Yvon, France). The XPS spectra were obtained with ESCALAB250 XPS (Thermo Fisher Scientific, USA) at 2 × 10⁻⁹ mbar, using Al K (1486.6 eV) radiation at 15 keV of anode voltage. Thermogravimetric analysis measurements (TGA) were carried out on a STA409C/PC-PFEIFFER VACUUMTGA-7 analyzer (NETZSCH-Gertebau GmbH, Germany) in either air or an Ar atmosphere with a flow rate of 30 mL min−1 from 30 °C to 800 °C.Electrochemical measurement
Electrochemical measurements of samples were performed by coin-type half cells (CR2025) that were assembled in an Ar-filled glovebox. The working electrode were constructed as follows: 70 wt% active material, 20 wt% carbon black and 10 wt% carboxymethyl cellulose in an aqueous solution were mixed, and the slurry was coated on a copper foil at room temperature and dried under vacuum at 60 °C overnight and then pressed to obtain the electrode sheets. The loading level of the active material is 0.7, 0.4 and 0.5 mg cm−2 for Si, Si/v-C and Si/v-SC electrode, respectively. The counter electrode was Li foil, the separator was Celgard 2400 and the electrolyte solution was 1 M LiPF6 EC/DEC/DMC (v/v/v = 1![[thin space (1/6-em)]](https://www.rsc.org/images/entities/char_2009.gif) :
:![[thin space (1/6-em)]](https://www.rsc.org/images/entities/char_2009.gif) 1
1![[thin space (1/6-em)]](https://www.rsc.org/images/entities/char_2009.gif) :
:![[thin space (1/6-em)]](https://www.rsc.org/images/entities/char_2009.gif) 1) with 5% FEC. The cells were aged for 24 h before further measurements. A galvanostatic cycling test of the assembled cells was carried out on a Shenzhen Neware battery cycler (China) at various rates between cut-off voltages of 0.01 and 1.5 V (vs. Li/Li+) at 25 °C. Electrochemical impedance spectroscopic (EIS) and cyclic voltammetry (CV) measurements were recorded on an IM6e electrochemical workstation (Zahner, Germany). EIS was measured by applying an oscillating voltage of 5 mV over the frequency ranging from 10−2 to 105 Hz. CV was conducted in cells at different scan rates from 10 mV to 1.5 V.
1) with 5% FEC. The cells were aged for 24 h before further measurements. A galvanostatic cycling test of the assembled cells was carried out on a Shenzhen Neware battery cycler (China) at various rates between cut-off voltages of 0.01 and 1.5 V (vs. Li/Li+) at 25 °C. Electrochemical impedance spectroscopic (EIS) and cyclic voltammetry (CV) measurements were recorded on an IM6e electrochemical workstation (Zahner, Germany). EIS was measured by applying an oscillating voltage of 5 mV over the frequency ranging from 10−2 to 105 Hz. CV was conducted in cells at different scan rates from 10 mV to 1.5 V.
Results and discussion
Structural characterization
Fourier transform infrared (FTIR) spectroscopy was used to characterize the formation of the Si/v-SC including the hydrothermal and carbonization process. As shown in Fig. 2a, the FTIR characteristic peak of C![[double bond, length as m-dash]](https://www.rsc.org/images/entities/char_e001.gif) O/C
O/C![[double bond, length as m-dash]](https://www.rsc.org/images/entities/char_e001.gif) C vibration band at 1705/1620 cm−1 in spectra of Si/v-SC-P confirmed the dehydration of glucose during the hydrothermal process.13 For Si/v-SC-P, the
C vibration band at 1705/1620 cm−1 in spectra of Si/v-SC-P confirmed the dehydration of glucose during the hydrothermal process.13 For Si/v-SC-P, the ![[double bond, length as m-dash]](https://www.rsc.org/images/entities/char_e001.gif) C–H deformation vibration peak of EDOT at 891 cm−1 disappeared. The –C–S– bond at 980 cm−1, the stretching vibration of the –C–O–C– bond at 1090 cm−1, and the C–C and C
C–H deformation vibration peak of EDOT at 891 cm−1 disappeared. The –C–S– bond at 980 cm−1, the stretching vibration of the –C–O–C– bond at 1090 cm−1, and the C–C and C![[double bond, length as m-dash]](https://www.rsc.org/images/entities/char_e001.gif) C stretches from thiophene ring at 1335 cm−1 appeared correspondingly, confirming the successful polymerization of 3,4-ethylenedioxythiophene (EDOT). For Si/v-SC, the typical bands of the thiophene ring at 1335 cm−1 from PEDOT disappeared, indicating that PEDOT was completely transformed into carbon after carbonization process.21 The content of Si and carbon in the Si/v-SC composite is estimated to be 61.7 and 38.3 wt%, based on the thermal gravimetric curves, respectively (Fig. 2b).
C stretches from thiophene ring at 1335 cm−1 appeared correspondingly, confirming the successful polymerization of 3,4-ethylenedioxythiophene (EDOT). For Si/v-SC, the typical bands of the thiophene ring at 1335 cm−1 from PEDOT disappeared, indicating that PEDOT was completely transformed into carbon after carbonization process.21 The content of Si and carbon in the Si/v-SC composite is estimated to be 61.7 and 38.3 wt%, based on the thermal gravimetric curves, respectively (Fig. 2b).
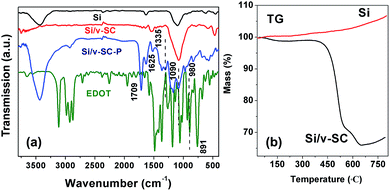 | ||
| Fig. 2 FTIR spectra of EDOT, Si, Si/v-SC-P and Si/v-SC (a). TG curves of Si and Si/v-SC under Ar atmospheres (b). | ||
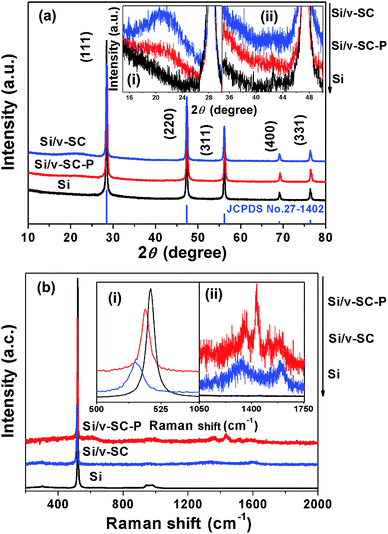
XRD and Raman measurement were conducted to further examine the structures of these samples. All of Si, Si/v-SC-P and Si/v-SC showed the characteristic diffraction peaks of Si at 2θ of about 28.4°, 47.4°, 56.2°, 69.2° and 76.5°, corresponding to the (111), (220), (311), (400) and (331) planes of Si crystals (JCPDS no. 27-1402), respectively (Fig. 3a).23,24 The peaks of Si remained indicate that the high temperature hydrothermal reaction and the followed carbonization process did not change the crystal structure of Si. For Si/v-SC, two weak and broad diffraction peaks were observed at about 23° and 43° corresponding to the amorphous carbon in the composite (Fig. 3a(i) and (ii)).25 Raman spectra of Si, Si/v-SC-P and Si/v-SC were presented in Fig. 3b. For all these samples, the characteristic peaks of Si were observed at 295, 520 and 940 cm−1. For both Si/v-SC-P and Si/v-SC, the peak at around 520 cm−1 was somewhat broadened and downshifted to lower wavenumber compared with Si (Fig. 3b(i)), probably due to a masking effect induced by carbon coating layer.13 For Si/v-SC-P, the characteristic peaks of PEDOT, the C–C inter-ring stretching vibration at 1267 cm−1, the C![[double bond, length as m-dash]](https://www.rsc.org/images/entities/char_e001.gif) C symmetrical/asymmetrical stretching vibration at 1433/1510 cm−1, were clearly observed (Fig. 3b(ii)).26 After carbonization, these characteristic peaks of PEDOT disappeared for Si/v-SC sample. The weak peaks at 1340 and 1580 cm−1 corresponding to the D and G band of carbon component, typical for amorphous carbon and crystalline graphite, were observed for Si/v-SC (Fig. 3b(ii)).24
C symmetrical/asymmetrical stretching vibration at 1433/1510 cm−1, were clearly observed (Fig. 3b(ii)).26 After carbonization, these characteristic peaks of PEDOT disappeared for Si/v-SC sample. The weak peaks at 1340 and 1580 cm−1 corresponding to the D and G band of carbon component, typical for amorphous carbon and crystalline graphite, were observed for Si/v-SC (Fig. 3b(ii)).24
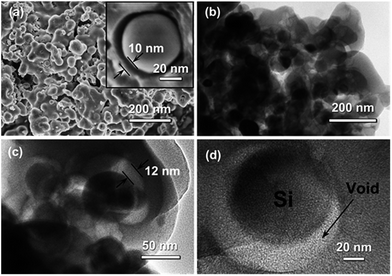
From SEM and TEM images of Si nanoparticles, the particle size of the bare Si nanoparticle ranges from 30 to 80 nm with a spherical shape (Fig. 4a and b). Fig. 4c showed that the Si@SiO2 nanoparticle ranged from 50 to 100 nm with a spherical shape, covered with a 10 nm thick SiO2 layer (Fig. 4c inset). The Si/v-SC-P composite consisted of the amorphous carbon coated Si@SiO2 (Fig. 4d). After the carbonization process and removal of SiO2 layer, a 10–12 nm thick space surrounded with Si nanoparticles was observed clearly for Si/v-SC (Fig. 5a). Consistent with the SEM result, TEM image also showed that the Si nanoparticles in Si/v-SC were buried in the carbon shell with buffering voids (Fig. 5b–d). SEM examination combined with EDS mapping for the elements Si, C and S are provided in Fig. 6. EDS analysis showed that the weight ratio of S in the Si/v-SC composite was 2 wt% (Fig. 6). For Si/v-SC, 5.2 wt% of the S element was doped in the carbon component in the Si/v-SC composite. The bright regions are relevant to the presence of the elements Si, C and S, indicating that S and C are distributed homogenously covered the Si nanoparticles (Fig. 6b–d).
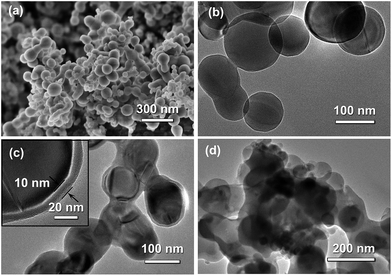 | ||
| Fig. 4 SEM image (a) and TEM image (b) of Si nanoparticles. TEM image of Si@SiO2 (c) and Si/v-SC-P (d) particles. | ||
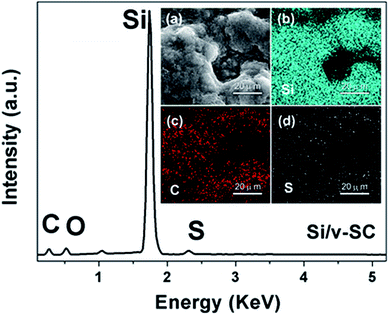 | ||
| Fig. 6 EDS spectra of Si/v-SC, and cross-sectional SEM image of Si/v-SC (insert, a), with corresponding EDS mapping of silicon (b) and (c) carbon and sulfur (d). | ||
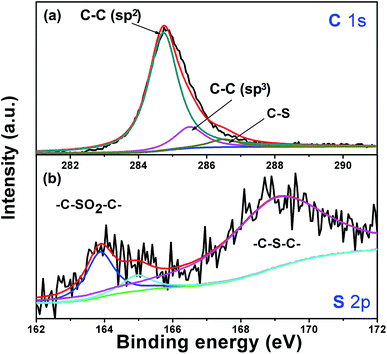
XPS experiments were used to investigate the bonding state of C and S atom in Si/v-SC composite (Fig. 7). The C 1s spectrum is composed of three peaks at the binding energies of 284.6 eV, 285.7 eV and 286.5 eV, the first two peaks corresponding to C atoms with sp2 hybridization and sp3 hybridization and the third peak at higher binding energy corresponding to C–S.27 The S 2p spectrum shows three main peaks at 164.0, 165.1 and 168.5 eV, corresponding to the sulphide bridge (–C–S–C–) for the first two peaks and to the sulphone bridge (–C–SO2–C–) for the third peak.27,28 The sulphide bridge form of the doped sulfur in the amorphous carbon anode can increase the lithiation capacity of the cells, which may have a favorable effect on improving the electrochemical performance of Si/v-SC.21
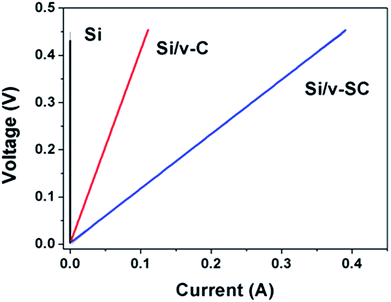
Electrical conductivities of Si, Si/v-C and Si/v-SC were measured by employing 2-wire Ohms measurement apparatus (Fig. 8). Compared with Si sample (2.7 × 10⁻⁶ S cm−1), the composite samples exhibited higher conductivities due to the electrically conductive carbon component. Specifically, the conductivity of Si/v-SC sample (10.7 S cm−1) is higher than that of Si/v-C (3.1 S cm−1), indicating that the S-doping increases the conductivity of the composite.
Electrochemical characterization
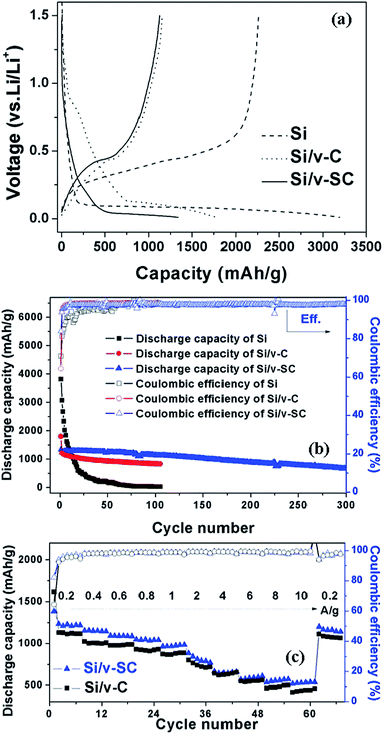
The initial voltage profile for Si, Si/v-C and Si/v-SC showed a typical lithiation/delithiation plateau of Si around 0.15 and 0.4 V (Fig. 9a).29–31 Whereas, Si/v-C and Si/v-SC samples exhibited a short charge plateau at about 0.75 V during the first lithiation process, which could be mainly attributed to the formation of SEI layer on the surface of carbon shell.32 Fig. 9b shows the cycling performance of all the samples as anode at a current density of 0.4 A g−1. Si, Si/v-C and Si/v-SC electrode exhibited an initial discharge capacity of 3194, 1793 and 1339 mA h g−1, with an initial CE of 70.8, 64.3 and 83.9%, respectively. Compared with the Si/v-C, the Si/v-SC with S-doping exhibited a higher initial CE, indicating that the S-doping facilitate improving the CE during the first lithiation/delithiation process. The capacity of Si electrode degraded quickly due to the cracking and pulverization of the Si nanoparticles. As a comparison, Si/v-C showed an improved cyclability, retaining a reversible capacity of 827 mA h g−1 after 105 cycles. Notably, Si/v-SC exhibited the best cycling stability, showing a reversible capacity of 1120 mA h g−1 (90% capacity retention) after 105 cycles and a capacity of 664 mA h g−1 even after 300 cycles with a small capacity fading rate of 0.1% per cycle. The excellent cycling stability can be attributed to the confinements of the S-doped carbon shell with a buffering space which efficiently accommodate the mechanical stress induced by the severe volume variation of Si particles over cycling. As shown in Fig. 9c, Si/v-C displayed a relatively fast capacity decrease from 1616 mA h g−1 at 0.2 A g−1 to 430 mA h g−1 at 10 A g−1. Compared with Si/v-C, Si/v-SC showed better rate performance, retaining a reversible capacity of 1384 and 537 mA h g−1 at 0.2 A g−1 and 10 A g−1. Notably, when the current density returned back to 0.2 A g−1, a reversible capacity of 1160 mA h g−1 was retained (83.8% of the initial charge capacity). The high reversible capacities and remarkable rate performance of Si/v-SC facilitate its utilization in next generation high-power LIBs.To better understand the effect of the S-doped-carbon shell on the lithiation/delithiation process of Si/v-SC, CV and EIS measurements were performed. Fig. 10a and b compared the Nyquist plots of Si and Si/v-SC electrode before and after 20 cycles. These Nyquist plots were fitted with the equivalent circuit shown in Fig. 10c. This circuit consists of an independent resistor (Rc), two resistors with constant phase elements (CPE) in parallel and a Warburg diffusion element to account for electrolyte/electrode resistance (Re), SEI film resistance (Rsf) and charge transfer resistance (Rct). The Si/v-SC electrode showed much smaller value and the value change of charge-transfer resistant (Rct) before cycling and after 20 cycles (Rct (before) = 30 Ω; Rct = 22 Ω), as compared with that of Rct (before) = 63 Ω; Rct = 95 Ω for the Si electrode.
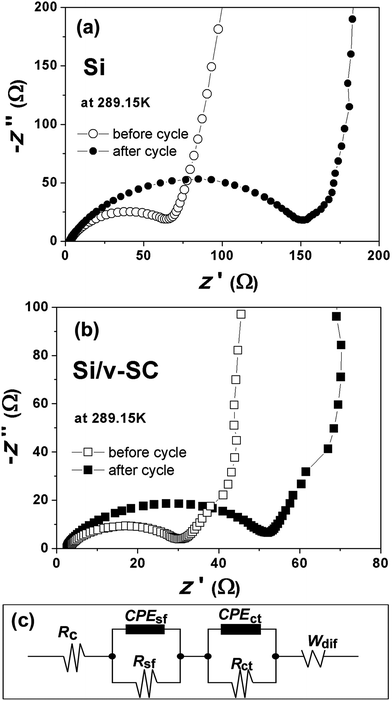 | ||
| Fig. 10 Nyquist plots of Si (a) and Si/v-SC (b) electrodes before and after 20 cycles. The equivalent circuit used to model the impedance spectra in (a) and (b) (c). | ||
Fig. 11 showed the CV curves of Si and Si/v-SC electrode recorded at first 5 cycles from 10 mV to 1.5 V. Both of the first discharge process for Si (Fig. 11, insert) and Si/v-SC showed a weak peak around 1.2–1.0 V and a sharp reduction peak below 0.3 V, which can be attributed to the formation of SEI layer and the insertion of Li+ into Si host, respectively.32,33 In the subsequent charge process, two broad peaks appeared at 0.39 and 0.53 V, corresponding to the decomposition of the LixSi and the extraction process of Li+ from the Si host, respectively. In the following cycles, the cathodic peak around 1.2–1.0 V disappeared and the cathodic peak at 0.2 V gradually evolved. The characteristic peaks became more pronounced with the increase of scan times, mainly due to the activation of more Si phase during lithiation/delithiation process.34 Compared with the Si electrode, after the first cycle, CV curves of Si/v-SC electrode showed no significant shift, suggesting an enhanced cycling performance. The EIS and CV analysis demonstrates that the Si/v-SC composite with the buffering void typed S-doped carbon shell exhibits a more favorable electrochemical kinetics, thus a much improved electrochemical performances compared with the Si electrode.
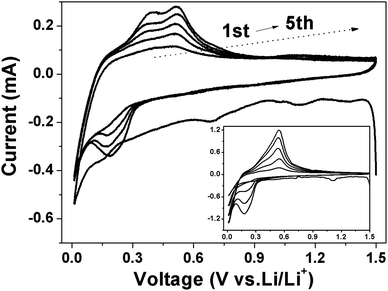 | ||
| Fig. 11 CV curves of Si (insert) and Si/v-SC electrode from 1.5 V to 0.01 V at a scan rate of 0.2 mV s−1 (vs. Li/Li+). | ||
Effects of S-doping
In order to investigate the effects of S-doping on the properties of carbon matrix, S-doped carbon materials (SC-1, SC-2, SC-3, SC-4 and SC-5) with different S-doping contents were prepared. EDS analysis showed that three different elements, C, O and S, exist for the SC-2, SC-3, SC-4 and SC-5 sample (Fig. 12a). The weight ratio of S in the SC-2, SC-3, SC-4 and SC-5 sample was 0.97, 1.99, 3.83 and 5.54 wt%, respectively.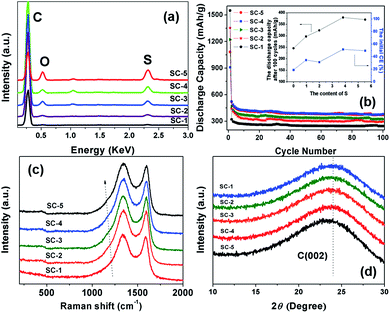 | ||
| Fig. 12 EDS spectra (a), electrochemical performance (b), Raman spectrum (c), and XRD patterns (d) of SC-1, SC-2, SC-3, SC-4 and SC-5. | ||
Fig. 12b presents the cycling performance of SC-2, SC-3, SC-4 and SC-5 samples. The SC-1 electrode showed a relatively high initial discharge capacity of 1550 mA h g−1 with a very low initial CE of 19%. And, the discharge capacity quickly decreased to 320 mA h g−1 at second cycle. After S-doping, SC-2, SC-3, SC-4 and SC-5 electrode showed improved reversible capacity and initial CE of 35, 32, 52 and 50%, respectively (Table 1). The initial CE of carbon electrode generally increased with increase of the S content, and saturated when the content of S reaches a value of 3.84 wt% (Fig. 12b, insert).
| Samples | Content of S (%) | d(002) (Å) | ID/IG | Eff.1st |
|---|---|---|---|---|
| SC-1 | 0.00 | 3.5297 | 1.022 | 19% |
| SC-2 | 0.97 | 3.5394 | 1.040 | 35% |
| SC-3 | 1.99 | 3.5504 | 1.068 | 32% |
| SC-4 | 3.83 | 3.5595 | 1.082 | 52% |
| SC-5 | 5.54 | 3.5615 | 1.102 | 50% |
Raman and XRD measurement were conducted to investigate the effects of S-doping on the structure of carbon. As shown in Fig. 12c, the characteristic peak of S![[double bond, length as m-dash]](https://www.rsc.org/images/entities/char_e001.gif) O bond at 1163 cm−1 was clearly observed in the Raman spectra for SC-2, SC-3, SC-4 and SC-5, indicating the S doping in these samples.27,28 The characteristic peak of the D and G band of carbon at 1340 and 1580 cm−1 was observed in all the samples, typical for amorphous carbon and crystalline graphite, respectively.24 The intensity ratio of D/G band (ID/IG) for all the samples was shown in Table 1. The value of ID/IG increased with increase of the S content in these S-doped carbon samples, and thus the increased amorphous character.
O bond at 1163 cm−1 was clearly observed in the Raman spectra for SC-2, SC-3, SC-4 and SC-5, indicating the S doping in these samples.27,28 The characteristic peak of the D and G band of carbon at 1340 and 1580 cm−1 was observed in all the samples, typical for amorphous carbon and crystalline graphite, respectively.24 The intensity ratio of D/G band (ID/IG) for all the samples was shown in Table 1. The value of ID/IG increased with increase of the S content in these S-doped carbon samples, and thus the increased amorphous character.
After S-doping, the XRD peak of the carbon (002) plane for SC-2, SC-3, SC-4 and SC-5 is somewhat downshifted to a lower wavenumber (Fig. 12d). The interspace of carbon (002) crystal face (d(002)) for all samples was calculated and was shown in Table 1. The distance of carbon crystal face increased with increase of the S content in these S-doped carbon samples, primarily due to the doping of S atom with larger atomic diameter (2.04 Å) in the carbon matrix. The carbon interlayer with increased distance in anode material can increase the reversibility of lithiation/delithiation of the cells, which have a favorable effect on improving the electrochemical performance of the carbon material.35
Conclusions
The Si/S-doped carbon with buffering voids composite (Si/v-SC) was prepared by a facile hydrothermal reaction of glucose and simultaneously chemical polymerization of S-containing monomer EDOT in the presence of Si@SiO2 nanoparticles, followed by carbonization and removal of the SiO2 template layer. The Si nanoparticles were embedded in the S-doped carbon buffer space to form a core–shell structure. Compared to the Si/carbon composite without the S-doping (Si/v-C), the Si/v-SC composite electrode showed improved conductivity, cycling and rate performance, exhibiting a reversible capacity of 664 mA h g−1 over 300 cycles at the current of 0.4 A g−1 and a high capacity of 537 mA h g−1 even at 10 A g−1. XRD and Raman test revealed that the S-doping increased the interspace of carbon crystal face, and improved the amorphous structure of carbon and thus the initial coulombic efficiency.Acknowledgements
This work was supported by the National Natural Science Foundation of China (21573239), Guangdong Provincial Project for Science & Technology (2014TX 01N014/2014A050503050/2015B010135008), Guangzhou Municipal Project for Science & Technology (2014Y2-00219/201509010018). LZ thanks K. C. Wong Education Foundation for support.References
- X. Zhao, M. J. Li, N. Ross and Y. M. Lin, RSC Adv., 2016, 6, 77682–77687 RSC.
- C. Liu, F. Li, L.-P. Ma and H. M. Cheng, Adv. Mater., 2010, 22, E28 CrossRef CAS PubMed.
- H. Wu and Y. Cui, Nano Today, 2012, 7, 414–429 CrossRef CAS.
- H. Kim, M. Seo, M. H. Park and J. Cho, Angew. Chem., Int. Ed., 2010, 49, 2146–2149 CrossRef CAS PubMed.
- C. Zhang, L. Gu, N. Kaskhedikar, G. Cui and J. Maier, ACS Appl. Mater. Interfaces, 2013, 5, 12340–12345 CAS.
- P. Zhang, L. Wang, J. Xie, L. Su and C. A. Ma, J. Mater. Chem. A, 2013, 2, 3776–3782 Search PubMed.
- J. Lee and S. Noda, RSC Adv., 2015, 5, 2938–2946 RSC.
- J. R. Szczech and S. Jin, Energy Environ. Sci., 2011, 4, 56–72 CAS.
- L. W. Su, Z. Zhou and M. M. Ren, Chem. Commun., 2010, 46, 2590–2592 RSC.
- L. Su, Y. Jing and Z. Zhou, Nanoscale, 2011, 3, 3967–3983 RSC.
- J. S. Bridel, T. Azais, M. Morcrette, J. M. Tarascon and D. Larcher, Chem. Mater., 2010, 22, 1229–1241 CrossRef CAS.
- H. Wang, J. Xie, S. C. Zhang, G. S. Cao and X. B. Zhao, RSC Adv., 2016, 6, 69764–69772 RSC.
- Y. S. Hu, R. Demir-Cakan, M. M. Titirici, J. O. Mueller, R. Schloegl, M. Antonietti and J. Maier, Angew. Chem., Int. Ed., 2008, 47, 1645–1649 CrossRef CAS PubMed.
- C. Du, M. Chen, L. Wang and G. Yin, J. Mater. Chem., 2011, 21, 15692–15697 RSC.
- S. Iwamura, H. Nishihara and T. Kyotani, J. Phys. Chem. C, 2012, 116, 6004–6011 CAS.
- L. Su, J. Xie, Y. Xu, L. Wang, Y. Wang and M. Ren, Phys. Chem. Chem. Phys., 2015, 17, 17562–17565 RSC.
- S. Chen, M. L. Gordin, R. Yi, G. Howlett, H. Sohn and D. Wang, Phys. Chem. Chem. Phys., 2012, 14, 12741–12745 RSC.
- L. Yue, W. Zhang, J. Yang and L. Zhang, Electrochim. Acta, 2014, 125, 206–217 CrossRef CAS.
- Y. Wang, F. Su, C. D. Wood, J. Y. Lee and X. S. Zhao, Ind. Eng. Chem. Res., 2008, 47, 2294–2300 CrossRef CAS.
- W. Kicinski, M. Szala and M. Bystrzejewski, Carbon, 2014, 68, 1–32 CrossRef CAS.
- L. Yue, S. Wang, X. Zhao and L. Zhang, J. Mater. Chem., 2012, 22, 1094–1099 RSC.
- L. Yue, H. Zhong, D. Tang and L. Zhang, J. Solid State Electrochem., 2013, 17, 961–968 CrossRef CAS.
- M. L. Terranova, S. Orlanducci, E. Tamburri, V. Guglielmotti and M. Rossi, J. Power Sources, 2014, 246, 167–177 CrossRef CAS.
- D. Shao, D. Tang, Y. Mai and L. Zhang, J. Mater. Chem. A, 2013, 1, 15068–15075 CAS.
- H. S. Zhou, S. M. Zhu, M. Hibino, I. Honma and M. Ichihara, Adv. Mater., 2003, 15, 2107 CrossRef CAS.
- S. Garreau, J. L. Duvail and G. Louarn, Synth. Met., 2001, 125, 325–329 CrossRef.
- C. H. Choi, S. H. Park and S. I. Woo, Green Chem., 2011, 13, 406–412 RSC.
- L. Zhang, J. Niu, M. Li and Z. Xia, J. Phys. Chem. C, 2014, 118, 3545–3553 CAS.
- J. Liu, Q. Zhang, Z. Y. Wu, J. T. Li, L. Huang and S. G. Sun, ChemElectroChem, 2015, 2, 611–616 CrossRef CAS.
- W. Li, Y. Tang, W. Kang, Z. Zhang, X. Yang, Y. Zhu, W. Zhang and C. S. Lee, Small, 2015, 11, 1345–1351 CrossRef CAS PubMed.
- B. Zhang, Z. L. Xu, Y. B. He, S. Abouali, M. A. Garakani, E. K. Heidari, F. Kang and J. K. Kim, Nano Energy, 2014, 4, 88–96 CrossRef CAS.
- A. J. Gmitter, I. Plitz and G. G. Amatucci, J. Electrochem. Soc., 2012, 159, A370–A379 CrossRef CAS.
- Y. Zhu, W. Liu, X. Zhang, J. He, J. Chen, Y. Wang and T. Cao, Langmuir, 2013, 29, 744–749 CrossRef CAS PubMed.
- Y. Xu, G. Yin, Y. Ma, P. Zuo and X. Cheng, J. Mater. Chem., 2010, 20, 3216–3220 RSC.
- Y. P. Wu, S. Fang, Y. Jiang and R. Holze, J. Power Sources, 2002, 108, 245–249 CrossRef CAS.
| This journal is © The Royal Society of Chemistry 2017 |

