 Open Access Article
Optimization of peak current of poly(3,4-ethylenedioxythiophene)/multi-walled carbon nanotube using response surface methodology/central composite design
Nurul Ain A. Talibab,
Faridah Salamc,
Nor Azah Yusofab,
Shahrul Ainliah Alang Ahmad ab and
Yusran Sulaiman
 *ab
*ab
aFunctional Device Laboratory, Institute of Advanced Technology, Universiti Putra Malaysia, 43400 Serdang, Selangor, Malaysia. E-mail: yusran@upm.edu.my; Fax: +60-389435380; Tel: +60-389466779
bDepartment of Chemistry, Faculty of Science, Universiti Putra Malaysia, 43400 Serdang, Selangor, Malaysia
cAgri-Nanotechnology Programme, Biotechnology and Nanotechnology Research Centre, Malaysian Agricultural Research and Development Institute, 43400 Serdang, Selangor, Malaysia
First published on 13th February 2017
Abstract
Modification of electrode surface with poly(3,4-ethylenedioxythiophene)/multi-walled carbon nanotube (PEDOT/MWCNT) composite prepared by electrodeposition technique was reported in this study. The optimization of peak current response of PEDOT/MWCNT was performed by utilizing the combination of response surface methodology and central composite design (RSM/CCD). The effect of each variable and the interaction between three variables i.e. the concentration of MWCNT, electrodeposition potential and deposition time were studied and modeled. The statistical analysis showed that the concentration of MWCNT and deposition time have significantly affected the peak current response. A reduced cubic model equation with the coefficient of determination (R2) value of 0.9973 was developed. The optimized condition predicted by the software was compared with the experiment and resulting in less than 2% error, indicating that this model was reliable and able to predict the peak current response accurately. Additionally, the electrochemical properties, chemical properties and morphology of the optimized modified electrode were characterized by cyclic voltammetry (CV), Fourier transform infrared (FTIR), Raman spectroscopy and field emission scanning electron microscopy (FESEM). The peak current of the optimized PEDOT/MWCNT modified electrode was higher than electrode without MWCNT and the FESEM study demonstrated that the tubular structure of MWCNT was uniformly wrapped by PEDOT. The FTIR and Raman spectra proved that MWCNT was successfully incorporated into PEDOT.
Introduction
Modification of electrode surface may enhance the electrochemical properties of the electrode for various application such as solar cells,1,2 supercapacitor,3 organic light-emitting diodes (OLEDs),4,5 chemical sensors6,7 and biological sensors.8–10 Modification of the electrode surface will increase the electrode performance by introducing of interest materials through surface absorption,11,12 crosslinking agent,13 covalent bonding,14 non-covalent bonding15 or other types of attachment. Therefore, the modification of electrode surface has become critical studies to allow enhancement of electrode properties.Carbon materials such as carbon nanotube (CNT) is known to have high electrical conductivity, high thermal conductivity and high surface area properties.16 Generally, CNT can be categorized into single-walled carbon nanotube (SWCNT) and multi-walled carbon nanotube (MWCNT). Incorporation of CNTs with suitable conducting polymers may enhance the electrochemical properties of composites.17 Conducting polymers play a significant contribution in chemical sensors18 and biosensors8,19 by improving the current response. Poly(3,4-ethylenedioxythiophene) (PEDOT) is one of the remarkable conducting polymers due to its ability to exhibit excellent electrochemical stability17 and has been used widely in the electrode modification. The previous studies have suggested that the synergistic effects of the conducting polymer and the nanotubes composites may improve the surface and electrical properties.20–22 The unique nanotube structure of CNTs allows this material to bear more electrochemically favorable components.23 The sp2 carbons and open ends of nanotube-containing oxygen moieties have enabled CNT to act as a support for the formation of electrochemically functional devices. In biosensor applications, the biological compounds such as protein can be absorbed non-covalently along the lengths of CNT,24 thus make this material as a suitable constituent in the composites.
In order to prepare highly sensitive sensor platforms, optimization of variables is crucial. As an alternative to traditional optimization by one parameter at a time technique, response surface methodology (RSM) was introduced. This statistical analysis can be used with optional of various experimental designs such as central composite design (CCD),25 Box–Behnken design26 and Doehlert design.27 Advantages of RSM are a low number of experiments to be carried out, individual parameter and the interaction between the analyzed parameters can be studied and the reduction of experimental cost by minimizing the process variation.28
In this study, PEDOT/MWCNT modified electrode was prepared by electropolymerization technique. The optimization of the peak current response was performed by RSM/CCD to optimize the concentration of MWCNT, electropolymerization potential and deposition time. The optimized PEDOT/MWCNT composite was characterized by cyclic voltammetry (CV), Fourier transform infrared (FTIR), Raman spectroscopy and field emission scanning electron microscopy (FESEM).
Experimental
Materials
3,4-Ethylenedioxythiophene (EDOT) and multi-walled carbon nanotube (MWCNT) were purchased from Sigma-Aldrich (USA). Potassium hexacyanoferrate (K3[Fe(CN)6]) and potassium chloride (KCl) were obtained from BDH (England) and Fisher Scientific (UK), respectively. All the chemicals were used as received without further purification. Deionized distilled water (DI water) from Milli-Q ultrapure water system with the resistivity of 18.2 MΩ cm was used as the solvent to prepare all the solutions. Indium tin oxide (ITO) glass was cleaned ultrasonically with acetone, ethanol and DI water for 10 min prior to use.Functionalization of MWCNT
Functionalization of MWCNT was prepared by adding 0.1 g of MWCNT into a mixture solution (50 mL) of concentrated nitric acid (HNO3) and concentrated sulphuric acid (H2SO4) in 1![[thin space (1/6-em)]](https://www.rsc.org/images/entities/char_2009.gif) :
:![[thin space (1/6-em)]](https://www.rsc.org/images/entities/char_2009.gif) 3 ratio. This mixture was then sonicated for two hours before kept overnight. Functionalized MWCNT was filtered and washed with DI water until pH 7 was obtained followed by dried at 60 °C in the oven.
3 ratio. This mixture was then sonicated for two hours before kept overnight. Functionalized MWCNT was filtered and washed with DI water until pH 7 was obtained followed by dried at 60 °C in the oven.
Preparation of PEDOT/MWCNT composite and determination of peak current
Hybridization of PEDOT/MWCNT was performed by electropolymerization of 0.01 M EDOT in the presence of various concentrations of MWCNT suspension onto ITO glass by chronoamperometry (CA). All the electrochemical measurements were performed using a potentiostat Autolab PGSTATM101 (Metrohm) in a three-electrode system with Ag/AgCl as the reference electrode and platinum coil as the counter electrode. The peak current (Ipa) values were determined from the cyclic voltammogram.Design of experiment and response surface methodology
Important variables on the fabrication of electropolymerized PEDOT/MWCNT onto ITO glass was optimized by using RSM/CCD approach. The concentration of MWCNT (A), electropolymerization potential (B) and deposition time (C) were the independent variables used in this study. The ranges and levels of the chosen variables are tabulated in Table 1 and the output of this model was the peak current response. Three factors with the total of 20 experiment runs were suggested by RSM/CCD using the statistical package (Design Expert 6.0, Stat Ease Inc., MN, USA) as displayed in Table 2. Response surface modeling, statistical analysis, and optimization were conducted with the assistance of this software. Analysis of variance (ANOVA) was used in the analyzing of the output data. The peak current response data from the suggested experiments was expressed by polynomial regression equation to generate a model as shown in eqn (1):
 | (1) |
| Variables/factors | Notation | Unit | Actual | Coded level | ||||
|---|---|---|---|---|---|---|---|---|
| Low | Middle | High | Low | Middle | High | |||
| Concentration of MWCNT | xi | mg mL−1 | 0.010 | 0.105 | 0.200 | −1 | 0 | 1 |
| Electropolymerization potential | xj | V | 1.0 | 1.2 | 1.4 | −1 | 0 | 1 |
| Deposition time | xk | s | 60 | 210 | 360 | −1 | 0 | 1 |
| Standard | A: concentration of CNT (mg mL−1) | B: electropolymerization potential (V) | C: deposition time (s) | Peak current (μA) | |
|---|---|---|---|---|---|
| Experiment | Predicted | ||||
| 1 | 0.010 (−1) | 1.00 (−1) | 60 (−1) | 186.87 | 186.86 |
| 2 | 0.200 (1) | 1.00 (−1) | 60 (−1) | 199.19 | 199.18 |
| 3 | 0.010 (−1) | 1.40 (1) | 60 (−1) | 190.87 | 190.86 |
| 4 | 0.200 (1) | 1.40 (1) | 60 (−1) | 195.17 | 195.15 |
| 5 | 0.010 (−1) | 1.00 (−1) | 360 (1) | 197.65 | 197.64 |
| 6 | 0.200 (1) | 1.00 (−1) | 360 (1) | 194.41 | 194.39 |
| 7 | 0.010 (−1) | 1.40 (1) | 360 (1) | 192.65 | 192.64 |
| 8 | 0.200 (1) | 1.40 (1) | 360 (1) | 192.86 | 192.85 |
| 9 | 0.010 (−1) | 1.20 (0) | 210 (0) | 200.78 | 200.84 |
| 10 | 0.200 (1) | 1.20 (0) | 210 (0) | 196.68 | 196.74 |
| 11 | 0.105 (0) | 1.00 (−1) | 210 (0) | 212.77 | 212.83 |
| 12 | 0.105 (0) | 1.40 (1) | 210 (0) | 216.28 | 216.34 |
| 13 | 0.105 (0) | 1.20 (0) | 60 (−1) | 217.24 | 217.30 |
| 14 | 0.105 (0) | 1.20 (0) | 360 (1) | 210.84 | 210.90 |
| 15 | 0.105 (0) | 1.20 (0) | 210 (0) | 216.96 | 216.88 |
| 16 | 0.105 (0) | 1.20 (0) | 210 (0) | 215.47 | 216.88 |
| 17 | 0.105 (0) | 1.20 (0) | 210 (0) | 218.28 | 216.88 |
| 18 | 0.105 (0) | 1.20 (0) | 210 (0) | 215.76 | 216.88 |
| 19 | 0.105 (0) | 1.20 (0) | 210 (0) | 218.03 | 216.88 |
| 20 | 0.105 (0) | 1.20 (0) | 210 (0) | 217.03 | 216.88 |
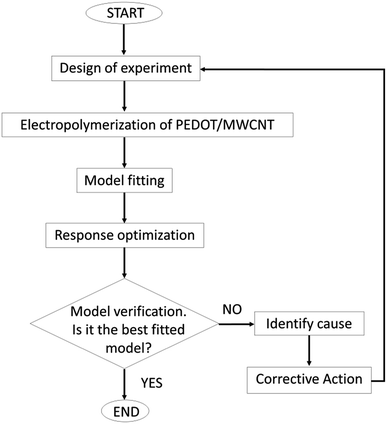
Validation of the model and optimization of the peak current response were conducted according to the flowchart in Fig. 1. The optimum values of variables were predicted by the response surface analysis of the combined variables. The constraints in this study were applied to predict the optimum variable conditions that resulting in the highest peak current response by inserting the desired conditions in the Design Expert software. The efficiency of the model was verified by performing the suggested experiments and comparing the output with the predicted results. Residual standard errors (RSE) were used to determine the reliability of the model. The numerical optimization of the response was predicted based on the second order polynomial model.
Characterizations
The optimized PEDOT/MWCNT was characterized by cyclic voltammetry (CV) in 0.01 M K3[Fe(CN)6] solution containing 0.1 M KCl in the potential range of 0.2 to 0.6 V at a scan rate of 100 mV s−1. FTIR measurements were carried out using attenuated total reflection (ATR) on Perkin-Elmer spectrophotometer with 16 number of scan and resolution of 4. Raman spectroscopy (Alpha 300R) was performed at an integration time of 5 s, accumulation number of 10 and resolution of 200–300 nm. Field emission scanning electron microscopy (FESEM, JOEL JSM-7600F) was used for surface morphology studies. Samples for FESEM were mounted on the stub followed by coating with platinum. The samples were examined at 5 kV operating voltage with 50![[thin space (1/6-em)]](https://www.rsc.org/images/entities/char_2009.gif) 000× magnification. All the characterizations were performed at room temperature.
000× magnification. All the characterizations were performed at room temperature.
Results and discussion
Response surface methodology
| Source | Sum of squares | Degree of freedom | Mean square | F-Value | Prob > F | |
|---|---|---|---|---|---|---|
| Model | 2434.34 | 13 | 187.26 | 171.19 | <0.0001 | Significant |
| Residual | 6.56 | 6 | 1.09 | |||
| Lack of fit | 0.03 | 1 | 0.03 | 0.02 | 0.8869 | Not significant |
| Pure error | 6.53 | 5 | 1.31 | |||
| Cor total | 2440.90 | 19 |
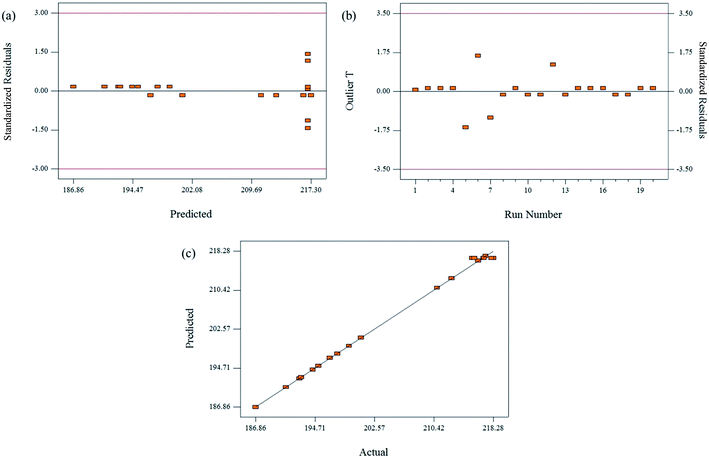
The coefficient of determination of this model is high with the R2 value of 0.9973 (Table 4). R2 value closer to linearity indicates good regression. The adjusted R2 (0.9915) and predicted R2 (0.9818) values are in reasonable agreement.29 The value of adequate precision greater than 4 is desirable. Adequate precision measures the signal to noise ratio, which in this case the value of 34.78 is obtained, indicating an adequate ratio. In this study, low coefficient of variation and the standard deviation (SD) values were obtained, implying that this model is good.30
| Types of variables | |
|---|---|
| Standard deviation (SD) | 1.05 |
| Mean | 205.29 |
| Coefficient of variation (C.V.) | 0.51 |
| Press | 44.38 |
| R2 | 0.9973 |
| Adjusted R2 | 0.9915 |
| Predicted R2 | 0.9818 |
| Adequate precision | 34.784 |
The experimental response was modeled as a polynomial equation that represents the effect of experimental independent and dependent variables on the peak current. In this study, there are three variables involved, thus k takes 3. Therefore, the second order polynomial equation becomes eqn (2) with additional cubic interaction effects:
| Y = β0 + β1x1 + β2x2 + β3x3 + β11x12 + β22x22 + β33x32 + β12x1x2 + β13x1x3 + β23x2x3 + β112x12x2 + β113x12x3 + β122x1x22 + β123x1x2x3 | (2) |
The intercept (β0), the main linear (β1, β2, β3), quadratic (β11, β22, β33), cubic (β112, β113, β122, β123) and interaction (β12, β13, β23, β112, β113, β122, β123) effects represent the coefficients in the equation. It is found that the reduced-cubic model fits the experimental data well. The reduced-cubic model equation in coded form based on the data analysis in Table 5 is established in eqn (3):
| Peak current = 216.88 − 2.05A + 1.75B − 3.20C − 18.10A2 − 2.30B2 − 2.79C2 − 0.57AB − 2.46AC − 0.82BC − 2.58A2B + 3.88A2C + 3.75AB2 + 1.44ABC | (3) |
| Factor | Coefficient estimate | Degree of freedom | F value | Prob > F | Standard error | 95% confidence interval | |
|---|---|---|---|---|---|---|---|
| Low | High | ||||||
| a Significant. | |||||||
| Intercept | 216.88 | 1 | 0.36 | 216.00 | 217.76 | ||
| A | −2.05 | 1 | 7.68 | 0.0323a | 0.74 | −3.86 | −0.24 |
| B | 1.76 | 1 | 5.63 | 0.0553 | 0.74 | −0.05 | 3.56 |
| C | −3.20 | 1 | 18.72 | 0.0049a | 0.74 | −5.01 | −1.39 |
| A2 | −18.10 | 1 | 823.45 | <0.0001a | 0.63 | −19.64 | −16.55 |
| B2 | −2.30 | 1 | 13.33 | 0.0107a | 0.63 | −3.85 | −0.76 |
| C2 | −2.79 | 1 | 19.54 | 0.0045a | 0.63 | −4.33 | −1.24 |
| AB | −0.57 | 1 | 2.39 | 0.1733 | 0.37 | −1.48 | 0.33 |
| AC | −2.46 | 1 | 44.12 | 0.0006a | 0.37 | −3.36 | −1.55 |
| BC | −0.82 | 1 | 4.86 | 0.0696 | 0.37 | −1.72 | 0.09 |
| A2B | −2.58 | 1 | 9.71 | 0.0207a | 0.83 | −4.60 | −0.55 |
| A2C | 3.88 | 1 | 22.05 | 0.0033a | 0.83 | 1.86 | 5.91 |
| AB2 | 3.75 | 1 | 20.54 | 0.0040a | 0.83 | 1.72 | 5.77 |
| ABC | 1.44 | 1 | 15.07 | 0.0082a | 0.37 | 0.53 | 2.34 |
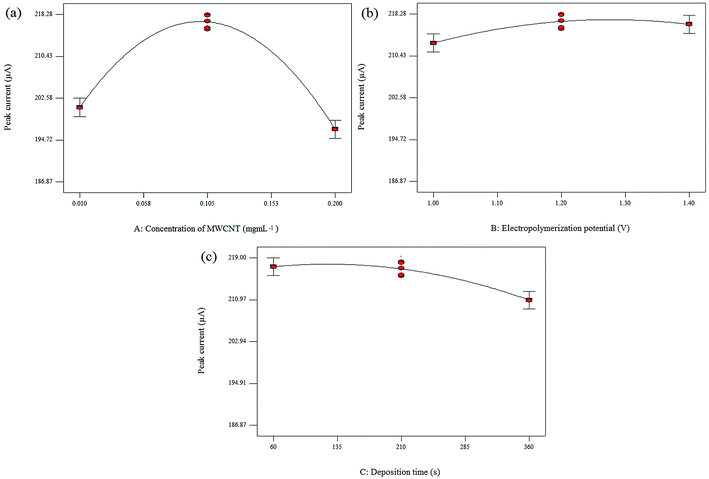
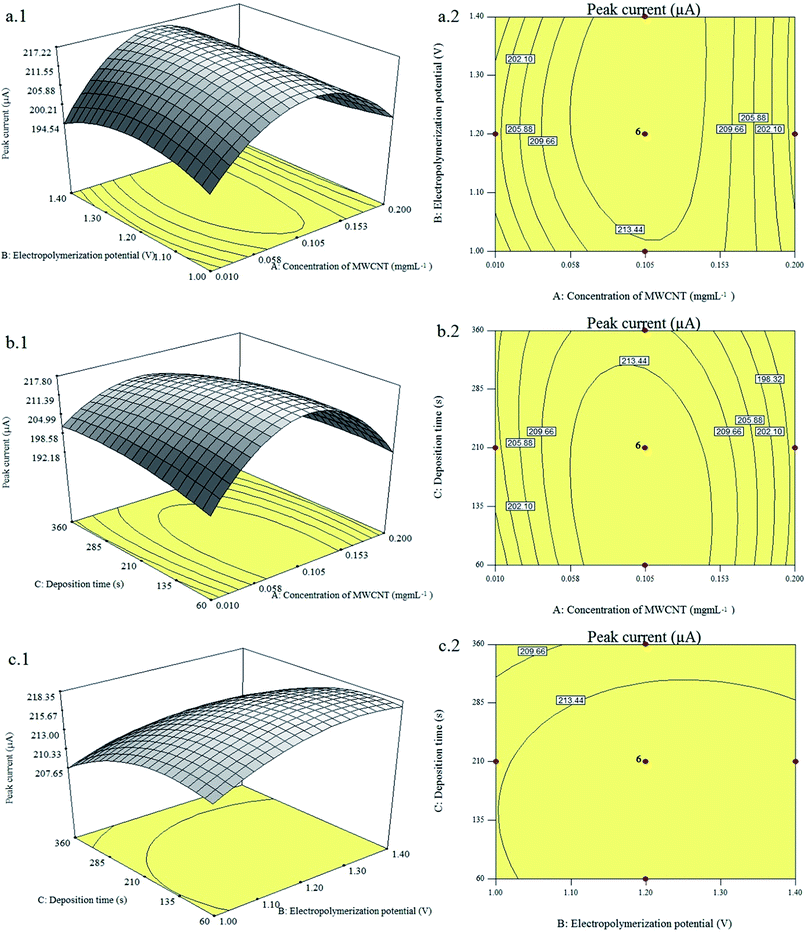
Three independent variables i.e. the concentration of MWCNT (A), electropolymerization potential (B) and deposition time (C) are represented by coded values (x1 = A, x2 = B and x3 = C). Model terms of A, C, A2, B2, C2, AC, A2B, A2C, AB2 and ABC are identified as significant model terms with the values of prob > F are lower than 0.0500. Electropolymerization potential (model term B) is an insignificant term in this study, indicating that 1.0 V to 1.4 V potential range for the electropolymerization of PEDOT/MWCNT did not affect the experiment mutually. The model terms AB and BC are identified as insignificant, implying no mutual effect and interaction between the concentration of MWCNT and electropolymerization potential, and also between electropolymerization potential and deposition time in this study.
Eventhough terms B, AB and BC are insignificant, these terms remain in the model equation to support the hierarchy. The insignificant terms also have a contribution in this model based on the fact that this model design can predict accurate up to 2% RSE according to the model validation. A non-significant term can be remained or removed from the model equation depending on the suitability. However, not removing non-significant terms has become common practice,31–33 thus it is not necessary to remove the insignificant terms in this study. The normal cubic equation should include terms A3, B3, C3, AC2, B2C and BC2. However, terms A3, B3, C3, AC2, B2C and BC2 are aliased with terms A, B, C, AB2, A2C and AC2, respectively. Thus, these terms are not required in the equation and were removed resulting the cubic model becomes a reduced-cubic model. Based on the prob > F value, terms A2B, A2C, AB2 and ABC from cubic interactions are significant thus these terms are included in the model.
| Name | Goal | Limit | |
|---|---|---|---|
| Lower | Upper | ||
| Concentration of MWCNT (mg mL−1) | Is in range | 0.010 | 0.200 |
| Electropolymerization potential (V) | Is in range | 1.00 | 1.40 |
| Deposition time (s) | Is in range | 60 | 360 |
| Peak current (μA) | Maximize | 186.87 | 218.28 |
| Number | Concentration of MWCNT (mg mL−1) | Electropolymerization potential (V) | Deposition time (s) | Peak current (μA) | RSE (%) | |
|---|---|---|---|---|---|---|
| Predicted | Experiment | |||||
| 1 | 0.100 | 1.31 | 99.10 | 218.324 | 220.25 | 0.8822 |
| 2 | 0.100 | 1.33 | 120.53 | 218.285 | 220.76 | 1.1338 |
| 3 | 0.100 | 1.29 | 129.36 | 218.324 | 218.16 | 0.0751 |
![[double bond, length as m-dash]](https://www.rsc.org/images/entities/char_e001.gif) O stretching vibration.
O stretching vibration.
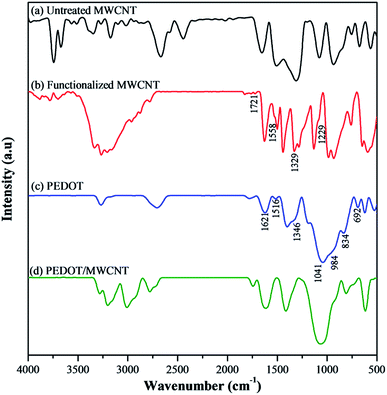 | ||
| Fig. 6 FTIR spectra of (a) untreated MWCNT, (b) functionalized MWCNT, (c) PEDOT and (d) PEDOT/MWCNT. | ||
Other functional groups such as C![[double bond, length as m-dash]](https://www.rsc.org/images/entities/char_e001.gif) C stretching (quinoidal structure) of the thiophene ring (peaks at 1516 and 1621 cm−1), C–C stretching of the quinoidal structure of the thiophene ring (shoulder peak at 1346 cm−1) and C–O–C stretching in the ethylene dioxy group (1041 cm−1) were also observed. Incorporation of MWCNT into PEDOT composite has resulted in the disappearance of peaks 1721, 1518, 1329 and 1229 cm−1 that originated from MWCNT (Fig. 6d). This is due to the MWCNTs were wrapped with the PEDOT,35 which is also supported by the FESEM image in Fig. 8c. Meanwhile, the other peaks belong to PEDOT can still be observed after the formation of PEDOT/MWCNT composite. Meanwhile, a peak at 1325 cm−1 is attributed to the hydroxyl group (O–H) formation from the deformation of the carboxylic group (–COOH) due to acid oxidization of MWCNT. Fig. 6c shows the C–S deformation peaks from PEDOT that determined by the peaks at 984 (shoulder), 834 and 692 cm−1.
C stretching (quinoidal structure) of the thiophene ring (peaks at 1516 and 1621 cm−1), C–C stretching of the quinoidal structure of the thiophene ring (shoulder peak at 1346 cm−1) and C–O–C stretching in the ethylene dioxy group (1041 cm−1) were also observed. Incorporation of MWCNT into PEDOT composite has resulted in the disappearance of peaks 1721, 1518, 1329 and 1229 cm−1 that originated from MWCNT (Fig. 6d). This is due to the MWCNTs were wrapped with the PEDOT,35 which is also supported by the FESEM image in Fig. 8c. Meanwhile, the other peaks belong to PEDOT can still be observed after the formation of PEDOT/MWCNT composite. Meanwhile, a peak at 1325 cm−1 is attributed to the hydroxyl group (O–H) formation from the deformation of the carboxylic group (–COOH) due to acid oxidization of MWCNT. Fig. 6c shows the C–S deformation peaks from PEDOT that determined by the peaks at 984 (shoulder), 834 and 692 cm−1.
![[double bond, length as m-dash]](https://www.rsc.org/images/entities/char_e001.gif) Cβ band (1497 cm−1) and symmetric Cα
Cβ band (1497 cm−1) and symmetric Cα![[double bond, length as m-dash]](https://www.rsc.org/images/entities/char_e001.gif) Cβ band (1437 cm−1) from PEDOT were observed in Fig. 7c. Slightly shifted D band (1363 cm−1) and G band (1571 cm−1) belong to MWCNT along with oxyethylene group, C–C band, C–O–C band, asymmetric Cα
Cβ band (1437 cm−1) from PEDOT were observed in Fig. 7c. Slightly shifted D band (1363 cm−1) and G band (1571 cm−1) belong to MWCNT along with oxyethylene group, C–C band, C–O–C band, asymmetric Cα![[double bond, length as m-dash]](https://www.rsc.org/images/entities/char_e001.gif) Cβ band (at 1508 cm−1) and symmetric Cα
Cβ band (at 1508 cm−1) and symmetric Cα![[double bond, length as m-dash]](https://www.rsc.org/images/entities/char_e001.gif) Cβ band (1435 cm−1) from PEDOT were observed in the PEDOT/MWCNT composite spectrum (Fig. 7d), indicating that MWCNT was successfully incorporated with PEDOT.
Cβ band (1435 cm−1) from PEDOT were observed in the PEDOT/MWCNT composite spectrum (Fig. 7d), indicating that MWCNT was successfully incorporated with PEDOT.
Conclusions
Central composite design/response surface methodology was successfully utilized for the optimization of peak current in the fabrication of PEDOT/MWCNT modified electrode. The effect of three major factors in the fabrication of PEDOT/MWCNT composite was studied and optimized statistically. The concentration of MWCNT and the deposition time were statistically determined as significant terms. Based on response surface optimization, the optimum condition for fabrication of PEDOT/MWCNT composite with maximum peak current was achieved by electrodepositing 0.1 mg mL−1 of MWCNT in 0.01 M EDOT at 1.31 V for 99.1 s on the electrode surface. The validation and optimization based on the software prediction have shown that this model can predict with less than 2% error as compared with the experiment, suggesting that this model was reliable and able to predict the peak current response accurately. The optimized PEDOT/MWCNT composite exhibited the tubular structure of MWCNT that uniformly wrapped by PEDOT has significantly improved the electrochemical properties.Acknowledgements
The authors would like to thank Fundamental Research Grant Scheme (01-01-15-1707FR) for funding this research project and Malaysian Agricultural Research and Development Institute (MARDI) for facilities provided.References
- X. Lin, Y. Yang, L. Nian, H. Su, J. Ou, Z. Yuan, F. Xie, W. Hong, D. Yu, M. Zhang, Y. Ma and X. Chen, Nano Energy, 2016, 26, 216–223 CrossRef CAS.
- H. Seo, M.-K. Son, S. Hashimoto, T. Takasaki, N. Itagaki, K. Koga and M. Shiratani, Electrochim. Acta, 2016, 210, 880–887 CrossRef CAS.
- N. Hawa, N. Azman, L. H. Ngee and Y. Sulaiman, Electrochim. Acta, 2016, 188, 785–792 CrossRef.
- R. E. Triambulo and J.-W. Park, Org. Electron., 2016, 28, 123–134 CrossRef CAS.
- J. Lee, H. Youn and M. Yang, Org. Electron., 2015, 22, 81–85 CrossRef CAS.
- D. Kim, D. Yang, K. Kang, M. A. Lim, Z. Li, C.-O. Park and I. Park, Sens. Actuators, B, 2016, 226, 579–588 CrossRef CAS.
- W. Chaisriratanakul, W. Bunjongpru, W. Jeamsaksiri, A. Srisuwan, S. Porntheeraphat, E. Chaowicharat, C. Hruanun, A. Poyai, D. Phomyothin and J. Nukeaw, Surf. Coat. Technol., 2016, 306, 58–62 CrossRef CAS.
- F. Salam and I. E. Tothill, Biosens. Bioelectron., 2009, 24, 2630–2636 CrossRef CAS PubMed.
- D. Li, J. Wu, P. Wu, Y. Lin, Y. Sun, R. Zhu, J. Yang and K. Xu, Sens. Actuators, B, 2015, 213, 295–304 CrossRef CAS.
- Y. Temerk and H. Ibrahim, Sens. Actuators, B, 2016, 224, 868–877 CrossRef CAS.
- M. Thiruppathi, N. Thiyagarajan, M. Gopinathan and J.-M. Zen, unpublished work.
- J. Wang, M. Xu, Z. Huangfu, Y. Wang, Y. He, W. Guo and Z. Wang, Vib. Spectrosc., 2016, 85, 122–127 CrossRef CAS.
- K. Nakabayashi, D. Noda, T. Takahashi and H. Mori, Polymer, 2016, 86, 56–68 CrossRef CAS.
- M. Amouzadeh Tabrizi and M. Shamsipur, Biosens. Bioelectron., 2015, 69, 100–105 CrossRef CAS PubMed.
- J. Zhao, J. Ma, X. Nan and B. Tang, Org. Electron., 2016, 30, 52–59 CrossRef CAS.
- R. Isaac and P. K. Praseetha, Int. J. Electrochem. Sci., 2015, 10, 7303–7319 CAS.
- N. A. Alba, Z. J. Du, K. A. Catt, T. D. Y. Kozai and X. T. Cui, Biosensors, 2015, 5, 618–646 CrossRef PubMed.
- U. Lange, N. V. Roznyatovskaya and V. M. Mirsky, Anal. Chim. Acta, 2008, 614, 1–26 CrossRef CAS PubMed.
- M. Cui, Z. Song, Y. Wu, B. Guo, X. Fan and X. Luo, Biosens. Bioelectron., 2016, 79, 736–741 CrossRef CAS PubMed.
- M. Ginic-Markovic, J. G. Matisons, R. Cervini, G. P. Simon and P. M. Fredericks, Chem. Mater., 2006, 18, 6258–6265 CrossRef CAS.
- M. M. Barsan, M. E. Ghica and C. M. A. Brett, Anal. Chim. Acta, 2015, 881, 1–23 CrossRef CAS PubMed.
- Rajesh, T. Ahuja and D. Kumar, Sens. Actuators, B, 2009, 136, 275–286 CrossRef CAS.
- L. Su, F. Gao and L. Mao, Anal. Chem., 2006, 78, 2651–2657 CrossRef CAS PubMed.
- M. M. Barsan, R. C. Carvalho, Y. Zhong, X. Sun and C. M. A. Brett, Electrochim. Acta, 2012, 85, 203–209 CrossRef CAS.
- T. Rajmohan and K. Palanikumar, Measurement, 2013, 46, 1470–1481 CrossRef.
- S. L. C. Ferreira, R. E. Bruns, H. S. Ferreira, G. D. Matos, J. M. David, G. C. Brandão, E. G. P. da Silva, L. A. Portugal, P. S. dos Reis, A. S. Souza and W. N. L. dos Santos, Anal. Chim. Acta, 2007, 597, 179–186 CrossRef CAS PubMed.
- T. Lundstedt, E. Seifert, L. Abramo, B. Thelin, Å. Nyström, J. Pettersen and R. Bergman, Chemom. Intell. Lab. Syst., 1998, 42, 3–40 CrossRef CAS.
- B. W. Chieng, N. a. Ibrahim and W. M. Z. W. Yunus, Polym.-Plast. Technol. Eng., 2012, 51, 791–799 CrossRef CAS.
- K. Mammar and A. Chaker, Leonardo J. Sci., 2013, 84–96 CAS.
- C. García-Gómez, P. Drogui, F. Zaviska, B. Seyhi, P. Gortáres-Moroyoqui, G. Buelna, C. Neira-Sáenz, M. Estrada-alvarado and R. G. Ulloa-Mercado, J. Electroanal. Chem., 2014, 732, 1–10 CrossRef.
- S. Agarwal, I. Tyagi, V. K. Gupta, M. Dastkhoon, M. Ghaedi, F. Yousefi and A. Asfaram, J. Mol. Liq., 2016, 219, 332–340 CrossRef CAS.
- S. Sugashini and K. M. M. S. Begum, Clean Technol. Environ. Policy, 2013, 15, 293–302 CrossRef CAS.
- S. E. Ashari, R. Mohamad, A. Ariff, M. Basri and A. B. Salleh, J. Oleo Sci., 2009, 58, 503–510 CrossRef CAS PubMed.
- R. Mangu, S. Rajaputra and V. P. Singh, Nanotechnology, 2011, 22, 215502 CrossRef PubMed.
- Y. M. Xiao, J. Y. Lin, J. H. Wu, S. Y. Tai and G. T. Yue, Electrochim. Acta, 2012, 83, 221–226 CrossRef CAS.
- S. Bhandari, M. Deepa, A. K. Srivastava, C. Lal and R. Kant, Macromol. Rapid Commun., 2008, 29, 1959–1964 CrossRef CAS.
| This journal is © The Royal Society of Chemistry 2017 |

