DOI:
10.1039/C6RA26093D
(Paper)
RSC Adv., 2017,
7, 4174-4178
Phosphorus-doped activated carbon as a promising additive for high performance lead carbon batteries
Received
31st October 2016
, Accepted 16th December 2016
First published on 16th January 2017
Abstract
Remarkable inhibition of the hydrogen evolution reaction (HER) is demonstrated on phosphorus-doped activated carbon, which shows great potential as an additive to the negative electrodes of lead-carbon batteries and other electrochemical applications.
Introduction
Lead-acid battery is considered as an attractive candidate for hybrid electric vehicles (HEVs) and energy storage applications because of its low-cost, mature technology, and high recycling efficiency.1,2 However, the traditional valve-regulated lead-acid (VRLA) battery suffers from the limitation of a shorter cycle life under high-rate partial-state-of-charge (HRPSoC) conditions due to the formation of irreversible hard sulfate in the negative plates.3,4 To address this problem, many efforts have been devoted, and the integration of a higher than usual content of carbon into the negative electrode has been identified as an effective way.5,6 The lead-carbon battery, which directly integrates carbon as a high content additive in the negative plates, has been demonstrated to increase the cycle life by orders of magnitude.7 However, carbon materials usually have a lower overpotential of hydrogen evolution especially in acidic electrolyte, which accelerates water loss of the battery.8 Therefore, the inhibition of hydrogen evolution is crucial to develop high performance lead-carbon batteries.
Hydrogen evolution, which is a side reaction in the lead-acid batteries, generally occurs through the Volmer reaction (H+ + M + e− ↔ M − H*), followed by the Heyrovsky reaction (M − H* + H+ + e− ↔ M + H2) or Tafel reaction (2M − H* ↔ 2M + H2). H* designates a hydrogen atom chemically adsorbed on an active site of the electrode surface (M).9,10 Generally, the hydrogen evolution reaction pathways are strongly dependent on the inherent electrochemical/chemical and electronic properties of the electrode surface.
Heteroatom doping is an effective way to tune the physical and chemical properties, such as electronic structure, defect sites, and surface chemistry, which are highly relevant to the electrochemical performance, of the carbon-based materials.11 Nitrogen is by far the most extensively investigated heteroatom. Jiang et al.12 demonstrated that the HER is inhibited using N-doped carbon due to the stronger electronegativity of N than that of C, which makes the C atom electron deficient and thus weakens the bond strength to hydrogen. In comparison to nitrogen, other heteroatoms doping, such as sulfur and phosphorus, are rarely reported.13
Herein, we report for the first time the phosphorus-doped activated carbon (P-AC), which is prepared via a facile, low-cost, and scalable method, that exhibits remarkable inhibition for the HER and shows great potential as a promising additive to the negative electrode for lead-carbon batteries.
Experimental
Preparation of materials
Commercially activated carbon (AC) (YP80F, Kuraray Co. Ltd.) and phosphoric acid were used as the carbon and phosphorus sources, respectively. To facilitate the phosphorus doping process, AC was pretreated with nitric acid by heating a mixture of 1 g AC powder and 80 mL of 3 mol L−1 nitric acid solution at 80 °C for 3 hours. After the pretreatment, AC was then added to a solution of phosphoric acid (1 mol L−1 or 2 mol L−1), and stirred at 80 °C for 12 h. The suspension was then heated at 90 °C until a thick slurry was formed, and then calcined in a tube furnace at 400 °C or 500 °C for 2 h under a flow of argon. Finally, the calcined sample was thoroughly rinsed with deionized water and dried in a vacuum oven at 120 °C for 24 h.
Characterization and testing of materials
X-ray photoelectron spectroscopy (XPS) was conducted using an AXIS ULTRA DLD-600W. Raman spectroscopy was performed using a LabRAM HR800 Raman spectrometer. Nitrogen adsorption and desorption isotherms were obtained at 77 K using a Micromeritics TristarII3020 analyzer and the apparent surface areas were calculated using the BET method. The morphology of the products was characterized using field-emission scanning electron microscopy (FESEM, FEI, Sirion 200). Electrochemical experiments were performed in a three-electrode system using a CHI 604E electrochemical workstation (Chen Hua Instruments Co., China). The working electrodes were prepared by painting a slurry containing AC or phosphorus-doped activated carbons (P-ACs), acetylene black and polyvinylidene fluoride binder (80![[thin space (1/6-em)]](https://www.rsc.org/images/entities/char_2009.gif) :
:![[thin space (1/6-em)]](https://www.rsc.org/images/entities/char_2009.gif) 10
10![[thin space (1/6-em)]](https://www.rsc.org/images/entities/char_2009.gif) :
:![[thin space (1/6-em)]](https://www.rsc.org/images/entities/char_2009.gif) 10 wt%) on the titanium foil (99.9% purity) and subsequent sintering at 120 °C for 12 h in vacuum. A platinum electrode was used as the counter electrode and Hg/Hg2SO4 was applied as the reference electrode. The electrolyte was 5 mol L−1 H2SO4.
10 wt%) on the titanium foil (99.9% purity) and subsequent sintering at 120 °C for 12 h in vacuum. A platinum electrode was used as the counter electrode and Hg/Hg2SO4 was applied as the reference electrode. The electrolyte was 5 mol L−1 H2SO4.
Details of theoretical computation
Density functional theory (DFT) was used to investigate the adsorption energies of H+ ions on different C atoms in AC and the P-AC carbon matrix. All DFT calculations were performed using the CASTEP package on the basis of the plane-wave-pseudo-potential approach. The exchange–correlation function of all calculations adopted the Perdew–Burke–Ernzerhof (PBE) generalized gradient approximation (GGA). The ultrasoft pseudopotential was used to simulate the interaction between the valence electrons and ionic core. The cut-off energy of 340 eV and the Monkhorst–Pack k-point mesh of 1 × 1 × 2 were adopted to conduct the geometry optimization calculations. The convergence tolerances of energy, force, stress, and displacement for the optimized calculation were 1.0 × 10⁻⁵ eV per atom, 0.03 eV Å−1, 0.05 GPa, and 0.001 Å, respectively. The highest cut-off energy and widest Monkhorst–Pack k-point mesh were determined and little change in the structure and free energy of the constructed model was observed, confirming the high accuracy of the present calculations. The adsorption energy (Eads) of H+ ion on the AC and the P-AC carbon matrix was determined using the following formula:| | |
Eads = Esurface + EH+ − Ecomplex
| (1) |
where, Esurface is the free energy of AC and the P-AC carbon matrix, EH+ is the free energy of the H+ ion, and Ecomplex is the total free energy of the H+-adsorbed AC and P-AC carbon matrix.
Performance measurements of the batteries
2 V 1.5 A h simulated lead-acid batteries were assembled as follows: 1.5 wt% AC and P-AC, respectively, was added to the negative plates, which contain lead powder, 0.1 wt% ligin, 0.2 wt% acetylene black, 0.6 wt% humic acid and 0.8 wt% barium sulfate, during the mixing of lead paste, and then coated on a Pb–Ca grid, and dried at 60 °C for 48 h. Each 2 V 1.5 A h test cell immersed in 1.27 g cm−3 H2SO4 aqueous electrolyte was assembled with one negative plate and two positive plates (PbO2). The cells were charged to 2.45 V at a 0.1C rate, and the voltage was kept constant at 2.45 V for 12 h. Then, the cells were discharged to 50% State-of-Charge (SoC) at a 0.1C rate. After this, the cells were cycled according to the following procedure: charge at a 2C rate for 90 s (upper voltage limit of 2.45 V), rest for 10 s, discharge at a 2C rate for 60 s, and rest for 10 s. The cell voltage was measured at the end of the discharge pulses, and the cycling test was stopped when the last cell discharge voltage dropped to 1.7 V.
Results and discussion
XPS was conducted to identify the elemental compositions and phosphorus bonding modes in P-ACs. The XPS spectrum of P-ACs (Fig. 1a) shows three characteristic peaks at ca. 285, 533.2, and 134.9 eV, which correspond to C 1s, O 1s, and P 2p, respectively. As shown in Fig. 1b, the C 1s peak of P-AC can be deconvoluted into four different components located at about 284.9, 285.6, 287.1, and 289.7 eV, which can be attributed to C–C, C–O, C–P, and C![[double bond, length as m-dash]](https://www.rsc.org/images/entities/char_e001.gif) O bonding, respectively. The high-resolution P 2p spectrum of P-AC (Fig. 1c) reveals two peaks at 134.6 and 135.4 eV, which are assigned to the P–C and P–O bonding, respectively.14 These results strongly suggest that phosphorus atoms are successfully incorporated into the lattice of AC. Moreover, the existence of a P–O phase implies that the doped P atoms are partially oxidized, which favors the inhibition of the HER on P-ACs.15 The content of phosphorus is determined to be 1.93–3.92 at% by XPS elemental analysis, depending on the concentration of H3PO4 and the sintering temperature, as summarized in Table 1. Further structural information on the P-ACs was obtained by Raman analysis, as shown in Fig. 1d. The two distinct peaks at ca. 1338 cm−1 and 1580 cm−1 are attributed to the D band and G band, respectively. The D/G intensity ratio (ID/IG) increases from 0.981 for AC to 1.004 for P-AC, which indicates that the structural defects increase with phosphorus doping.16 Besides, the nitrogen adsorption and desorption isotherms (Fig. 2a) indicate a slight decrease in the BET surface area from 2340.8 m2 g−1 (micropore area of 717.6 m2 g−1 and external surface area of 1623.1 m2 g−1) to 2110.8 m2 g−1 (micropore area of 734.8 m2 g−1 and external surface area of 1376.0 m2 g−1) after phosphorus doping. The slightly smaller BET surface area of P-AC maybe beneficial to inhibit the HER on the carbon surface because of the relatively less adsorption sites of H+. In addition, the indiscernible morphology change (Fig. 2b and c) from the SEM images of AC and P-AC indicates that there is no obvious influence on the morphology after phosphorus doping.
O bonding, respectively. The high-resolution P 2p spectrum of P-AC (Fig. 1c) reveals two peaks at 134.6 and 135.4 eV, which are assigned to the P–C and P–O bonding, respectively.14 These results strongly suggest that phosphorus atoms are successfully incorporated into the lattice of AC. Moreover, the existence of a P–O phase implies that the doped P atoms are partially oxidized, which favors the inhibition of the HER on P-ACs.15 The content of phosphorus is determined to be 1.93–3.92 at% by XPS elemental analysis, depending on the concentration of H3PO4 and the sintering temperature, as summarized in Table 1. Further structural information on the P-ACs was obtained by Raman analysis, as shown in Fig. 1d. The two distinct peaks at ca. 1338 cm−1 and 1580 cm−1 are attributed to the D band and G band, respectively. The D/G intensity ratio (ID/IG) increases from 0.981 for AC to 1.004 for P-AC, which indicates that the structural defects increase with phosphorus doping.16 Besides, the nitrogen adsorption and desorption isotherms (Fig. 2a) indicate a slight decrease in the BET surface area from 2340.8 m2 g−1 (micropore area of 717.6 m2 g−1 and external surface area of 1623.1 m2 g−1) to 2110.8 m2 g−1 (micropore area of 734.8 m2 g−1 and external surface area of 1376.0 m2 g−1) after phosphorus doping. The slightly smaller BET surface area of P-AC maybe beneficial to inhibit the HER on the carbon surface because of the relatively less adsorption sites of H+. In addition, the indiscernible morphology change (Fig. 2b and c) from the SEM images of AC and P-AC indicates that there is no obvious influence on the morphology after phosphorus doping.
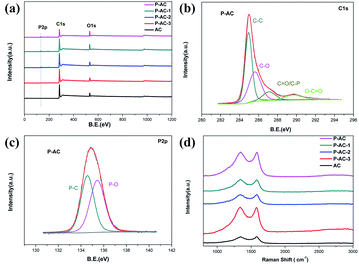 |
| | Fig. 1 (a) XPS of AC and P-ACs. (b) High resolution C 1s of P-AC. (c) High resolution P 2p of P-AC. (d) Raman spectra of AC and P-ACs. | |
Table 1 The contents of phosphorus determined by quantitative XPS elemental analysis
| Sample |
Sintering temperature °C |
Concentration of H3PO4 mol L−1 |
P content at% |
O content at% |
C content at% |
| P-AC |
400 |
2 |
3.92 |
15.17 |
80.92 |
| P-AC-1 |
400 |
1 |
2.72 |
10.86 |
86.42 |
| P-AC-2 |
500 |
2 |
2.09 |
7.01 |
90.9 |
| P-AC-3 |
500 |
1 |
1.93 |
4.95 |
93.12 |
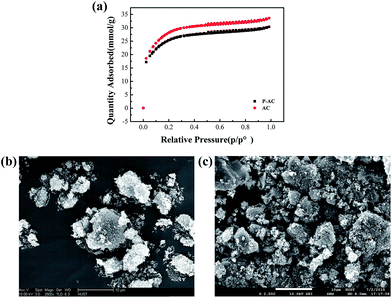 |
| | Fig. 2 (a) Nitrogen adsorption and desorption isotherms of AC and P-AC. SEM images of (b) AC and (c) P-AC. | |
Electrochemical test and analysis
The linear sweep voltammetry (LSV) curves of AC and P-ACs under the scan rate of 1 mV s−1 are presented in Fig. 3a. The HER current density of AC is lower as compared to that of HNO3-AC, but much higher than that of P-AC over the entire potential range, which is about 17 times at −1.35 V vs. Hg/Hg2SO4. The higher content of phosphorus atoms in P-AC leads to a lower HER current density. Compared to the previously reported additives, P-doped AC exhibits a more remarkable inhibition of HER, where the hydrogen evolution current is reduced by 94.12%, whereas other commonly used additives, such as N-doped AC,12 4% In2O3-AC,21 and 4% Bi2O3-AC,22 reduce the current by 88%, 58.99%, and 32.6%, respectively. More importantly, P-AC displays a significantly decreased HER onset potential of −1.21 V, which is much more negative than that of AC (−0.97 V). The more negative onset potential as well as the lower current density of P-ACs indicate that phosphorus atoms doped into the AC structure inhibit the HER. The kinetic parameters of the HER for both the original AC and P-AC were obtained by fitting the i–E data to the Tafel equation (Fig. 3b), which yielded Tafel slopes of 218 mV dec−1, 221 mV dec−1, 179 mV dec−1, 156 mV dec−1, 155 mV dec−1, and 174 mV dec−1 for AC, HNO3-AC, P-AC, P-AC-1, P-AC-2, and P-AC-3, respectively. The exchange current density, j0, is 2.40 × 10⁻⁶, 6.95 × 10⁻⁶, 3.66 × 10⁻⁸, 3.81 × 10⁻⁸, 4.81 × 10⁻⁸, and 1.45 × 10⁻⁷ mA cm−2 for AC, HNO3-AC, P-AC, P-AC-1, P-AC-2, and P-AC-3, respectively. Especially, the j0 decreases from 2.40 × 10⁻⁶ mA cm−2 for AC to 3.66 × 10⁻⁸ mA cm−2 for P-AC, which implies that the activity of the HER is effectively suppressed with the incorporation of phosphorus into the AC lattices.
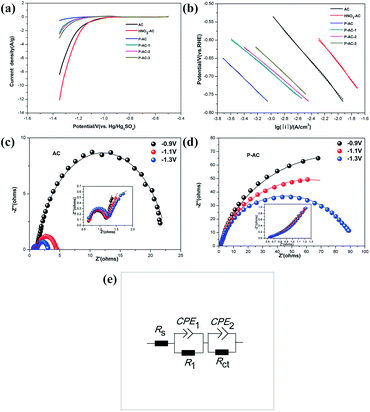 |
| | Fig. 3 (a) LSV curves of AC and P-ACs. (b) Tafel plots of AC and P-ACs. (c) EIS of AC. (d) EIS of P-AC and (e) equivalent circuit, scan rate: 1 mV s−1. | |
The HER activities of AC and P-AC were also investigated using electrochemical impedance measurements in the lead-carbon battery working potential range, as shown in Fig. 3c and d. The Nyquist diagrams consist of two strongly overlapped capacitive semicircles. The high frequency semicircle is almost independent of the potential and is attributed to the electrode microstructure change, whereas the low frequency semicircle, which varies with the potential, is assigned to the HER kinetics.17,18 The impedance data was further interpreted using the equivalent electric circuit,19 as depicted in Fig. 3e. As shown in Table 2, the charge transfer resistance, Rct, of AC significantly increases with phosphorus doping, especially under high polarization, from 1.87 of AC to 89 Ω of P-AC at −1.3 V (vs. Hg/Hg2SO4). This indicates that the activity of the HER is remarkably suppressed with phosphorus doping.
Table 2 Parameters obtained for the AC and P-ACs electrodes from EIS
| |
Potential (V vs. Hg/Hg2SO4) |
Rs (Ω) |
CPE1 (F) |
R (Ω) |
CPE2 (F) |
Rct (Ω) |
| AC |
−0.9 |
0.640 |
9.00 × 10⁻⁶ |
0.587 |
1.39 × 10⁻³ |
21.75 |
| −1.1 |
0.664 |
3.40 × 10⁻⁶ |
0.546 |
1.73 × 10⁻³ |
3.26 |
| −1.3 |
0.648 |
3.30 × 10⁻⁶ |
0.606 |
1.21 × 10⁻³ |
1.87 |
| P-AC |
−0.9 |
0.587 |
9.50 × 10⁻² |
0.975 |
4.96 × 10⁻³ |
166.00 |
| −1.1 |
0.596 |
9.90 × 10⁻² |
0.947 |
5.51 × 10⁻³ |
121.90 |
| −1.3 |
0.579 |
9.00 × 10⁻² |
1.024 |
4.07 × 10⁻³ |
89.00 |
| P-AC-1 |
−1.3 |
0.597 |
1.38 × 10⁻¹ |
3.404 |
1.87 × 10⁻³ |
41.20 |
| P-AC-2 |
−1.3 |
0.726 |
1.04 × 10⁻² |
0.866 |
1.55 × 10⁻³ |
14.24 |
| P-AC-3 |
−1.3 |
0.625 |
3.22 × 10⁻³ |
2.996 |
1.93 × 10⁻³ |
6.844 |
Result and analysis of theoretical computation
The inhibition effect on HER with phosphorus doping can be explained by the charge redistribution induced by the difference between the electronegativities of phosphorus and carbon. The P atom is covalently bonded with C, as confirmed by XPS. The electrons of the P atom, which has a lower electronegativity than the C atom, will be withdrawn by the C atoms, leaving the adjacent C atoms negatively charged.20 Further calculation of the adsorption energies of H+ on the carbon atoms in AC and P-AC carbon matrix were carried out using the density functional theory (DFT). As shown in Fig. 4, the adsorption energies of H+ on P-AC at different corresponding sites are calculated to be 3.17, 2.84, and 2.56 eV, which are much higher than that of AC (1.71, 1.87, and 1.08 eV, respectively). The higher adsorption energy of H+ makes the desorption process of H+ more difficult and may lead to a high overpotential of the HER, thus resulting in the effective inhibition of the HER, which is also consistent with the LSV results and electrochemical impedance spectra.
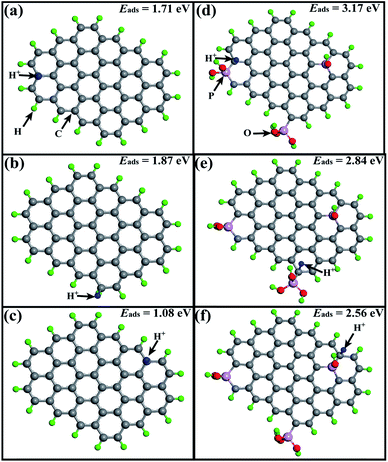 |
| | Fig. 4 Optimized geometric structures and adsorption energies of H+ at different corresponding sites on AC (a–c) and P-AC (d–f). | |
Cycle performance of the lead-carbon batteries under HRPSoC conditions
The cycle performance of 2 V simulated lead-acid batteries after the addition of 1.5 wt% AC or P-AC were obtained by HRPSoC testing, as shown in Fig. 5. The HRPSoC cycle performance of the cell with P-AC is obviously prolonged, reaching 4332 cycles, which is about 1.5 times compared with the 2896 cycles of the cell with AC. The cell with AC obtains less cycles because of its more severe hydrogen evolution, which leads to more water loss of the cell.21,22 By contrast, benefiting from the hydrogen evolution inhibition effect after phosphorus doping, the cell with P-AC added has a much better HRPSoC cycle performance.
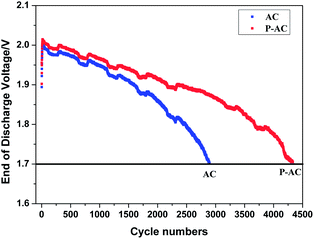 |
| | Fig. 5 HRPSoC cycling performance of the 2 V 1.5 A h simulated lead-acid batteries. | |
Conclusions
In summary, we successfully synthesized phosphorus-doped activated carbons via a novel, low-cost, and scalable method. The phosphorus is covalently bonded with carbon, thus creating a negative charge on the adjacent C atoms, which accelerates the formation of adsorbed hydrogen but makes the desorption process of H+ more difficult, thus resulting in significant inhibition of the HER on the carbon surface, which is further confirmed by the adsorption energy calculation of H+. Especially, a higher content of phosphorus atoms leads to a lower HER current density. Above all, the cell with added P-AC has a much better HRPSoC cycle performance than the cell with added AC. This study may provide a new strategy to develop high performance carbon materials with inhibited hydrogen evolution as promising additives for lead-carbon batteries and other electrochemical energy storage applications.
Acknowledgements
This research was supported by the Science and Technology Program of State Grid Corporation of China (Program Name: Study on preparation of new carbon materials for lead carbon batteries, No. DG71-15-020), the Natural Science Foundation of China (Grants: 51622703) and the National Thousand Talents Program of China.
Notes and references
- J. Albers, E. Meissner and S. Shirazi, J. Power Sources, 2011, 196, 3993–4002 CrossRef CAS.
- H. Li, H. Liu, Q. Wang, H. Chen, A. Ren and J. Hu, Electrochim. Acta, 2010, 56, 663–666 CrossRef CAS.
- L. Lam, N. Haigh, C. Phyland and A. Urban, J. Power Sources, 2004, 133, 126–134 CrossRef CAS.
- L. Lam, N. Haigh, C. Phyland and T. Huynh, J. Power Sources, 2005, 144, 552–559 CrossRef CAS.
- K. M. S. Nakarnura, K. Takahashi and M. Tsubota, J. Power Sources, 1996, 59, 153–157 CrossRef.
- D. Pavlov, T. Rogachev, P. Nikolov and G. Petkova, J. Power Sources, 2009, 191, 58–75 CrossRef CAS.
- F. Wang, C. Hu, M. Zhou, K. Wang, J. Lian and J. Yan, Sci. Bull., 2016, 61, 451–458 CrossRef CAS.
- L. T. Lam and R. Louey, J. Power Sources, 2006, 158, 1140–1148 CrossRef CAS.
- M. Okido, J. K. Depo and G. A. Capuano, J. Electrochem. Soc., 1993, 140, 127–133 CrossRef CAS.
- B. Zhang, Z. Wen, S. Ci, J. Chen and Z. He, RSC Adv., 2014, 4, 249–281 Search PubMed.
- L. Dai, Y. Xue, L. Qu, H.-J. Choi and J.-B. Baek, Chem. Rev., 2015, 115, 4823–4892 CrossRef CAS PubMed.
- B. Hong, X. Yu, L. Jiang, H. Xue, F. Liu and J. Li, RSC Adv., 2014, 4, 33574–33577 RSC.
- W. Li, M. Zhou, H. Li, K. Wang, S. Cheng and K. Jiang, Energy Environ. Sci., 2015, 8, 2916–2921 CAS.
- Z. Wang, P. Li, Y. Chen, J. He, J. Liu and W. Zhang, J. Power Sources, 2014, 263, 246–251 CrossRef CAS.
- R. Li, Z. Wei, X. Gou and W. Xu, RSC Adv., 2013, 3, 9978–9984 RSC.
- Z. W. Liu, F. Peng, H. J. Wang, H. Yu, W. X. Zheng and J. Yang, Angew. Chem., 2011, 123, 3315–3319 CrossRef.
- L. Birry and A. Lasia, J. Appl. Electrochem., 2004, 34, 735–749 CrossRef CAS.
- R. K. Shervedani and A. R. Madram, Electrochim. Acta, 2007, 53, 426–433 CrossRef CAS.
- A. Döner, R. Solmaz and G. Kardaş, Int. J. Hydrogen Energy, 2011, 36, 7391–7397 CrossRef.
- H. L. Poh and M. Pumera, ChemElectroChem, 2015, 2, 190–199 CrossRef CAS.
- L. Zhao, B. Chen and D. Wang, J. Power Sources, 2013, 231, 34–38 CrossRef CAS.
- L. Zhao, B. Chen, J. Wu and D. Wang, J. Power Sources, 2014, 248, 1–5 CrossRef CAS.
|
| This journal is © The Royal Society of Chemistry 2017 |
Click here to see how this site uses Cookies. View our privacy policy here.  Open Access Article
 *a
*a
![[thin space (1/6-em)]](https://www.rsc.org/images/entities/char_2009.gif) :
:![[thin space (1/6-em)]](https://www.rsc.org/images/entities/char_2009.gif) 10
10![[thin space (1/6-em)]](https://www.rsc.org/images/entities/char_2009.gif) :
:![[thin space (1/6-em)]](https://www.rsc.org/images/entities/char_2009.gif) 10 wt%) on the titanium foil (99.9% purity) and subsequent sintering at 120 °C for 12 h in vacuum. A platinum electrode was used as the counter electrode and Hg/Hg2SO4 was applied as the reference electrode. The electrolyte was 5 mol L−1 H2SO4.
10 wt%) on the titanium foil (99.9% purity) and subsequent sintering at 120 °C for 12 h in vacuum. A platinum electrode was used as the counter electrode and Hg/Hg2SO4 was applied as the reference electrode. The electrolyte was 5 mol L−1 H2SO4.
![[double bond, length as m-dash]](https://www.rsc.org/images/entities/char_e001.gif) O bonding, respectively. The high-resolution P 2p spectrum of P-AC (Fig. 1c) reveals two peaks at 134.6 and 135.4 eV, which are assigned to the P–C and P–O bonding, respectively.14 These results strongly suggest that phosphorus atoms are successfully incorporated into the lattice of AC. Moreover, the existence of a P–O phase implies that the doped P atoms are partially oxidized, which favors the inhibition of the HER on P-ACs.15 The content of phosphorus is determined to be 1.93–3.92 at% by XPS elemental analysis, depending on the concentration of H3PO4 and the sintering temperature, as summarized in Table 1. Further structural information on the P-ACs was obtained by Raman analysis, as shown in Fig. 1d. The two distinct peaks at ca. 1338 cm−1 and 1580 cm−1 are attributed to the D band and G band, respectively. The D/G intensity ratio (ID/IG) increases from 0.981 for AC to 1.004 for P-AC, which indicates that the structural defects increase with phosphorus doping.16 Besides, the nitrogen adsorption and desorption isotherms (Fig. 2a) indicate a slight decrease in the BET surface area from 2340.8 m2 g−1 (micropore area of 717.6 m2 g−1 and external surface area of 1623.1 m2 g−1) to 2110.8 m2 g−1 (micropore area of 734.8 m2 g−1 and external surface area of 1376.0 m2 g−1) after phosphorus doping. The slightly smaller BET surface area of P-AC maybe beneficial to inhibit the HER on the carbon surface because of the relatively less adsorption sites of H+. In addition, the indiscernible morphology change (Fig. 2b and c) from the SEM images of AC and P-AC indicates that there is no obvious influence on the morphology after phosphorus doping.
O bonding, respectively. The high-resolution P 2p spectrum of P-AC (Fig. 1c) reveals two peaks at 134.6 and 135.4 eV, which are assigned to the P–C and P–O bonding, respectively.14 These results strongly suggest that phosphorus atoms are successfully incorporated into the lattice of AC. Moreover, the existence of a P–O phase implies that the doped P atoms are partially oxidized, which favors the inhibition of the HER on P-ACs.15 The content of phosphorus is determined to be 1.93–3.92 at% by XPS elemental analysis, depending on the concentration of H3PO4 and the sintering temperature, as summarized in Table 1. Further structural information on the P-ACs was obtained by Raman analysis, as shown in Fig. 1d. The two distinct peaks at ca. 1338 cm−1 and 1580 cm−1 are attributed to the D band and G band, respectively. The D/G intensity ratio (ID/IG) increases from 0.981 for AC to 1.004 for P-AC, which indicates that the structural defects increase with phosphorus doping.16 Besides, the nitrogen adsorption and desorption isotherms (Fig. 2a) indicate a slight decrease in the BET surface area from 2340.8 m2 g−1 (micropore area of 717.6 m2 g−1 and external surface area of 1623.1 m2 g−1) to 2110.8 m2 g−1 (micropore area of 734.8 m2 g−1 and external surface area of 1376.0 m2 g−1) after phosphorus doping. The slightly smaller BET surface area of P-AC maybe beneficial to inhibit the HER on the carbon surface because of the relatively less adsorption sites of H+. In addition, the indiscernible morphology change (Fig. 2b and c) from the SEM images of AC and P-AC indicates that there is no obvious influence on the morphology after phosphorus doping.


