 Open Access Article
Creative Commons Attribution 3.0 Unported Licence
ZrO2 nanofibers/activated carbon composite as a novel and effective electrode material for the enhancement of capacitive deionization performance
Ahmed S. Yasin a,
M. Obaidab,
Ibrahim M. A. Mohamedac,
Ahmed Yousefa and
Nasser A. M. Barakat*ab
aBionanosystem Engineering Department, Chonbuk National University, Jeonju 561-756, Republic of Korea. E-mail: nasser@jbnu.ac.kr; Fax: +82632702348; Tel: +82632702363
bChemical Engineering Department, Faculty of Engineering, El-Minia University, El-Minia, Egypt
cChemistry Department, Faculty of Science, Sohag University, Sohag 82524, Egypt
First published on 16th January 2017
Abstract
Among the various forms of carbon materials, activated carbon still possesses the maximum attention as an optimum commercially available, cheap, and effective electrode material for the capacitive deionization desalination process. However, the well-known hydrophobicity and low specific capacitance limit its wide application. In this study, incorporation of zirconia nanofibers with activated carbon is reported as an effective and simple strategy to overcome the abovementioned problems. Typically, zirconia nanofibers, which were synthesized by the calcination of electrospun nanofiber mats, were added to the activated carbon to fabricate novel electrodes for the capacitive deionization units. In a single-mode cell, it was observed that the addition of the proposed metal oxide nanofibers distinctly enhanced the desalination process as the electrosorption capacity and the salt removal efficiency improved from 5.42 to 16.35 mg g−1 and from 16.37% to 53.26% for the pristine and composite electrodes, respectively. However, the inorganic nanofiber content should be optimized; a composite having 10 wt% zirconia nanofibers with respect to the activated carbon showed the best performance. This distinct enhancement in the performance is attributed to the improvement in the wettability and specific capacitance of the electrode. Numerically, the water contact angle and the specific capacitance of the pristine and composite electrodes were found to be 145° and 26.5°, and 875 and 225 F g−1, respectively. Overall, the present study strongly draws attention towards zirconia nanostructures as effective, cheap, environmentally friendly, and biologically safe candidates to enhance the performance of capacitive deionization electrodes.
1. Introduction
Due to the increasing demand for the drinking water with the continuing growth of the human population, the scarcity of freshwater, as a critical worldwide problem, poses one of the greatest threats to humanity.1,2 Desalination of sea or brackish water has grown to be a main alternative means to solve this issue and relieve the shortage of freshwater.3 Currently, traditional water purification technologies, including reverse osmosis, multi-stage flash distillation, ion exchange, and electrodialysis, are widely used in water desalination; however, it is well-known that these techniques have several issues including maintenance, complex pretreatment, high-cost, and excessive energy consumption.4 Therefore, to overcome these disadvantages, new desalination technologies are required. Capacitive deionization (CDI) is an electrochemically controlled technique that has gained significant awareness because it has demonstrated several advantageous properties, such as low direct voltages, low pressure, low-cost, lack of secondary pollution, and environmentally-friendliness, in water desalination.5,6 The mechanism of CDI is related to energy storage using supercapacitors,7,8 but with distinct variations. By applying an external voltage to the electrodes, the ions in the solution can be moved to the surface of the charged electrodes; thus, an electrical double layer is formed and this is the ion removal or charging-step. After some time, the charge is reduced or even reversed such that the adsorbed ions are desorbed and returned to the bulk solution: the discharging step.9,10According to the abovementioned mechanism, in the CDI unit, the electrode features are the key parameters for achieving the whole adsorption and desorption processes within a desired time period. Therefore, considerable efforts have been focused on the electrode materials. The main features of the optimum CDI electrode material can be summarized as follows: excellent chemical stability, low-cost, large surface area, high adsorption capacity, good wettability, high conductivity, high specific capacitance, high porosity, and high mechanical strength.11 Since carbon-based electrodes meet most of the abovementioned characteristics, they have been widely exploited as electrodes in the CDI units. Many forms of carbon, including activated carbon (AC),12,13 carbon aerogels (CAs),14,15 carbon nanotubes (CNTs),16,17 carbon nanofibers (CNFs),18 and reduced graphene oxide (RG),19 have been investigated for CDI electrodes. However, it is fundamental to prepare nanoporous carbon electrodes at the lowest manufacturing cost in addition to the abovementioned characteristics. Accordingly, activated carbon (AC) is the best candidate due to its low-cost, distinctly high surface area (1000–2000 m2 g−1), and high electrical conductivity.20 Moreover, as it is known, AC contains crevices, cracks, and some grains with many holes on its outer surface and these holes account for the large specific surface area, hence providing abundant tunnels for the entrance of ions during the CDI operation. However, the well-known high hydrophobicity and low specific capacitance of the AC are the main constraints preventing their wide usage in a pristine form.21 Hence, many attempts have been made to solve these problems.22
Some metal oxides (e.g. TiO2, ZrO2, and SiO2) possess many properties, such as high durability in the aqueous solution, eco-friendliness, and possessing high hydrophilicity, which distinctly enhances the wettability of the electrode,23 that can beneficially improve the CDI electrodes. Among the applicable metal oxides, zirconia (ZrO2) has very good features due to its low-cost, eco-friendliness, good chemical inertness, and it possesses great capability for the photocatalytic degradation of organic pollutants and destruction of some microorganisms. Moreover, it can increase the specific capacity and wettability of the CDI electrodes.24
On the other hand, it has been reported that the large axial ratio provides a priority to the nanofibers over other nanostructures in the electron transfer-based processes.25 Therefore, incorporation of ZrO2 nanofibers into AC, as an unreported composite, is expected to enhance the accessibility for ion adsorption and CDI performance.
In this study, ZrO2 nanofibers (NFs), synthesized by the electrospinning process, are introduced as an effective additive to the AC to produce a high performance CDI electrode. The novel ZrO2 NFs/AC hybrid network CDI electrode revealed a distinct performance compared to the pristine AC electrode in a continuous flow-mode CDI unit. The introduced electrode was investigated under various factors during the CDI operation. Note that the introduced network composite shows many CDI standard electrode advantages such as low resistance for salt ions transport, high wettability, high specific capacitance, and easy regeneration.
2. Experimental
2.1. Materials
Zirconium(IV) isopropoxide (Zr(Iso); Zr(OCH2CH2CH3)4 solution 70 wt% in 1-propanol), acetic acid (99.5 assay), and poly(vinyl acetate) (PVAc; M.wt. = 500![[thin space (1/6-em)]](https://www.rsc.org/images/entities/char_2009.gif) 000 g mol−1) were obtained from Sigma-Aldrich. N,N-Dimethylformamide (DMF 99.5% assay; Junsei Chemical Co., Ltd.) was used as a solvent. Activated carbon powder (CEP-21K, PCT Co., Korea, BET surface area = 2110 m2 g−1) was used as a matrix in the introduced composite. Poly(vinylidene fluoride) (PVDF, MW = 530
000 g mol−1) were obtained from Sigma-Aldrich. N,N-Dimethylformamide (DMF 99.5% assay; Junsei Chemical Co., Ltd.) was used as a solvent. Activated carbon powder (CEP-21K, PCT Co., Korea, BET surface area = 2110 m2 g−1) was used as a matrix in the introduced composite. Poly(vinylidene fluoride) (PVDF, MW = 530![[thin space (1/6-em)]](https://www.rsc.org/images/entities/char_2009.gif) 000 g mol−1, Aldrich) and dimethylacetamide (DMAc, Aldrich) were used to fabricate the electrodes. All reagents were utilized without any extra purification.
000 g mol−1, Aldrich) and dimethylacetamide (DMAc, Aldrich) were used to fabricate the electrodes. All reagents were utilized without any extra purification.
2.2. Preparation of ZrO2 nanofibers
ZrO2 nanofibers were prepared using a sol–gel method in which Zr(Iso) was exploited as a precursor for zirconia. First, Zr(Iso) was added in a dropwise manner to poly(vinyl acetate) (PVAc, 14 wt% in DMF) with a weight ratio of 1![[thin space (1/6-em)]](https://www.rsc.org/images/entities/char_2009.gif) :
:![[thin space (1/6-em)]](https://www.rsc.org/images/entities/char_2009.gif) 2 followed by the addition of a few drops of acetic acid until the solution became clear and was a consistent mixture. The final solution was stirred at 25 °C for 2 h to form a sol–gel. Later on, the obtained sol–gel was subjected to the electrospinning process at 20 kV with 18 cm distance between the tip and the collector. The obtained nanofiber mats were dried under vacuum for 24 h at 60 °C and finally sintered at 700 °C for 1 h in air with a heating rate of 5 °C min−1.
2 followed by the addition of a few drops of acetic acid until the solution became clear and was a consistent mixture. The final solution was stirred at 25 °C for 2 h to form a sol–gel. Later on, the obtained sol–gel was subjected to the electrospinning process at 20 kV with 18 cm distance between the tip and the collector. The obtained nanofiber mats were dried under vacuum for 24 h at 60 °C and finally sintered at 700 °C for 1 h in air with a heating rate of 5 °C min−1.
2.3. CDI unit cell setup and electrosorptive capacity measurements
To investigate the influence of the zirconia nanofibers content, four ZrO2 NFs/AC mixtures were prepared by changing the metal oxide content. Typically, 0, 5, 10, and 15 wt% nanofiber content was chosen with respect to that of AC. To have a proper blending, the mixtures were sonicated in pure acetone for 30 min, and then the slurry was filtered and dried under vacuum at 80 °C for 24 h. The CDI electrodes were fabricated as follows: a mixture from the formed ZrO2 NFs/AC composite, dimethylacetamide (DMAc), and polyvinylidene fluoride (PVDF, M.W. = 530![[thin space (1/6-em)]](https://www.rsc.org/images/entities/char_2009.gif) 000 g mol−1) with a weight ratio of 8
000 g mol−1) with a weight ratio of 8![[thin space (1/6-em)]](https://www.rsc.org/images/entities/char_2009.gif) :
:![[thin space (1/6-em)]](https://www.rsc.org/images/entities/char_2009.gif) 1
1![[thin space (1/6-em)]](https://www.rsc.org/images/entities/char_2009.gif) :
:![[thin space (1/6-em)]](https://www.rsc.org/images/entities/char_2009.gif) 1 was well ground to form a homogeneous slurry. The mixed slurry was then coated on a high corrosion resistant stainless steel sheet and dried at 60 °C for 2 h to remove the organic solvent. The size of the electrode was 5 × 5 cm2 with a thickness of 800 μm.
1 was well ground to form a homogeneous slurry. The mixed slurry was then coated on a high corrosion resistant stainless steel sheet and dried at 60 °C for 2 h to remove the organic solvent. The size of the electrode was 5 × 5 cm2 with a thickness of 800 μm.
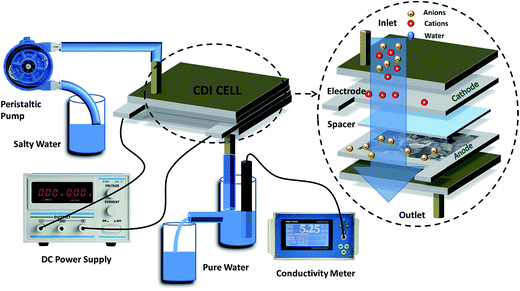
Capacitive deionization experiments were conducted in a flow-through system, as shown in Fig. 1. The system consisted of a reservoir, peristaltic pump, CDI unit cell, and conductivity meter. The CDI unit cell was composed of two parallel similarly prepared CDI electrodes separated by a non-conductive spacer (nylon cloth, 100 μm thick). The salty solution was continuously pumped into the CDI cell at 30 mL min−1 with an initial conductivity of 104 μS cm−1 using a single-pass method (SP-method). Note that the electrosorption capacity (Q) and the salt removal efficiency (ηd) of the electrode were exactly calculated based on the newly presented integration equations rather than the conventionally used ones:26
 | (1) |
 | (2) |
2.4. Characterization
The crystallinity and phase were investigated using a Rigaku X-ray diffractometer (Rigaku Co., Japan) with Cu Kα (λ = 1.540 Å) radiation over a 2θ range from 10° to 80°. The surface morphology was examined using a JEOL JSM-5900 scanning electron microscope (JEOL Ltd., Japan). High-resolution images were obtained using a JEOL JEM 2010 transmission electron microscope (TEM) operating at 200 kV (JEOL Ltd., Japan) equipped with EDX to study the elemental distribution. The specific surface areas of the fabricated materials, were determined by the Brunauer–Emmett–Teller (BET) method of nitrogen sorption at 77 K using a Micromeritics Tristar 3000 analyzer. The electrochemical performance of the electrodes was tested by cyclic voltammetry (CV) using a VersaStat4 potentiostat device.2.5. Electrochemical properties of the synthesized electrode
Cyclic voltammetry, controlled by VersaStat4 potentiostat device, was carried out using different concentrations of NaCl solution (0.1, 0.5, and 1 M). The sweep potential range was adjusted from −0.4 to 0.6 V [versus Ag/AgCl] in a three electrodes electrochemical cell at room temperature. The used cell contained a platinum wire as counter electrode, Ag/AgCl as reference electrode and the prepared materials as working electrode. The specific capacity could be calculated by integrating the full CV cycle to determine the average value according to the following relationship:27
 | (3) |
3. Results and discussion
3.1. Phase morphology
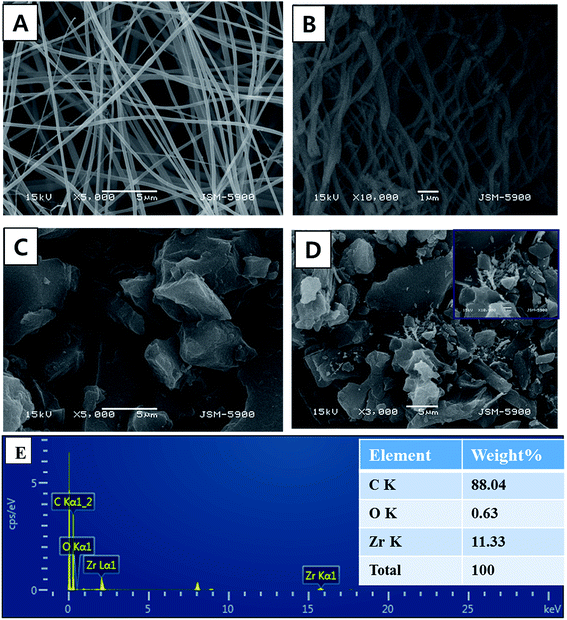
Electrospinning is a simple, high yield, low-cost, and highly versatile method for fabricating nanofibers with a distinct characteristic; hence, it has attracted significant attention in this field.28,29 Inorganic nanofibers can be prepared using a specific metal alkoxide precursor having polycondensation affinity with a proper polymer to form an electrospun sol–gel, which leads to achieving nanofibers with good morphology.30,31 Fig. 2A shows SEM images of the vacuously dried electrospun nanofibers prepared from Zr(Iso)/PVAc. As can be clearly seen in the image, good morphology, continuous, beads-free, and smooth nanofibers were obtained. As abovementioned, due to the polycondensation affinity of the utilized metal alkoxide precursor, calcination of the electrospun nanofiber mats does not considerably affect the nanofibrous morphology, as shown in Fig. 2B. The obtained powder reveals complete, clear, and regularly shaped nanofibers. Fig. 2C shows the SEM image of the AC used. As shown, it exhibits a rock-like shape with an irregular and heterogeneous surface morphology. Fig. 2D illustrates the low resolution SEM images for AC/ZrO2 (10 wt% sample) hybrid networks, whereas the corresponding inset displays a high magnification image. Clearly, the ZrO2 nanofibers are incorporated into the activated carbon, which results in a network structure that decreases the particles agglomeration besides avoiding the blocking of the pores of the activated carbon. The last panel (Fig. 2E) represents the TEM EDX pattern for the AC/ZrO2 (sample in Fig. 2D). As shown, zirconium, oxygen, and carbon peaks can be clearly observed. The inset table displays the weight ratios.The XRD analysis was employed to investigate the crystalline structure of the resulting samples. Fig. 3 displays the XRD patterns of the pure ZrO2 NFs and AC/ZrO2 (10 wt%) composite. The XRD pattern, as shown in Fig. 3A, reveals that the calcination of the Zr(Iso)/PVAc electrospun nanofiber mats results in the formation of nanofibers containing two phases of ZrO2. Typically, the existence of the peaks at 2θ values of 24.04°, 28.16°, 31.46°, 34.21°, and 50.19° indexing to the (1 1 0), (−1 1 1), (1 1 1), (2 0 0), and (0 0 2) crystal planes, respectively, refers to the formation of baddeleyite zirconium dioxide [Sp.Gr P21/a(14), JCPDS card no. 37-1484]. On the other hand, the strong diffraction peaks appeared at 2θ values of 30.5°, 35.2°, 50.6°, and 60.3° corresponding to the crystal planes of (1 1 1), (2 0 0), (2 2 0), and (3 1 1), respectively, designate the formation of cubic phase zirconia (Fm3m(225)) [JCPDS card no. 27-0997]. Fig. 3B displays the XRD pattern of the prepared composite. The peaks corresponding to the metal oxide nanofibers can be clearly observed, which indicates good mixing and simultaneously supports the SEM results (Fig. 2D).
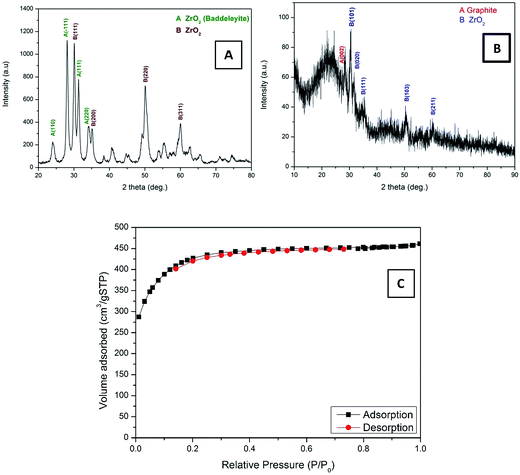 | ||
| Fig. 3 XRD patterns for pure ZrO2 NFs (A), AC/ZrO2 10% (B), and nitrogen adsorption–desorption isotherms of the AC/ZrO2 10% (C). | ||
High surface area is a main factor for the high adsorption/desorption capacity in the CDI technique. Fig. 3C shows the N2 adsorption–desorption isotherms of the AC/ZrO2 10%. It can be seen that the nanocomposite exhibits a typical IUPAC type-IV adsorption isotherm pattern and possesses high surface area compared to the pristine AC, according to the doping with the ZrO2 nanofibers. The BET specific surface area of the AC/Zr (10 wt%) electrode was determined and found to be 4394.05 m2 g−1, whereas the specific surface area for the AC, 5%, and 15% samples were determined to be 2553.77, 2710.5, and 2393.4 m2 g−1, respectively.
Transmission electron microscopy (TEM) can be used to examine the morphology as well as the crystalline and internal structure of the prepared composite. Fig. 4(A and B) represents the TEM and HRTEM images of a part of the calcined ZrO2 nanofibers. Fig. 4A reveals the normal TEM image of the produced nanofibers; as shown, a homogeneous structure was obtained with a relatively rough surface. The corresponding HRTEM image (Fig. 4B) obviously indicates high crystallinity for the prepared nanofibers. Moreover, the measured planar distance (3.06 Å) almost matches the standard cell parameters of ZrO2 (3.17 Å corresponding to the (1 1 0) crystal plane), which confirms the formation of high crystalline ZrO2 nanofibers and is in an excellent agreement with the XRD results (Fig. 3). Fig. 4C displays the TEM images for the pristine AC. As shown, the used AC has flat micro-plates with a rough surface. Fig. 4D displays the TEM image for the prepared composite; as shown, the activated carbon was found to be attached to the ZrO2 nanofibers. Herein, the presence of ZrO2 nanofibers on the surface of activated carbon is useful to control the aggregation of AC particles.
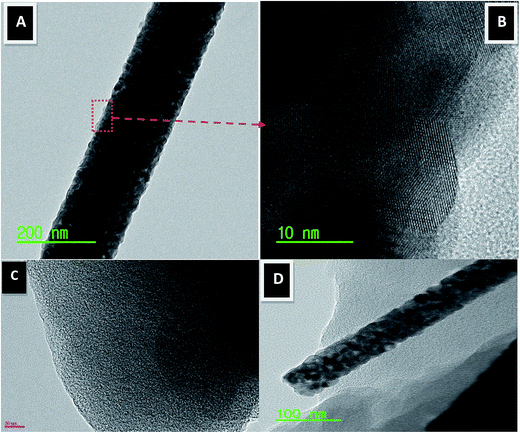 | ||
| Fig. 4 Normal TEM (A) and HR TEM image for the red marked area (B). Panels (C) and (D) display normal TEM images of the pristine activated carbon and AC/Zr 10% nanocomposite, respectively. | ||
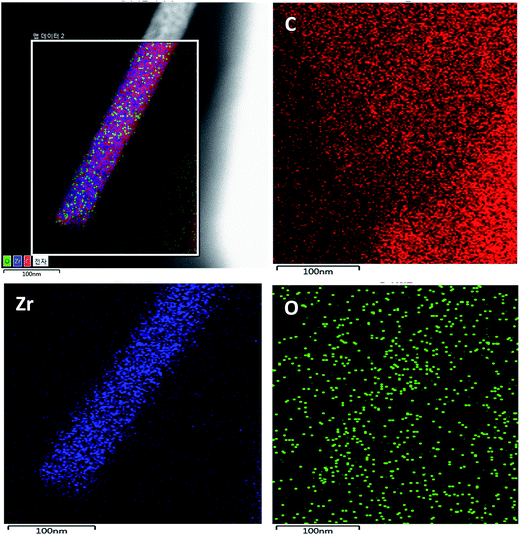
TEM mapping was performed for the proposed composite and the data are shown in Fig. 5. It can be observed that the TEM elemental mapping confirms the presence of carbon, zirconium, and oxygen in the studied nanocomposite. However, carbon is the main element. Moreover, we can see a good distribution of zirconium and oxygen, which confirms the formation of AC/ZrO2 nanocomposite. Detection of oxygen beyond the nanofiber area can be attributed to the oxygenated groups on the AC surface.
3.2. Surface wettability test
The corresponding water contact angle (WCA) of the fabricated electrode was measured to examine the wettability and hydrophilic characteristic, as shown in Fig. 6. Interestingly, the proposed strategy could convert the hydrophobicity of the pristine AC electrode (WCA = 148°) into hydrophilicity. Typically, an addition of 10 wt% ZrO2 NFs leads to a strong decrease in the WCA to 26.9°, which is considered as an excellent achievement. The decrease in the contact angle of the AC/Zr 10% electrode reflects high permeation for the aqueous solutions into the modified electrode without difficulty. Moreover, as a CDI electrode, the good wettability of the proposed composite indicates increase in the adsorption rate from the salty solution to the electrode surface, which is beneficial to its CDI performance. Note that the WCA is reversibly related with the nanofibers content. Typically, the observed WCAs were 148°, 85.5°, 26.9°, and 22.7° for the electrodes having 0, 5, 10, and 15 wt% zirconia nanofibers, respectively.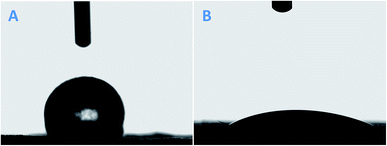 | ||
| Fig. 6 Contact angle of a water droplet on the surface of pristine AC (A) and AC/Zr 10% (B) electrodes. | ||
3.3. Electrochemical behavior
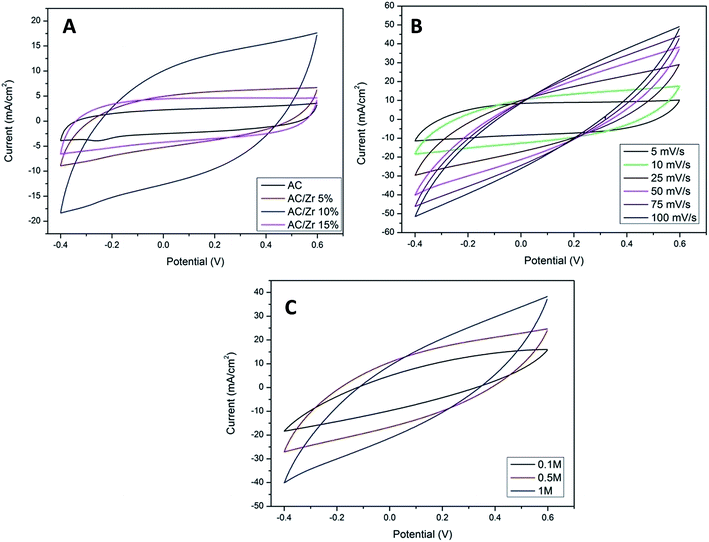
CV measurements were carried out as an effective way to investigate the CDI performance of the electrodes, and thus, the specific capacitance can be accordingly calculated.2 Fig. 7A displays the CV profiles of the AC and AC/ZrO2 (5%, 10%, and 15%) composite electrodes at a scan rate of 10 mV s−1 in a 1 M NaCl aqueous solution with the potential window ranging from −0.4 to 0.6 V. Clearly, the absence of humps associated with the faradic reaction can be detected in the selected potential range. This reveals an ideal capacitive behavior of the fabricated electrodes. The obtained result concludes that the capacitive property originates from the double electric layer formation according to the coulombic interaction instead of the electrochemical oxidation/reduction reaction.32,33 The profiles reveal nearly rectangular shapes with a superb symmetry, reflecting that the salt ions can be rapidly and efficiently adsorbed on and desorbed from the electrode.34 Moreover, the influence of the ZrO2 NFs incorporation on the electrosorption performance can be detected in Fig. 7A. Overall, zirconia addition has a distinctly good influence on the electrochemical properties. However, the data indicated that the nanofibers content should be optimized. As shown, AC/Zr (10 wt% ZrO2 NFs) nanocomposite electrode demonstrates the highest closed area under the CV curve, suggesting high and distinct electrochemical capacitive performances. However, compared to AC/Zr 10 wt%, the AC/Zr 15 wt% reveals noticeable losses in the EDL capacitance, which is attributed to the blockage of the pores of the AC. Furthermore, the low nanofiber content (5 wt%) was not enough to enhance the wettability of the electrode, which reflects low adsorption of ions. The CV curves of the AC/Zr 10% electrode at different scan rates (from 5 to 100 mV s−1) in 1 M NaCl are displayed in Fig. 7B. All the curves reveal no redox peaks, suggesting a good capacitive behavior of the AC/Zr 10% nanocomposite electrode in the selected range of potential window. Moreover, the proposed electrode shows extremely reversible ion adsorption/desorption performances according to the symmetric shapes, which can be observed at any selected sweep rate and reflects fast movement of ions into and out of the electrode.35 Generally, achieving rectangular profiles over a wide range of scan rates is very beneficial for CDI applications.36 Obviously, the CV curves acquire a relatively rectangular shape at a low scan rate such as 5 or 10 mV s−1. However, it can be seen that the profile is gradually converted into a leaf-like shape accompanied with a decrease in the specific capacitance as the scan rate increases to 100 mV s−1. This finding is attributed to the experiment time. In more details, at low scan rate, there is sufficient time for the ions to move and transport to the surface of the fabricated electrode, whereas at a high scan rate, the salt ions do not have sufficient time to penetrate into the inner structure of the electrode. Therefore, the inherent resistivity for ion movement at the high sweep rates affected the formation of the double electric layer behavior.37 The impact of ion concentration on the electrosorption capacity of AC/Zr 10% was also studied; the CV curves at a sweep rate of 50 mV s−1 in 0.1, 0.5, and 1 M NaCl aqueous media with the potential window ranging from −0.4 to 0.6 V are displayed in Fig. 7C. Apparently, the area of the CV profiles is enhanced with the increasing concentration of the solution, and this implies a high specific capacitance and consequently reflects adsorption of numerous ions in the electric double layer region. Overall, it can be claimed that the AC/Zr 10% electrode can reveal good desalination capacity that can be related to the corresponding network diffusion of ZrO2 nanofibers between AC particles without blocking the active pore site of AC.To establish a comparative study, CV measurements were performed for the prepared electrodes at various scan rates: 10, 25, 50, 75, and 100 mV s−1. The specific capacitance (Cs, F g−1) values were estimated based on eqn (3). As shown in Fig. 8A, clearly, the specific capacitance is enhanced when the scan rate descends from 100 to 10 mV s−1. Generally, a lower sweep rate is desirable to achieve an improved specific capacitance, which is attributed to the high access of the salt ions from the solution to the electrode surface. Obviously, compared to the pristine AC and other composite electrodes, the AC/Zr 10% electrode reveals distinctly high specific capacitance and always displays an increased value at any chosen sweep rate. Typically, at 10 mV s−1, the specific capacitance of the AC/Zr 10% electrode is 869.86 F g−1, which is extremely larger than those of AC (207.46 F g−1), AC/Zr 5% (403.01 F g−1), and AC/Zr 15% (361.14 F g−1). Moreover, the specific capacitance was comparatively stable at high sweep rates. Consequently, 10 wt% was the ideal ratio for ZrO2 nanofibers loaded on the AC hybrid CDI electrode. In other words, it can be claimed that the AC/Zr 10% composite possesses the best EDLC behavior among the four electrodes towards salt ions accumulation.
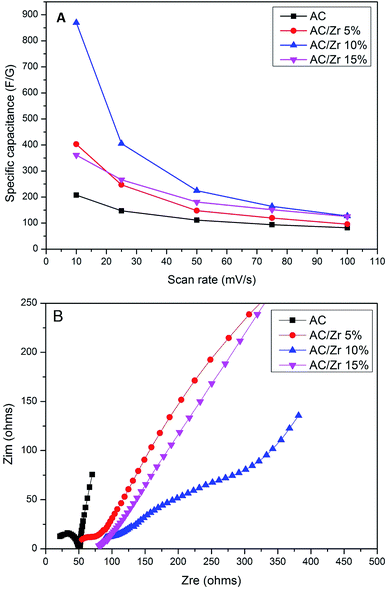 | ||
| Fig. 8 Specific capacitances for the prepared materials in a 1 M NaCl solution at different sweep rates (A) and Nyquist plot for the proposed electrode materials (B). | ||
Electrochemical impedance spectroscopy (EIS) is an essential method to characterize the electrical conductivity and capability for storing the electrical energy for the CDI electrodes. The Nyquist profiles of the proposed electrode materials are displayed in Fig. 8B. Obviously, the Nyquist plots exhibit a big difference in the resulting impedance spectra for the composite electrodes compared to those for the pristine AC; the curves of the AC/Zr composite electrodes demonstrates distinct semicircle traits in the high-to-medium-frequency regions besides a straight spike at the low frequency region. It is well-known that a Nyquist plot is divided into several regions: (1) a high-frequency intercept on the real Z (real) axis, (2) a semicircle in the high-to-medium frequency region corresponding to the charge transfer resistance (Rct), and (3) a straight line at the very low-frequency region.38 Comparing the CV results, the AC electrode only has a little improvement in the charge transfer and ionic diffusion compared to the other composite electrodes, whereas AC/Zr 10% electrode exhibit lowest semicircle, which indicates a lower ionic resistance at the electrode/electrolyte interface.
3.4. Desalination performance
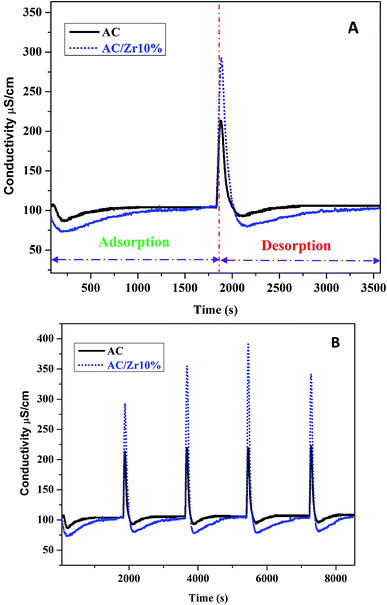
The deionization performance of the AC/Zr 10% electrode was evaluated by single pass mode CDI cell using a NaCl aqueous solution with an initial conductivity of ∼104 μS cm−1 and the flow rate of 30 mL min−1 under a direct voltage of 1.2 V. As abovementioned, the two electrodes separated by an insulating spacer were gathered in a sandwich structure and the resultant profiles are exhibited in Fig. 9A. Apparently, the detected conductivity rapidly decreases at an early stage of the external potential during the adsorption process, suggesting a quick removal of the salt ions on the oppositely charged electrodes. As the time progresses, the conductivity persistently attenuates, and then tends to stabilize due to the attainment of the adsorption equilibrium. In other words, based on the electrosorption points of view, the electrodes became saturated and an electrostatic repulsion between the adsorbed ions and solution ions occurred. Interestingly, during the adsorption stage, the corresponding conductivity for the AC/Zr 10% electrode is noticeably lower than that of the AC electrode. As shown, for the AC/Zr 10% electrode, the conductivity descended from 104 to 78 μS cm−1, whereas for the AC, it descended from 104 to 93 μS cm−1. Besides the lower conductivity, compared to that of the pristine electrode, the composite electrode required a relatively long time to be saturated, and the corresponding saturation time was 1010 and 1540 s for the AC and AC/Zr electrodes, respectively. Enhancing the saturation time leads to more adsorption of ions on the electrode surface. Note that the conventionally utilized equation (Q = (C0 − Cs) × v × t/M) for the estimation of the electrosorption capacitance39 is not adequate as it ignores the saturation time. However, the newly introduced equation (eqn (1)) considers all the important variables. Using this introduced equation, it was suggested that the corresponding electrosorption capacitance was 5.42 and 16.35 mg g−1 for the pristine and composite electrodes, respectively. This result reflects the priority of the composite electrode over the pristine AC and simultaneously emphasizes the distinct role of the zirconia nanofibers. The initial high increase at the beginning of the desorption process (Fig. 9A) indicates a quick repulsion for the accumulated ions on the electrodes surfaces. Due to the distinct difference in the electrosorption capacity, the initial salt concentration during the desorption step was also different, which indicates repulsion of different amounts of ions; moreover, the conductivity increased to 292 and 214 μS cm−1 for the composite and pristine electrodes, respectively. Besides the electrosorption capacity, salt removal efficiency is another important parameter for the quantitative evaluation of the CDI electrode. In the same manner, to consider the saturation time, the newly introduced equation (eqn (2)) was employed to estimate the salt removal efficiency. Numerically, the salt removal efficiency for the pristine and zirconia-based electrodes were 16.37% and 56.29%, respectively.Sequential adsorption–desorption cycles were conducted to additionally investigate the regeneration capacities of the proposed electrode. Note that an efficient regeneration characteristic is highly significant to examine the future long life efficiency of the CDI cell. The corresponding regeneration profiles for the AC/Zr 10% and AC electrodes are displayed in Fig. 9B. Apparently, the repeatability of the ion adsorption process could be achieved for both electrodes. During four adsorption/desorption processes, the curve shows good repeatability, which indicates a good regeneration behavior for both electrodes. Moreover, it can be claimed that the AC/Zr 10% electrode possesses high performance desalination capacity with an easy regeneration process. The easy regeneration characteristic of the fabricated electrode further confirms that the AC/Zr 10% electrode is a promising candidate for the CDI process. Overall, the enhanced CDI behavior for the introduced electrode can be assigned to the following reasons: incorporation of ZrO2 into AC increased the specific surface area and thus extra ion adsorption sites were provided; furthermore, the metal oxide nanofibers improved the wettability and hence enhanced the hydrophilicity of the nanocomposite electrode; and finally, the nanofibers reduced the electric polarization of the AC. Accordingly, based on all the abovementioned results, the ZrO2 nanofibers intercalated into the AC/Zr 10% electrode exhibits great performance throughout the CDI measurements compared to pristine AC. Table 1 summarizes the reported data on the electrosorption capacity of the AC and modified AC, proving that zirconia nanofiber doping is beneficial for improving the CDI performance.
| Electrode material | Applied voltage (V) | Initial NaCl concentration (mg L−1) | Electrosorption capacity (mg g−1) |
|---|---|---|---|
| CAs40 | 1.2 | ∼500 | 2.90 |
| AC41 | 1.2 | 500 | 9.72 |
| Activated carbon42 | 1.5 | 420 | 3.68 |
| ACF43 | 1.6 | 192 | 4.64 |
| AC/graphene44 | 1.2 | ∼2230 | 2.94 |
| TiO2 NPs/AC12 | 1.2 | 100 | 8.04 |
| AC/TiO2 spray45 | 1.2 | ∼584 | 17 |
| AC-QPVP46 | 1.2 | 500 | 20.6 |
ACF-HNO3![[thin space (1/6-em)]](https://www.rsc.org/images/entities/char_2009.gif) 47 47 |
1.2 | 500 | 12.8 |
| ZnO/ACC48 | 1.6 | 1000 | 7.7 |
| AC/Zr 10% (this work) | 1.2 | ∼104 | 16.35 |
4. Conclusion
In summary, highly crystalline zirconia nanofibers with good morphology were synthesized by the calcination of electrospun nanofiber mats composed of zirconium isopropoxide and poly(vinyl acetate). Physical blending of the prepared inorganic nanofibers with activated carbon strongly enhanced the wettability and specific capacitance of the nanofibers. Accordingly, the new composite can be effectively utilized as an electrode material in the capacitive deionization units. However, the inorganic nanofiber content should be optimized to achieve the best performance; a content of 10 wt% with respect to the matrix materials showed the best desalination results. The incorporation of ZrO2 into AC was demonstrated to be a suitable and desirable material for considerable performance desalination applications. Considering the availability, low-cost, and biological and photocatalytic properties of zirconia, the proposed composite can be strongly recommended as an effective electrode material for the capacitive deionization desalination process.Acknowledgements
This Research was financially supported by the National Research Foundation of Korea (NRF) Grant funded by the Korean Government (MOE) (No. 2014R1A1A2058967).References
- Z. Y. Yang, L. J. Jin, G. Q. Lu, Q. Q. Xiao, Y. X. Zhang, L. Jing, X. X. Zhang, Y. M. Yan and K. N. Sun, Adv. Funct. Mater., 2014, 24, 3917–3925 CrossRef CAS.
- H. Li, L. Zou, L. Pan and Z. Sun, Environ. Sci. Technol., 2010, 44, 8692–8697 CrossRef CAS PubMed.
- T. Humplik, J. Lee, S. O'hern, B. Fellman, M. Baig, S. Hassan, M. Atieh, F. Rahman, T. Laoui and R. Karnik, Nanotechnology, 2011, 22, 292001 CrossRef CAS PubMed.
- F. A. AlMarzooqi, A. A. Al Ghaferi, I. Saadat and N. Hilal, Desalination, 2014, 342, 3–15 CrossRef CAS.
- C. Huyskens, J. Helsen and A. de Haan, Desalination, 2013, 328, 8–16 CrossRef CAS.
- Y. Jande and W. Kim, Sep. Purif. Technol., 2013, 115, 224–230 CrossRef CAS.
- J. Biener, M. Stadermann, M. Suss, M. A. Worsley, M. M. Biener, K. A. Rose and T. F. Baumann, Environ. Sci. Technol., 2011, 4, 656–667 CAS.
- S. Kondrat, C. Perez, V. Presser, Y. Gogotsi and A. Kornyshev, Environ. Sci. Technol., 2012, 5, 6474–6479 CAS.
- Z. Peng, D. Zhang, L. Shi, T. Yan, S. Yuan, H. Li, R. Gao and J. Fang, J. Phys. Chem. C, 2011, 115, 17068–17076 CAS.
- H. Yin, S. Zhao, J. Wan, H. Tang, L. Chang, L. He, H. Zhao, Y. Gao and Z. Tang, Adv. Mater., 2013, 25, 6270–6276 CrossRef CAS PubMed.
- J.-H. Lee, W.-S. Bae and J.-H. Choi, Desalination, 2010, 258, 159–163 CrossRef CAS.
- P.-I. Liu, L.-C. Chung, H. Shao, T.-M. Liang, R.-Y. Horng, C.-C. M. Ma and M.-C. Chang, Electrochim. Acta, 2013, 96, 173–179 CrossRef CAS.
- C. Yan, L. Zou and R. Short, Desalination, 2014, 333, 101–106 CrossRef CAS.
- Y. Liu, C. Nie, L. Pan, X. Xu, Z. Sun and D. H. Chua, Inorg. Chem. Front., 2014, 1, 249–255 RSC.
- T.-Y. Ying, K.-L. Yang, S. Yiacoumi and C. Tsouris, J. Colloid Interface Sci., 2002, 250, 18–27 CrossRef CAS PubMed.
- H. Li, L. Pan, T. Lu, Y. Zhan, C. Nie and Z. Sun, J. Electroanal. Chem., 2011, 653, 40–44 CrossRef CAS.
- Y. Zhan, L. Pan, C. Nie, H. Li and Z. Sun, J. Alloys Compd., 2011, 509, 5667–5671 CrossRef CAS.
- G. Wang, Q. Dong, Z. Ling, C. Pan, C. Yu and J. Qiu, J. Mater. Chem., 2012, 22, 21819–21823 RSC.
- X. Wen, D. Zhang, T. Yan, J. Zhang and L. Shi, J. Mater. Chem. A, 2013, 1, 12334–12344 CAS.
- K. Kinoshita, Carbon: electrochemical and physicochemical properties, 1988 Search PubMed.
- K. Foo and B. Hameed, J. Hazard. Mater., 2009, 170, 552–559 CrossRef CAS PubMed.
- Z.-S. Wu, G. Zhou, L.-C. Yin, W. Ren, F. Li and H.-M. Cheng, Nano Energy, 2012, 1, 107–131 CrossRef CAS.
- L. M. Chang, X. Y. Duan and W. Liu, Desalination, 2011, 270, 285–290 CrossRef CAS.
- C.-C. Ou, C.-S. Yang and S.-H. Lin, Catal. Sci. Technol., 2011, 1, 295–307 CAS.
- N. A. Barakat, M. A. Kanjwal, I. S. Chronakis and H. Y. Kim, J. Mol. Catal. A: Chem., 2013, 366, 333–340 CrossRef CAS.
- Y.-J. Kim and J.-H. Choi, Water Res., 2010, 44, 990–996 CrossRef CAS PubMed.
- X. Ning, W. Zhong, S. Li, Y. Wang and W. Yang, J. Mater. Chem. A, 2014, 2, 8859–8867 CAS.
- N. A. Barakat, M. Abadir, F. A. Sheikh, M. A. Kanjwal, S. J. Park and H. Y. Kim, Chem. Eng. J., 2010, 156, 487–495 CrossRef CAS.
- N. A. Barakat, M. S. Khil, F. A. Sheikh and H. Y. Kim, J. Phys. Chem. C, 2008, 112, 12225–12233 CAS.
- N. A. Barakat, B. Kim and H. Y. Kim, J. Phys. Chem. C, 2008, 113, 531–536 Search PubMed.
- N. A. Barakat, K. A. Khalil, I. H. Mahmoud, M. A. Kanjwal, F. A. Sheikh and H. Y. Kim, J. Phys. Chem. C, 2010, 114, 15589–15593 CAS.
- L. Li, L. Zou, H. Song and G. Morris, Carbon, 2009, 47, 775–781 CrossRef CAS.
- C.-T. Hsieh and H. Teng, Carbon, 2002, 40, 667–674 CrossRef CAS.
- H. Li, S. Liang, J. Li and L. He, J. Mater. Chem. A, 2013, 1, 6335–6341 CAS.
- L. Zou, L. Li, H. Song and G. Morris, Water Res., 2008, 42, 2340–2348 CrossRef CAS PubMed.
- S. Prabaharan, R. Vimala and Z. Zainal, J. Power Sources, 2006, 161, 730–736 CrossRef CAS.
- H.-Y. Liu, K.-P. Wang and H. Teng, Carbon, 2005, 43, 559–566 CrossRef CAS.
- D. Zhang, X. Wen, L. Shi, T. Yan and J. Zhang, Nanoscale, 2012, 4, 5440–5446 RSC.
- A. G. El-Deen, J.-H. Choi, C. S. Kim, K. A. Khalil, A. A. Almajid and N. A. Barakat, Desalination, 2015, 361, 53–64 CrossRef CAS.
- J. C. Farmer, D. V. Fix, G. V. Mack, R. W. Pekala and J. F. Poco, J. Electrochem. Soc., 1996, 143, 159–169 CrossRef CAS.
- Z. Chen, C. Song, X. Sun, H. Guo and G. Zhu, Desalination, 2011, 267, 239–243 CrossRef CAS.
- Y.-J. Kim and J.-H. Choi, Sep. Purif. Technol., 2010, 71, 70–75 CrossRef CAS.
- G. Wang, C. Pan, L. Wang, Q. Dong, C. Yu, Z. Zhao and J. Qiu, Electrochim. Acta, 2012, 69, 65–70 CrossRef CAS.
- H. Li, L. Pan, C. Nie, Y. Liu and Z. Sun, J. Mater. Chem., 2012, 22, 15556–15561 RSC.
- C. Kim, J. Lee, S. Kim and J. Yoon, Desalination, 2014, 342, 70–74 CrossRef CAS.
- T. Wu, G. Wang, F. Zhan, Q. Dong, Q. Ren, J. Wang and J. Qiu, Water Res., 2016, 93, 30–37 CrossRef CAS PubMed.
- T. Wu, G. Wang, Q. Dong, B. Qian, Y. Meng and J. Qiu, Electrochim. Acta, 2015, 176, 426–433 CrossRef CAS.
- K. Laxman, M. T. Z. Myint, R. Khan, T. Pervez and J. Dutta, Desalination, 2015, 359, 64–70 CrossRef CAS.
| This journal is © The Royal Society of Chemistry 2017 |

