
 Open Access Article
 This Open Access Article is licensed under a
 Creative Commons Attribution 3.0 Unported Licence
Microwave-assisted synthesis of chitosan biguanidine hydrochloride and its regulation on InsR and GLUT2 in insulin resistant HepG2 cells
Shengsheng Zhangabc,
Hai Zhangabc,
Li Wangabc,
Xiaofei Liu *abc and
Yuntang Wud
*abc and
Yuntang Wud
aDepartment of Polymer Materials Science and Engineering, College of Materials Science and Engineering, Tianjin University, 92 Weijin Road, Nankai District, Tianjin, 300072, P. R. China. E-mail: liuxf315@aliyun.com; Fax: +86 022 2740 4727; Tel: +86 022 2740 8099
bResearch Institute of Advanced Polymer, Tianjin University, Tianjin, 300072, P. R. China
cTianjin Key Laboratory of Composite and Functional Materials, Tianjin University, Tianjin, 300072, P. R. China
dDepartment of Nutrition and Food Science, School of Public Health, Tianjin Medical University, Tianjin, 300070, P. R. China
First published on 6th February 2017
Abstract
Insulin receptor (InsR) and GLUTs play a very important role in pathophysiological changes in terms of diabetes and insulin resistance, and metformin can regulate their expression and activity in order to alleviate insulin resistance. By reference to the molecular structure of metformin, chitosan biguanidine hydrochloride (CSGH) was synthesized by reacting chitosan (CS) with dicyandiamide under microwave irradiation and characterized by FT-IR, 13C NMR spectroscopy and XRD. The substitution degree (DS) of CSGH, measured by potentiometric titration method, varied in the range of 41.8% to 68.5%. After cytotoxicity testing of CSGH, nontoxic samples were selected. Then insulin resistance (IR) model using human hepatocarcinoma HepG2 cells was established, and the effect of CSGH on glucose consumption was investigated. Moreover, the expression of InsR and the signal protein glucose transporters-2 (GLUT2) were further investigated to study the mechanism. Results showed that CSGH samples with DS 43.2% and DS 52.7% were nontoxic and could improve the vitality, markedly promoting the glucose consumption of HepG2 cells. Besides, the effect of CSGH (DS 52.7%) on promoting glucose consumption was better than metformin and not dose-dependent. It is also found that CSGH could induce the expression of InsR protein and significantly inhibit the over-expression of GLUT2 transport protein, which was probably the mechanism of the therapeutic effect of CSGH on IR HepG2 cells.
1. Introduction
Diabetes mellitus is a metabolic disorder characterized by chronic hyperglycemia with disturbances in the metabolism of carbohydrates, lipids and proteins,1–3 and 90–95% is accounted for as non-insulin-dependent diabetes mellitus (Type 2 diabetes mellitus, T2DM).4 The main characteristic of T2DM is insulin resistance (IR), which is defined by reduced expression and/or sensitivity of insulin receptors to insulin.5 The liver is one of the most important organs involved in insulin resistance, because of its central role in lipid metabolism and glucose homeostasis.6,7 Characteristic manifestations of hepatic insulin resistance are suppression of glucose uptake and decrease of insulin sensitivity,8,9 which are associated with the abnormal expression and activity of multiple signaling factors, such as insulin receptor (InsR), insulin receptor substrate (IRS), phosphatidylinositol 3-kinase (PI3K), protein kinase B (Akt), GLUTs (glucose transporter proteins), and so on.9–13In the liver, reduction of insulin receptor (InsR) is a typical performance of IR. The InsR is a heterotetrameric membrane glycoprotein that is activated by insulin,14 and the insulin-bound InsR further promotes the binding and activation of downstream proteins, which plays an important role in stimulating glucose uptake.15 There is evidence suggesting that the down-regulation of InsR is related to the aggravation of insulin resistance and T2DM.16–19 Additionally, some hormones and nutrients can regulate expression of InsR. For example low concentration glucose induced InsR mRNA expression20,21 and high-insulin treatment made the InsR on the surface of HepG2 cells decreased and flawed.22
Except for reduction of InsR, over-expression of GLUT2 is also an important sign of hepatic insulin resistance.23 GLUT2, one of the thirteen glucose transporter proteins (GLUTs) identified in human, is expressed at high levels in the liver, small intestine, kidney, and pancreatic cells.24 It is glucose sensitive, and plays a role in mediating both glucose influx and efflux in hepatocytes by altering the rate of glucose uptake.25 Over-expression of hepatic GLUT2 was found in streptozocin-induced diabetes animals26–28 and in oleic acid treated HepG2 cell line.29 The excess GLUT2 in liver cells made glucose transport activity enhanced, thus promoting hepatic glucose out of the cells and into the bloodstream. Consequently, elevated blood glucose exacerbated insulin resistance.30
Metformin is widely used in the current treatment regimen for T2DM,31 which can decrease endogenous glucose production in liver and can regulate the expression and activity of InsR and GLUTs in hepatocytes.32,33 However, this treatment is accompanied by common adverse side effects and limitations, such as acute infections of the nose and throat, diarrhea, swelling of the abdomen, and in individuals with kidney disease.34–36 Therefore, a new drug with higher biological activity is urgently needed.
Chitosan (CS), a copolymer of glucosamine and N-acetylglucosamine units linked by 1–4 glucosidic bonds,37 was reported to ameliorate insulin resistance by improving the carbohydrate metabolism and lipid metabolism in diabetic rats.38–41 Hsieh et al.40 indicated that long-term administration of chitosan may reduce insulin resistance through suppression of lipid accumulation in liver and adipose tissues in diabetic rats. Our previous research41 found that chitosan not only lowered the level of plasma leptin, glucose, insulin and total cholesterol in vivo, but regulated mRNA expression of leptin and resistin, adiponectin and PPAR-γ in vitro, to achieve insulin resistance therapy. Moreover, CS and its complexes can enhance antioxidant capacity of tissues and cells, protect the pancreas, and was likely to have a role on GLUTs management.42–44 Chitosan is the only natural polysaccharides containing amino, and the existence of living amino makes it prone to guanidination reaction. Hu et al.45 found that chitosan/guanidine polymers exhibited excellent antimicrobial properties. Sang et al.46 synthesized quaternized carboxymethyl chitosan containing guanidine groups, which demonstrated strong antimicrobial activity. Our previous studies found that biguanidine hydrochloride displayed excellent antioxidant ability,47 and chitooligosaccharide guanidine was likely to promote transmembrane of GLUT4 by improving the phosphorylation level of Akt, thereby increasing glucose uptake of skeletal cells.48 However, up to now, there are few reports about the effect of chitosan guanidine derivatives on insulin resistance hepatic cells.
In this study, chitosan biguanidine hydrochloride (CSGH) was prepared via the introduction of biguanide onto chitosan under microwave irradiation. And the products were expected to promote the uptake and utilization of cell glucose by means of modulating the expression of InsR and GLUTs. The experiment investigated the effects of CSGH and metformin on glucose consumption, insulin receptor (InsR) and glucose transporters-2 (GLUT2) in high-insulin-induced insulin resistance HepG2 cells and then led to a proposed mechanism of therapeutic effects on insulin resistance with CSGH.
2. Experimental
2.1. Chemicals and materials
Chitosan (CS), with a weight-average molecular weight (Mw) of 50 kDa and a deacetylation degree (DD) of 0.85, was provided by Qingdao Medicine Institute, Shandong, China. Dicyandiamide, was purchased from Aladdin Chemical Co. Concentrated hydrochloric acid, 37% (wt%) and ethanol were obtained from Jiang Tian Chemical Technology Co., Tianjin, China. Metformin was supplied by Squibb Pharmaceuticals Co., Shanghai, China. HepG2 cell line was purchased from Academy of Sciences Cell Bank, Shanghai, China. Fetal bovine serum, Dulbecco's Modified Eagle's Medium (DMEM) culture and trypsin were obtained from Gibco, Grand Island, NY. Methyl thiazolyl tetrazolium (MTT) and dimethyl sulphoxide (DMSO) were procured from Sigma, USA., San Francisco. Cell lysis buffer was supplied by Cell Signaling Technology, Inc., USA, Danvers. BCA protein assay kit were obtained from Boster biotechnology Co., Wuhan, China. Coomassie protein kit, GLUT2 monoclonal antibody of rat, glucose assay kit, insulin receptor β subunit monoclonal antibody, horseradish peroxidase-labeled goat anti-rabbit IgG, standard protein marker, GADPH internal reference, bovine serum albumin (BSA) were purchased from Jiancheng Institute of Biotechnology, Nanjing, China. All other reagents were of analytical grade provided by No. 3 Chemical Reagent Factory, Tianjin, China.2.2. Preparation of CSGH
The preparation was conducted according to our previous report with slight modifications.48 The synthetic process of CSGH was prepared as follows (Fig. 1a). Briefly, 2 g CS and 60 mL HCl aqueous solution (0.2 mol L−1) were taken together in a 250 mL four-neck flask equipped with a mechanical stirrer. The flask was placed in a microwave reactor, and the reaction was run with stirring for 10 min at 50 °C. The microwave power was set to 400 W while working. Then, different grams of dicyandiamide was added into the above solution and the pH of system was adjusted to 1, 2, 3 and 4 with HCl, respectively. After that, the prepared sample was placed in the microwave reactor at different temperature for 5–20 min. After it was cooled to room temperature, the mixture was concentrated by reduced-pressure distillation. The product was obtained by dialysis for three days in a dialysis bag with molecular weight cut-off of 10![[thin space (1/6-em)]](https://www.rsc.org/images/entities/char_2009.gif) 000 followed by lyophilization.
000 followed by lyophilization.
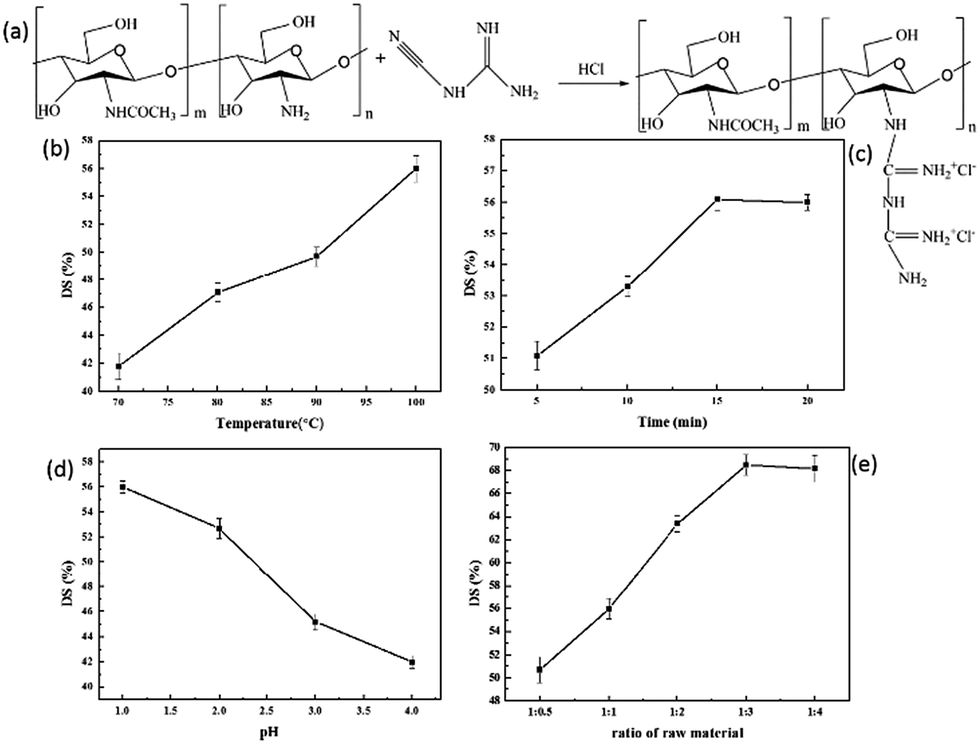 | ||
| Fig. 1 Synthesis and effect of experimental conditions on DS of CSGH. | ||
To study different factors that affect DS of CSGH, we analyzed and discussed the temperature (70 °C, 80 °C, 90 °C, 100 °C), reaction time (5, 10, 15, 20 min), reaction pH (1, 2, 3, 4) and ratio of raw materials (the amount of amino group in CS: the amount of dicyandiamide = 1:0.5, 1:1, 1:2, 1:3, 1:4) of CS, the experimental conditions were shown in Table 1.
| T/°C | t/min | pH | Ratio |
|---|---|---|---|
| 70 | 15 | 1 | 1:1 |
| 80 | 15 | 1 | 1:1 |
| 90 | 15 | 1 | 1:1 |
| 100 | 15 | 1 | 1:1 |
| 100 | 5 | 1 | 1:1 |
| 100 | 10 | 1 | 1:1 |
| 100 | 15 | 1 | 1:1 |
| 100 | 20 | 1 | 1:1 |
| 100 | 15 | 1 | 1:1 |
| 100 | 15 | 2 | 1:1 |
| 100 | 15 | 3 | 1:1 |
| 100 | 15 | 4 | 1:1 |
| 100 | 15 | 1 | 1:0.5 |
| 100 | 15 | 1 | 1:1 |
| 100 | 15 | 1 | 1:2 |
| 100 | 15 | 1 | 1:3 |
| 100 | 15 | 1 | 1:4 |
2.3. Characterization
The structure and composition of chitosan and CSGH were characterized by FT-IR with a Bio-Rad FTS 6000 spectrometer. After being dried completely at 50 °C, the samples could be used for FT-IR analysis with the standard KBr pellet method. The 1H and 13C NMR spectra of chitosan and CSGH were recorded on a Bruker Avance 400 NMR spectrometer. In order to compare the characteristic signals of the biguanide in CSGH with those in metformin, the 13C NMR spectra of metformin was also conducted. Chitosan and CSGH were dissolved in DCl/D2O, and metformin was dissolved in D2O. Wide angle X-ray diffraction analysis was carried out on CS and CSGH powder. Test conditions: test angle 5–40 degree, copper target, step 0.02, tube pressure 40 kV, pipe flow 100 mA. The potentiometric titration was employed to investigate the DS of CSGH according to our previous report.482.4. Cell culture and treatments
Human hepatocarcinoma HepG2 cells were cultured in high glucose DMEM containing 15% fetal bovine serum (FBS). Besides, HepG2 cells were divided into normal control group and sample groups. Sample groups were further supplemented with 100 μL of the intervening solution, according to which ten groups were set up: CSGH1-L, CSGH1-M, CSGH1-H (representing CSGH, DS of which was 43.2%, at 50, 250, 500 μg mL−1 in DMEM solution, respectively), CSGH2-L, CSGH2-M, CSGH2-H (representing CSGH, DS of which was 52.7%, at 50, 250, 500 μg mL−1 in DMEM solution, respectively), CSGH3-L, CSGH3-M, CSGH3-H (representing CSGH, DS of which was 68.5%, at 50, 250, 500 μg mL−1 in DMEM solution, respectively) and metformin (representing metformin at 50 μg mL−1 in DMEM solution). Instead of the intervening solution, control group was treated with 100 μL of DMEM solution. The interference was conducted at 37 °C for 24 h in a humidified atmosphere of 5% CO2. For each group at least six wells were used.2.5. Evaluation of cytotoxicity and selection of nontoxic samples
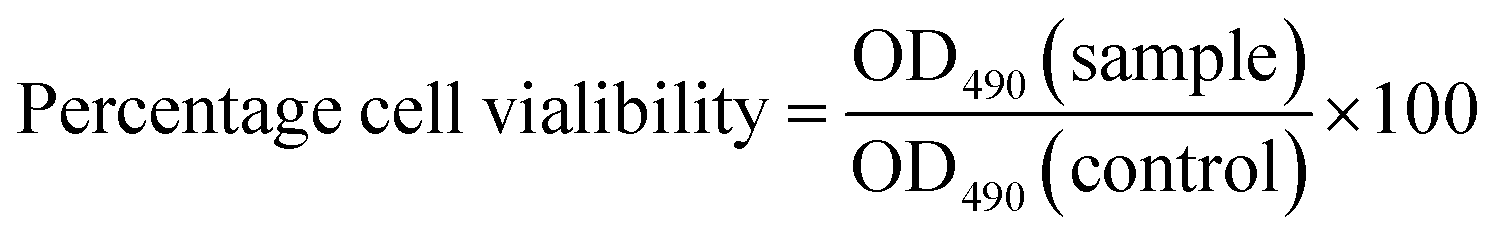
The MTT assay is a standard colorimetric method used to determine the effects of potential agents or compounds on the proliferation of cells.49 In the present study, we employed this method to assess the cytotoxicity and cell growth of HepG2 cells treated with CSGH. Percentage cell viability, reflecting the relative number and relative viability of cells, was calculated according to eqn (1), where OD490(sample) reflects a measurement from a well treated with CSGH and OD490(control) represents a well without any sample treatment.After cytotoxicity test, we selected the nontoxic samples for further experiments.
 | (1) |
2.6. Determination of glucose consumption
After incubation, the cell culture supernatant was drawn to detect the dose of glucose levels, following the instructions of kit. The blank group was set as control and the glucose concentration of the wells with cells was subtracted from the glucose of the blank wells to obtain the amount of glucose consumption,48 that is: glucose consumption in each dose group per well = glucose levels of control group-glucose levels of each experimental group. At the same time, five holes were set as a parallel group.The glucose consumption per well can be measured by the above method. Considering that the cell viability value measured by MTT method can reflect the relative number of cells in each well, a novel calculation method [eqn (2)] was designed to calculate the glucose consumption of each individual cell.
 | (2) |
2.7. Establishment of insulin resistance model
HepG2 cells in the logarithmic growth phase were cultured and high-glucose DMEM was added to each well. Besides, the cells were divided into normal control group and insulin intervention group. Insulin intervention group was interposed with high-glucose DMEM culture solution containing different concentration insulin (10 nM, 100 nM and 1000 nM, respectively) for different time (12 h, 24 h, 36 h, 48 h, and 60 h, respectively) while normal control group was dealt with the same method except for the insulin. Afterwards, we utilized these conditions in which cells exhibited the lowest level of glucose uptake to develop the cell model of insulin resistance (IR). The experimental scheme of insulin resistance model was shown in Table 2.| Insulin concentration (nM) | Time/h | ||||
|---|---|---|---|---|---|
| 10 | 12 | 24 | 36 | 48 | 60 |
| 100 | 12 | 24 | 36 | 48 | 60 |
| 1000 | 12 | 24 | 36 | 48 | 60 |
In addition, to detect the effect of CSGH on IR HepG2 cells, samples were classified into control group, insulin resistance (IR) group, metformin group (metformin at 50 μg mL−1 in DMEM solution) and CSGH groups (nontoxic CSGH samples at 50, 250, 500 μg mL−1 in DMEM solution, respectively). Ultimately, samples and insulin were dissolved in high glucose DMEM culture with 15% fetal bovine for 24 h.
2.8. Western blot and immunofluorescence analysis
Cells were washed with PBS three times and collected with cell lysis buffer according to the manufacturer's protocol. Protein concentrations were determined according to BCA assay kit instructions. Then protein was separated using SDS-PAGE and transferred onto nitrocellulose membranes. Afterwards, the nitrocellulose membranes were blocked in blocking buffer for 2 h at 37 °C, followed by incubation with the primary antibodies overnight at 4 °C. The blots were subsequently rinsed with TBST three times and incubated with secondary antibodies for 2 h at room temperature. The resultant signals were detected through chemiluminescence using ECL Hyperfilm. The ratio of target proteins to GADPH was used to reflect the relative levels of the targeted proteins.2.9. Statistical analysis
Values were presented as mean ± SD. Data were analyzed statistically by one-way analysis of variance (ANOVA) followed by LSD test. Probability values were considered significant when p < 0.05.3. Results and discussion
3.1. Effects of different conditions on the DS of CSGH
As we can see in Fig. 1b, with the increase of reaction temperature, the DS value of CSGH increased gradually. When the temperature is low, the activation energy was not enough for CS and dicyandiamide to react adequately. Therefore, the DS value of CSGH increased with the rising of temperature. As the reaction time extended, the DS value of CSGH increased initially and then became constant (Fig. 1c). Probably because after reaction for 15 min, the reaction was almost complete, then increasing the reaction time would not contribute to promoting the DS value of products. Moreover, when heated for too long, CS and CSGH would be degraded under high temperature and acidic conditions.50Fig. 1d showed that with pH increasing, the DS value of CSGH decreased. The reason may be that –NH2 was protonated easily in acidic environment, which was beneficial for the reaction of chitosan and dicyandiamide. And the increment of dicyandiamide improved the DS value of CSGH gradually, but when the ratio of raw materials was more than 1:3, the DS value of the products reached the limit (Fig. 1e).
After series of experiments discussed above, we obtained CSGH products with DS value ranging from 41.8% to 68.5%. In order to study the effect of CSGH with different DS value on hepatocytes, samples with low DS (41.8%), medium DS (52.7%) and high DS (68.5%) were selected for the following experiments.
3.2. Characterization of chitosan and CSGH
As shown in the FT-IR spectra of CSGH (Fig. 2), two new peaks at 1640 cm−1 and 1320 cm−1 were assigned to the stretching vibration of C![[double bond, length as m-dash]](https://www.rsc.org/images/entities/char_e001.gif) NH and the stretching vibration of C–N in guanidine group [–HNC(NH)NH2]. It was observed in CSGH that there was stronger characteristic absorption at 1543 cm−1 and 1072 cm−1 due to the –NH– group, indicating that the guanidine reaction occurred on chitosan group. Moreover, the peak at 3417 cm−1 is wider, which reflected the increment of the amount of –N–H. It can be deduced that CSGH had been successfully synthesized.
NH and the stretching vibration of C–N in guanidine group [–HNC(NH)NH2]. It was observed in CSGH that there was stronger characteristic absorption at 1543 cm−1 and 1072 cm−1 due to the –NH– group, indicating that the guanidine reaction occurred on chitosan group. Moreover, the peak at 3417 cm−1 is wider, which reflected the increment of the amount of –N–H. It can be deduced that CSGH had been successfully synthesized.
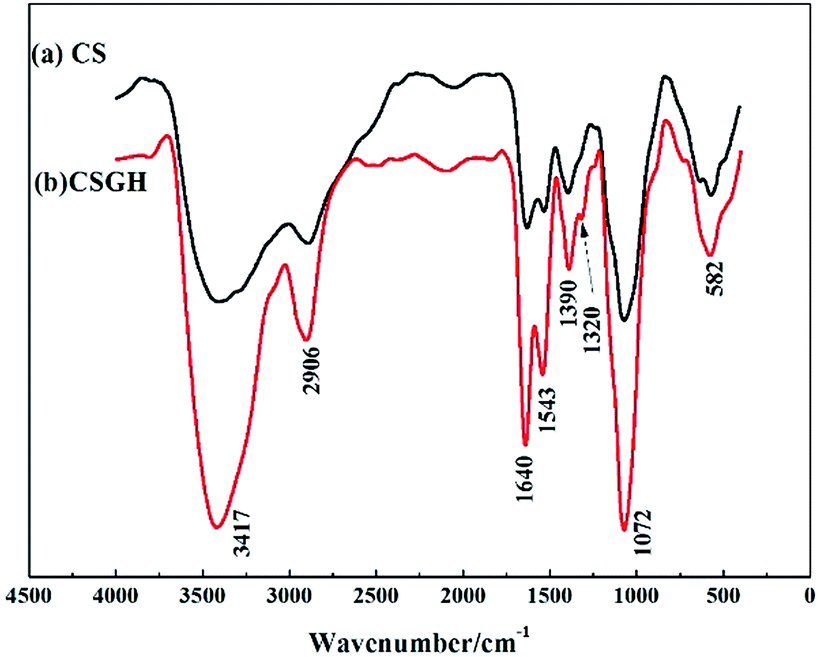 | ||
| Fig. 2 FT-IR spectra of (a) CS and (b) CSGH. | ||
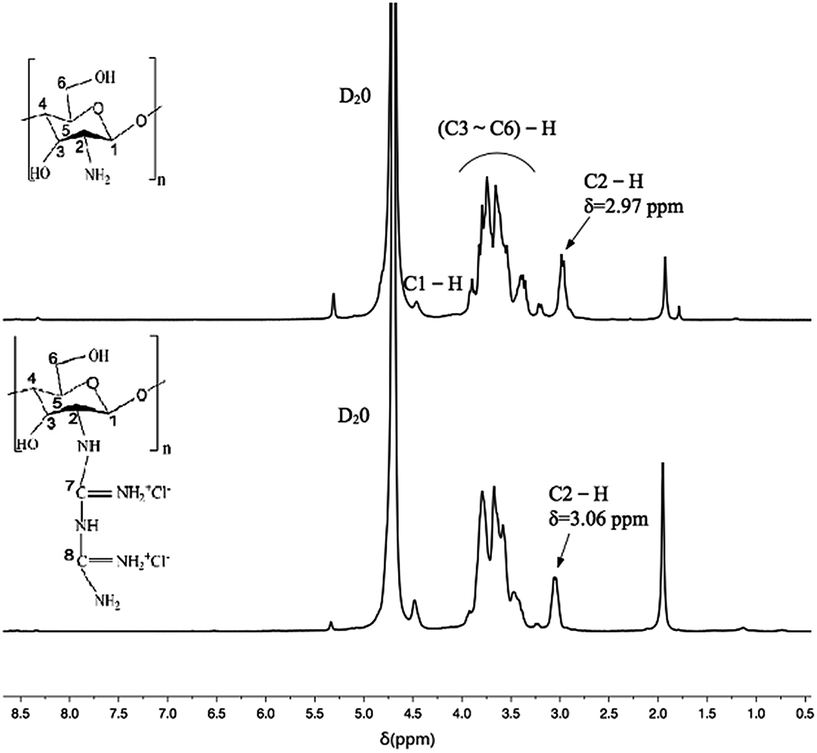
Further evidence supporting a successful guanidinylation of chitosan is provided by the 13C NMR (Fig. 3a) and 1H NMR51 (Fig. 4). Comparing the spectrogram of chitosan with that of CSGH, the distinct signals at 157.9 (C8) and 165.4 (C7) ppm were assigned to the carbons of biguanidine groups, which roughly corresponded to the signals (158.48 (C1) and 160.21 (C2) ppm) representing carbons of biguanidine groups in metformin (Fig. 3a). There is a little gap between the chemical shifts of C7, C8 in CSGH and chemical shifts of C1, C2 in metformin, which was most likely due to the electronegativity of the chitosan structural unit in CSGH was different from the methyl in metformin.52 The signals at 56.6 (C2), 62.4 (C6), 72.8 (C3), 77.4 (C5) and 79.1 (C4) and 100.2 (C1) (ppm) were attributed to the polysaccharide structures, and the signal at 22.45 ppm was the characteristic peak of methyl group (CH3). After amplification of the 13C NMR spectrum of chitosan and CSGH (Fig. 3b), the characteristic peaks of the carbonyl group (CO) in the acetyl group were found near 174.9 ppm.53 The 13C NMR spectra confirmed that the amino groups of chitosan were partly guanidinylated.
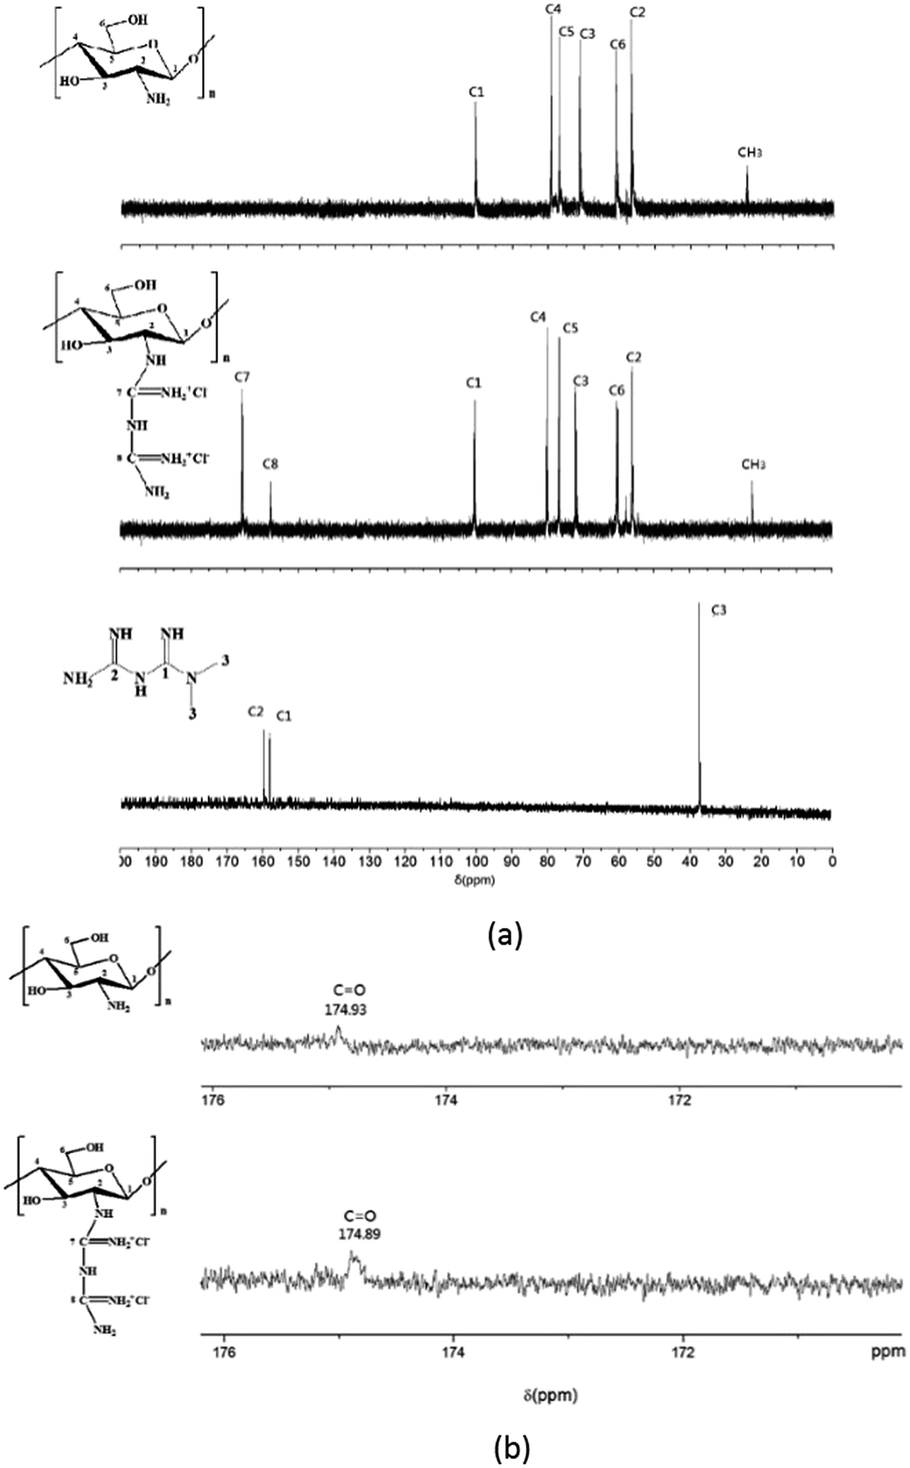 | ||
| Fig. 3 13C NMR spectra of CS, CSGH and metformin. (a) 13C NMR spectra of CS (top), CSGH (middle) and metformin (bottom) (b) partial magnified view of the 13C NMR spectrum of CS (top) and CSGH (bottom). | ||
 | ||
| Fig. 4 1H NMR spectra of CS (top), CSGH (bottom). | ||
As shown in Fig. 4, the peak at δ = 4.7 ppm is the solvent peak. It was observed that the typical peaks at 3.1–3.9 ppm were assigned to the glucosamine unit (H3, H4, H5, and H6) of chitosan, that at 2.97 ppm corresponds to H2 and that at 4.5 ppm is related to the methyl protons of the N-acetyl group.54 In the spectrum of CSGH, the typical peak of H2 is at 3.06 ppm and the peak shape becomes lower, which demonstrates the existence of biguanide groups in CSGH. The results were in consistent with our previous research.48
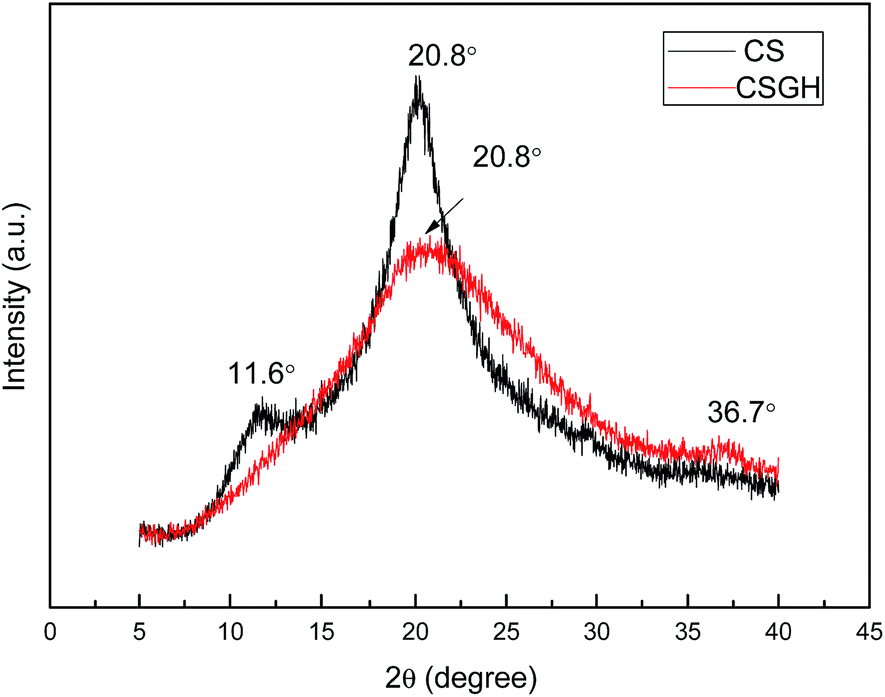
Guanidylation reaction of chitosan was also supported by XRD (Fig. 5). The diffraction peak at 11.6° in the XRD patterns of the CSGH disappeared but the peak at 20.8° was much broader with a much lower peak intensity. This is because plenty of hydroxyl and amino groups exist in the chitosan structure, which can form stronger intermolecular and intramolecular hydrogen bonds, and the structure of chitosan molecules has certain regularity, so that chitosan molecules form crystalline regions easily,55 but the introduction of biguanide groups destructed the intermolecular hydrogen bonds and the crystalline regions of chitosan. Furthermore, the characteristic peak at 36.7° clarified the existence of biguanide, which suggested the successful fabrication of CSGH.48
 | ||
| Fig. 5 XRD patterns of CS and CSGH. | ||
3.3. Cytotoxicity analysis and selection of nontoxic samples
As indicated in Table 3, CSGH1, CSGH2, and metformin were all demonstrated to be nontoxic to the normal HepG2 cells because no significant inhibition but slightly promotion was observed when compared to control. However, CSGH3 inhibited HepG2 cell viability in a dose-dependent manner, suggesting that CSGH with excessive biguanidine groups had high cytotoxicity on HepG2 cells. The cytotoxicity of CSGH3 may be related to the biguanide toxicity as reported in previous studies,56,57 but the specific mechanism is unclear. Consequently, CSGH1 and CSGH2 were selected to perform subsequent experiments on insulin resistance HepG2 cells.| Group | Dose (μg mL−1) | N | OD |
|---|---|---|---|
| a p < 0.05 vs. control group. | |||
| Control | — | 6 | 0.516 ± 0.013 |
| Metformin | 50 | 6 | 0.512 ± 0.015 |
| CSGH1-L | 50 | 6 | 0.526 ± 0.018 |
| CSGH1-M | 250 | 6 | 0.533 ± 0.023 |
| CSGH1-H | 500 | 6 | 0.545 ± 0.016 |
| CSGH2-L | 50 | 6 | 0.538 ± 0.026 |
| CSGH2-M | 250 | 6 | 0.546 ± 0.033 |
| CSGH2-H | 500 | 6 | 0.541 ± 0.027 |
| CSGH3-L | 50 | 6 | 0.492 ± 0.020 |
| CSGH3-M | 250 | 6 | 0.479 ± 0.012a |
| CSGH3-H | 500 | 6 | 0.403 ± 0.011a |
3.4. Establishment of insulin resistance model
As shown in Fig. 6, cells exhibited the lowest level of glucose consumption upon treatment with 100 nM insulin for 24 h. Therefore, we utilized these conditions to develop the cell model of IR. Then the effect of CSGH1 and CSGH2 on high-insulin-induced IR HepG2 cells was investigated.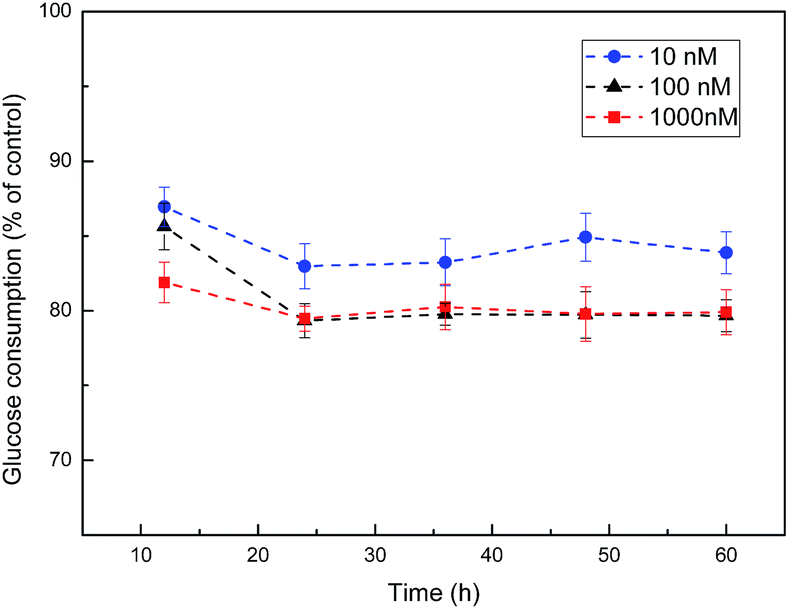 | ||
| Fig. 6 Dose- and time-dependent effects of insulin on glucose consumption. | ||
3.5. Impact of CSGH on the viability of insulin resistance HepG2 cells
As we can see in Table 4, cell viability with 100 nM insulin treatment alone decreased compared with the control (p < 0.05). The viability increased in a small degree when metformin was dropped into the system, whereas CSGH1 and CSGH2 with different concentrations can all significantly improve the viability. From the perspective of cell viability, CSGH2 possessed better activity than CSGH1. Markedly, the OD value of the cells in medium group of CSGH2 were 0.561 ± 0.020, 9.4% (p < 0.05) higher than that of the control. In summary, CSGH1 and CSGH2 can both be used to improve vitality of IR HepG2 cells, while metformin can't achieve the same effect.| Group | Dose (μg mL−1) | N | OD |
|---|---|---|---|
| a p < 0.05 vs. control group.b p < 0.05 vs. IR group. | |||
| Control | — | 6 | 0.513 ± 0.032 |
| IR | — | 6 | 0.446 ± 0.026a |
| Metformin | 50 | 6 | 0.472 ± 0.023 |
| CSGH1-L | 50 | 6 | 0.501 ± 0.026 |
| CSGH1-M | 250 | 6 | 0.515 ± 0.017b |
| CSGH1-H | 500 | 6 | 0.522 ± 0.034b |
| CSGH2-L | 50 | 6 | 0.536 ± 0.024b |
| CSGH2-M | 250 | 6 | 0.561 ± 0.020b |
| CSGH2-H | 500 | 6 | 0.545 ± 0.036b |
3.6. Impact of CSGH on the glucose consumption of insulin resistance HepG2 cells
Fig. 7a demonstrated that glucose consumption of HepG2 cells that were treated with 100 nM insulin was significantly (62.6% of the control, p < 0.01) lower than that in control. And HepG2 cells treated for 24 h with metformin, CSGH1, and CSGH2 at all tested concentrations increased glucose consumption. Compared with the IR group, cells treated with CSGH2 increased glucose consumption by 55.7% (p < 0.01), 58.0% (p < 0.01), and 13.2% (p < 0.05), respectively, indicating that CSGH2 could significantly enhance the glucose uptake, and this effect was not dose-dependent (Fig. 7a). CSGH has high molecular weight and large volume, thus not easily absorbed by the cells. High concentration of extracellular CSGH resulted in the increased osmolality, consequently inhibiting cell viability (Table 4), adversely affecting the intake and utilization of glucose of cells. Therefore the improvement effect of 500 μg mL−1 CSGH2 on glucose consumption was not obvious. Fig. 7a also indicated that CSGH1 could improve the glucose consumption, but the effect of CSGH1 was smaller than metformin and CSGH2 under the same dose. Fig. 7b showed the effect of CSGH on glucose consumption of individual cell. Consistent with the circumstances in Fig. 7a, CSGH2-L and CSGH2-M demonstrated better effect than CSGH1. However, metformin displayed as good promotion effect on glucose consumption of individual cell as CSGH2-M, which was better than its effect on per well.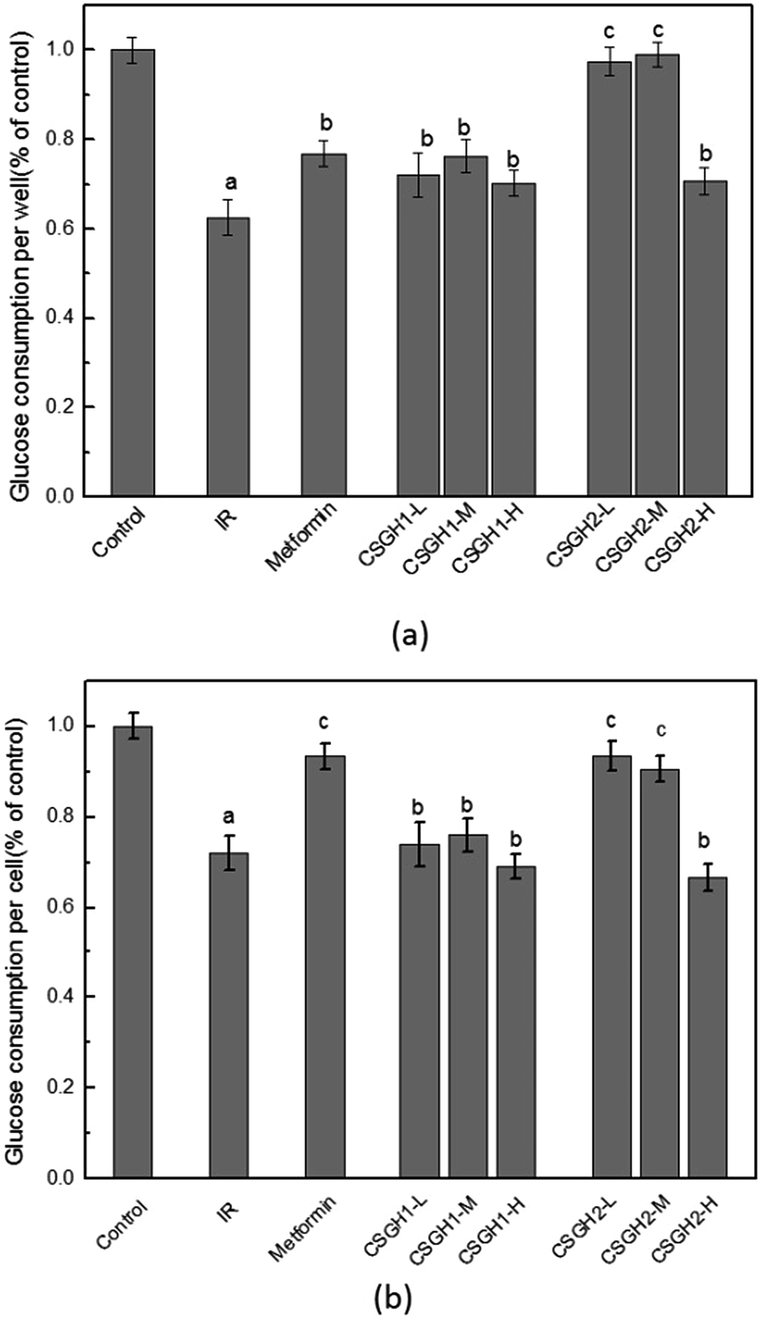 | ||
| Fig. 7 Impact of CSGH on the glucose consumption of insulin resistance HepG2 cell. (a) Glucose consumption per well (b) glucose consumption per cell, a p < 0.01 vs. control group, b p < 0.05 vs. IR group, c p < 0.05 vs. control group. | ||
According to the above discussion, metformin enhanced glucose consumption of each cell, while CSGH not only can promote glucose consumption of individual cell, but can improve cell growth, thereby promoting the glucose absorption and utilization of the whole cell population. Overall, the promotion function to the glucose consumption of IR cells was ordered as following: CSGH2 > metformin > CSGH1.
3.7. Impact on the expression of InsR protein
InsR is the beginning of an insulin signal transduction, which plays an important role in stimulating glucose uptake.14,15 To investigate the molecular mechanism responsible for CSGH-stimulated glucose uptake, we examined the expression of InsR in HepG2 cells. Fig. 8 showed the effects of CSGH on InsR expression in IR HepG2 cells. In the IR group, stimulation with 100 nM insulin for 24 h resulted in significant (42.6% of the control, p < 0.001) decrease in protein expression levels of InsR. However, this reduction was reversed after cells were incubated with metformin and different concentrations of CSGH2. Compared with the IR group, level of InsR was increased markedly by 1.7-fold (p < 0.01) in presence of metformin, and 1.4-fold (p < 0.01), 1.7-fold (p < 0.01), 1.5-fold (p < 0.01), respectively, in presence of CSGH2 at different concentration. Obviously, cells treated with CSGH2 showed higher activity in comparison to those treated with CSGH1 at the same dose. In summary, the InsR improvement order of the samples was: metformin > CSGH2 > CSGH1.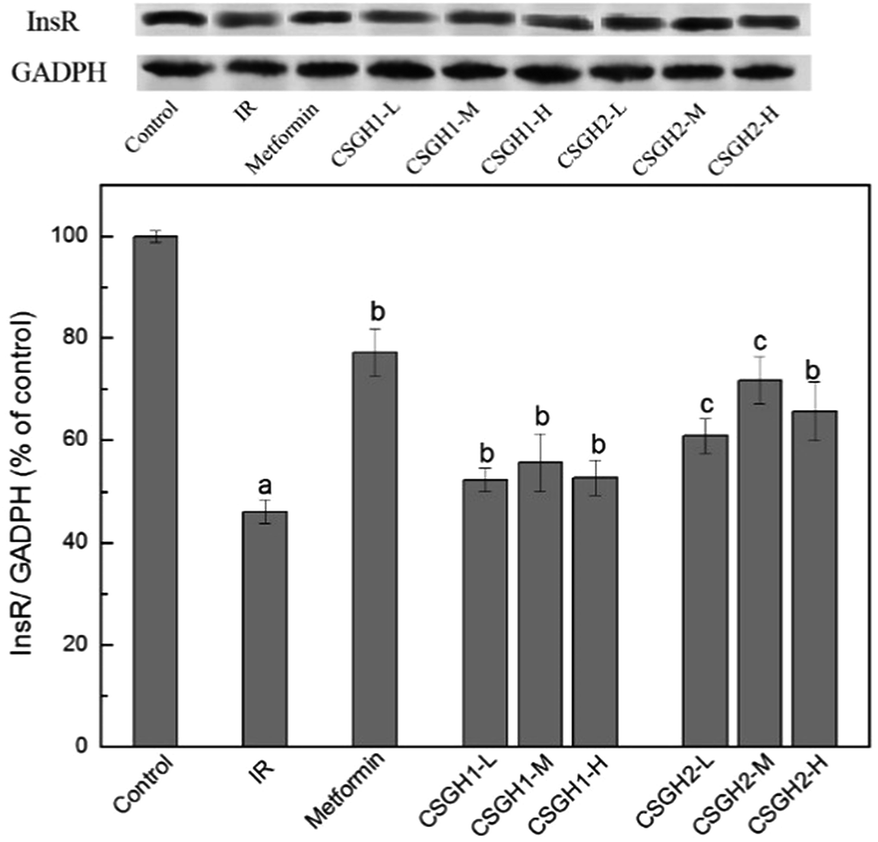 | ||
| Fig. 8 InsR expression levels in HepG2 cells. a p < 0.001 vs. control group, b p < 0.05 vs. IR group, c p < 0.05 vs. metformin group. | ||
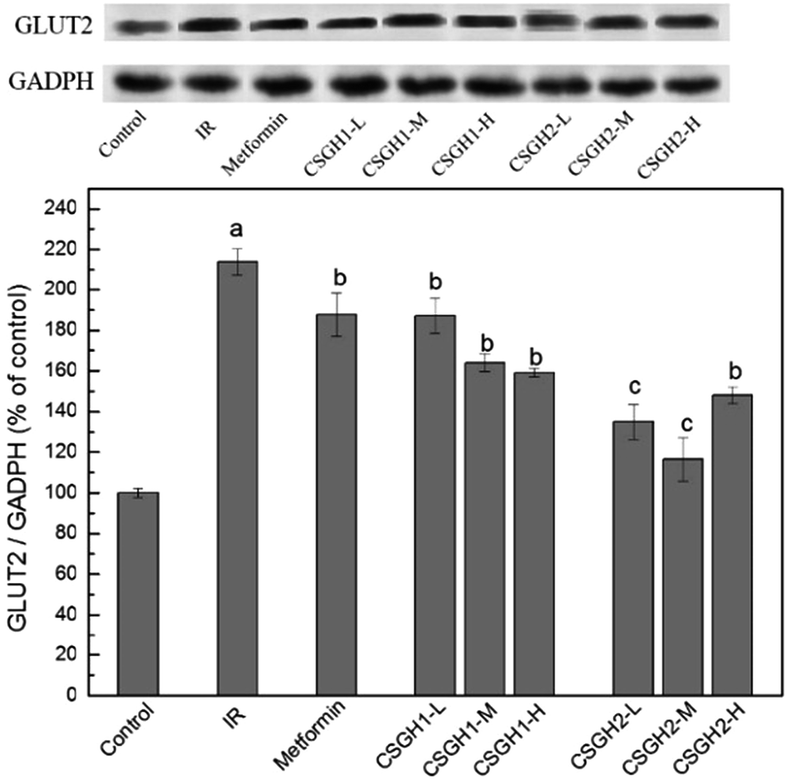
3.8. Impact on the expression of GLUT2 protein
Though CSGH2 at low and medium doses displayed better improvement function on glucose consumption of IR hepatic cells than metformin, the level of InsR expression of CSGH2-L group and CSGH2-M group was lower than that of metformin group (Fig. 8), indicating that the hypoglycemic effect of metformin and CSGH was not only affected by the total amount of InsR. Studies have shown that not only promotion of glucose uptake but also inhibition of glucose output was an important anti-insulin-resistance mechanism in hepatocytes.58 Considering GLUT2 served as a route to control glucose output in IR liver,23,30 GLUT2 was introduced to our system to discuss the effects of CSGH on it.As shown in Fig. 9, the protein expression of GLUT2 in IR group increased by 2.1-fold (p < 0.001) as compared with the control, which was in agreement with previous results.26–29 CSGH2-treatment at three doses markedly decreased the GLUT2 expression by 36.9% (p < 0.01), 45.5% (p < 0.01), and 30.8% (p < 0.01), respectively, relative to the IR HepG2 cells, whereas the decline rate of CSGH1 groups were 12.6% (p < 0.01), 23.4% (p < 0.01), and 27.7% (p < 0.01), respectively, apparently lower than CSGH2 groups. However, the GLUT2 level was only inhibited by 12.3% (p < 0.05) after metformin stimulation. Above all, the order of inhibition function on GLUT2 was CSGH2 > CSGH1 > metformin, which can explain why the glucose consumption in CSGH2-L group and CSGH2-M group were higher than that in metformin group. Based on the results above, it was guessed that CSGH played a role in inhibiting the over-expression of GLUT2, leading to down-regulation of glucose output, thus improving the glucose consumption of IR liver cells.
 | ||
| Fig. 9 GLUT2 expression levels in HepG2 cells. a p < 0.001 vs. control group, b p < 0.05 vs. IR group, c p > 0.05 vs. control group. | ||
4. Conclusions
In this study, chitosan biguanidine hydrochloride (CSGH) was synthesized by chitosan and dicyandiamide under microwave irradiation. CSGH with low DS (43.2%, CSGH1) and medium DS (52.7%, CSGH2) were nontoxic, and able to improve the viability of insulin resistance HepG2 cells. Compared with metformin and CSGH1, CSGH2 displayed excellent improvement function on glucose consumption of IR HepG2 cells. In order to explore the mechanism of CSGH in stimulating glucose consumption in hepatocytes, we examined the expression of InsR and GLUT2. Results indicated that metformin possessed a better increment effect on the protein level of InsR than CSGH, while CSGH exhibited a more substantial inhibition effect on the over-expression of GLUT2 than metformin.In summary, CSGH was likely to be effective by accelerating the expression of InsR and inhibiting the high-insulin-induced over-expression of GLUT2, thereby increasing glucose consumption of HepG2 cells. Therefore, our results may provide a new possible approach for the treatment of diabetes and a new insight into the mechanisms by which chitosan guanidine derivatives ameliorate insulin resistance hepatocytes.
Acknowledgements
This work was financially supported by the National Natural Science Foundation of China (no. 51473120).Notes and references
- F. Gomez-Peralta, C. Abreu and L. Andreu-Urioste, et al., Point-of-carecapillary HbA1c measurement in the emergency department: a useful tool to detect unrecognized and uncontrolled diabetes, Int. J. Emerg. Med., 2016, 9, 1–6 CrossRef PubMed.
- Y. Li, X. Yuan and X. Rong, et al., Design, synthesis and biological evaluation of a hybrid compound berberine and magnolol for improvement of glucose and lipid metabolism, RSC Adv., 2016, 6, 81924–81931 RSC.
- Y. Yan, Q. Wang and W. Li, et al., Discovery of potential biomarkers in exhaled breath for diagnosis of type 2 diabetes mellitus based on GC-MS with metabolomics, RSC Adv., 2014, 4, 25430–25439 RSC.
- C. W. Liu, Y. C. Wang and C. C. Hsieh, et al., Guava (Psidium guajava, Linn.) leaf extract promotes glucose uptake and glycogen accumulation by modulating the insulin signaling pathway in high-glucose-induced insulin-resistant mouse FL83B cells, Process Biochem., 2015, 50, 1128–1135 CrossRef CAS.
- B. Desvergne, L. Michalik and W. Wahli, Transcriptional regulation of metabolism, Physiol. Rev., 2006, 86, 465–514 CrossRef CAS PubMed.
- Z. Tang, et al., TRAM1 protect HepG2 cells from palmitate induced insulin resistance through ER stress-JNK pathway, Biochem. Biophys. Res. Commun., 2015, 457, 578–584 CrossRef CAS PubMed.
- W. L. Zhang, et al., TRAF1 knockdown alleviates palmitate-induced insulin resistance in HepG2 cells through NF-κB pathway, Biochem. Biophys. Res. Commun., 2015, 467, 527–533 CrossRef CAS PubMed.
- W. Y. Zhang, J. J. Lee and I. S. Kim, et al., Stimulation of glucose uptake and improvement of insulin resistance by aromadendrin, Pharmacology, 2011, 88, 266–274 CrossRef CAS PubMed.
- Q. Huang, L. Chen and H. Teng, et al., Phenolic compounds ameliorate the glucose uptake in HepG2 cells' insulin resistance via activating AMPK: Anti-diabetic effect of phenolic compounds in HepG2 cells, J. Funct. Foods, 2015, 19, 487–494 CrossRef CAS.
- E. Kim, S. H. Lee and J. H. Lee, et al., A marine algal polyphenol, dieckol, attenuates blood glucose levels by Akt pathway in alloxan induced hyperglycemia zebrafish model, RSC Adv., 2016, 6, 78570–78575 RSC.
- W. M. Yang, K. H. Min and L. Wan, MiR-1271 upregulated by saturated fatty acid palmitate provokes impaired insulin signaling by repressing INSR and IRS-1 expression in HepG2 cells, Biochem. Biophys. Res. Commun., 2016, 478, 1786–1791 CrossRef CAS PubMed.
- B. Thorens, GLUT2, glucose sensing and glucose homeostasis, Diabetologia, 2015, 58, 221–232 CrossRef CAS PubMed.
- A. Aravinthan, B. Challis and N. Shannon, et al., Selective insulin resistance in hepatocyte senescence, Exp. Cell Res., 2014, 331, 38–45 CrossRef PubMed.
- M. Björnholm and J. R. Zierath, Insulin signal transduction in human skeletal muscle: identifying the defects in Type II diabetes, Biochem. Soc. Trans., 2005, 33, 354–357 CrossRef PubMed.
- Y. Zick, Insulin resistance: a phosphorylation-based uncoupling of insulin signaling, Trends Cell Biol., 2001, 11, 437–441 CrossRef CAS PubMed.
- C. Capurso and A. Capurso, From excess adiposity to insulin resistance: the role of free fatty acids, Vasc. Pharmacol., 2012, 57, 91–97 CrossRef CAS PubMed.
- M. D. Michael, R. N. Kulkarni and C. Postic, et al., Loss of insulin signaling in hepatocytes leads to severe insulin resistance and progressive hepatic dysfunction, Mol. Cell, 2000, 6, 87–97 CrossRef CAS PubMed.
- R. L. Joshi, B. Lamothe and N. Cordonnier, et al., Targeted disruption of the insulin receptor gene in the mouse results in neonatal lethality, EMBO J., 1996, 15, 1542–1547 CAS.
- M. Stumvoll, B. J. Goldstein and T. W. van Haeften, Type 2 diabetes: principles of pathogenesis and therapy, Lancet, 2005, 365, 1333–1346 CrossRef CAS.
- P. Briata, L. Briata and R. Gherzi, Glucose starvation and glycosylation inhibitors reduce insulin receptor gene expression: characterization and potential mechanism in human cells, Biochem. Biophys. Res. Commun., 1990, 169, 397–405 CrossRef CAS PubMed.
- K. Raile, J. Klammt and S. Laue, et al., Glucose concentration and AMP-dependent kinase activation regulate expression of insulin receptor family members in rat islets and INS-1E beta cells, Diabetologia, 2005, 48, 1798–1809 CrossRef CAS PubMed.
- J. R. Levy, G. Krystal and P. Glickman, et al., Effects of media conditions, insulin, and dexamethasone on insulin-receptor messenger-RNA and promoter activity in HepG2 cells, Diabetes, 1991, 40, 58–65 CrossRef CAS PubMed.
- T. Yamamoto, H. Fukumoto and G. Koh, et al., Liver and muscle-fat type glucose transporter gene expression in obese and diabetic rats, Biochem. Biophys. Res. Commun., 1991, 175, 995–1002 CrossRef CAS PubMed.
- M. Uldry and B. Thorens, The SLC2 family of facilitated hexose and polyol transporters, Pfluegers Arch., 2004, 447, 480–489 CrossRef CAS PubMed.
- D. E. James, The mammalian facilitative glucose transporter family, Physiology, 1995, 10, 67–71 CAS.
- T. Matsuzaka, H. Shimano and N. Yahagi, et al., Insulin-independent induction of sterol regulatory element-binding protein-1c expression in the livers of streptozotocin-treated mice, Diabetes, 2004, 53, 560–569 CrossRef CAS PubMed.
- J. U. Ju, L. Mi-Kyung and P. Y. Bok, et al., Effect of citrus flavonoids on lipid metabolism and glucose-regulating enzyme mRNA levels in type-2 diabetic mice, Int. J. Biochem. Cell Biol., 2006, 38, 1134–1145 CrossRef PubMed.
- L. J. Slieker, K. L. Sundell and W. F. Heath, et al., Glucose transporter levels in tissues of spontaneously diabetic Zucker fa/fa rat (ZDF/drt) and viable yellow mouse (Avy/a), Diabetes, 1992, 41, 187–193 CrossRef CAS PubMed.
- Y. Okamoto, S. Tanaka and Y. Haga, Enhanced GLUT2 gene expression in an oleic acid-induced in vitro fatty liver model, Hepatol. Res., 2002, 23, 138–144 CrossRef CAS PubMed.
- S. P. Weinstein, E. O'Boyle and M. Fisher, et al., Regulation of GLUT2 glucose transporter expression in liver by thyroid hormone: evidence for hormonal regulation of the hepatic glucose transport system, Endocrinology, 1994, 135, 649–654 CAS.
- R. J. de Souza, N. Neelakantan and M. Narayanan, et al., Effect of fenugreek (Trigonella foenum-graecum L.) intake on glycemia: A meta-analysis of clinical trials, Nutr. J., 2014, 13, 1475–2891 Search PubMed.
- J. E. Gunton, P. J. Delhanty and S. Takahashi, et al., Metformin rapidly increases insulin receptor activation in human liver and signals preferentially through insulin-receptor substrate-2, J. Clin. Endocrinol. Metab., 2003, 88, 1323–1332 CrossRef CAS PubMed.
- N. Naicker, S. Nagiah and A. Phulukdaree, et al., Trigonella foenum-graecum Seed Extract, 4-Hydroxyisoleucine, and Metformin Stimulate Proximal Insulin Signaling and Increase Expression of Glycogenic Enzymes and GLUT2 in HepG2 Cells, Metab. Syndr. Relat. Disord., 2016, 14, 114–120 CrossRef CAS PubMed.
- M. K. Bhat, R. R. Chhipa and S. Singh, et al., The hypoglycaemic activity of fenugreek seed extract is mediated through the stimulation of an insulin signalling pathway, Br. J. Pharmacol., 2005, 146, 41–48 CrossRef PubMed.
- M. K. Bhat, G. C. Mishra and V. Pandey, et al., Hypolipidemic effect of fenugreek seeds is mediated through inhibition of fat accumulation and upregulation of LDL receptor, Obesity, 2010, 18, 667–674 CrossRef PubMed.
- S. Salpeter, E. Greyber and G. Pasternak, et al., Risk of fatal and nonfatal lactic acidosis with metformin use in type 2 diabetes mellitus, Cochrane Database Syst. Rev., 2010, 163, 2594–2602 Search PubMed.
- X. Jin, X. Liu and Q. Liu, et al., Manufacture and performance of ethylamine hydroxyethyl chitosan/cellulose fiber in N-methylmorpholine-N-oxide system, React. Funct. Polym., 2015, 91–92, 62–70 CrossRef CAS.
- K. Ming, G. C. Xi and X. Ke, et al., Antimicrobial properties of chitosan and mode of action: A state of the art review, Int. J. Food Microbiol., 2010, 144, 51–63 CrossRef PubMed.
- X. Liu, F. Yang and T. Song, et al., Synthesis of carboxymethylated and quaternized chitosans and their therapeutic effect on nonalcoholic Fatty liver disease, J. Agric. Food Chem., 2011, 59, 10683–10692 CrossRef CAS PubMed.
- Y. L. Hsieh, H. T. Yao and R. S. Cheng, et al., Chitosan reduces plasma adipocytokines and lipid accumulation in liver and adipose tissues and ameliorates insulin resistance in diabetic rats, J. Med. Food, 2012, 15, 453–460 CrossRef CAS PubMed.
- X. Liu, F. Yang and T. Song, et al., Therapeutic Effect of Carboxymethylated and Quanternized Chitosan on Insulin Resistance in High-Fat-Diet-Induced Rats and 3T3-L1 Adipocytes, J. Biomater. Sci., Polym. Ed., 2011, 23, 1271–1284 Search PubMed.
- D. Nayak, A. P. Minz and S. Ashe, et al., Synergistic combination of antioxidants, silver nanoparticles and chitosan in a nanoparticle based formulation: Characterization and cytotoxic effect on MCF-7 breast cancer cell lines, J. Colloid Interface Sci., 2016, 470, 142–152 CrossRef CAS PubMed.
- K. C. Yang, C. C. Wu and F. H. Lin, et al., Chitosan/gelatin hydrogel as immunoisolative matrix for injectable bioartificial pancreas, Xenotransplantation, 2008, 15, 407–416 CrossRef PubMed.
- R. Ehness, M. Ecker and D. E. Godt, et al., Glucose and Stress Independently Regulate Source and Sink Metabolism and Defense Mechanisms via Signal Transduction Pathways Involving Protein Phosphorylation, Plant Cell, 1997, 9, 1825–1841 CrossRef CAS PubMed.
- Y. Hu, Y. Du and J. Yang, et al., Synthesis, characterization and antibacterial activity of guanidinylated chitosan, Carbohydr. Polym., 2007, 67, 66–72 CrossRef CAS.
- W. Sang, Z. Tang and M. Y. He, et al., Synthesis and preservative application of quaternized carboxymethyl chitosan containing guanidine groups, Int. J. Biol. Macromol., 2015, 75, 489–494 CrossRef CAS PubMed.
- Q. Liu, Y. Li and X. Jin, et al., Microwave-assisted synthesis of chitosan biguanidine hydrochloride and its antioxidant activity in vitro, J. Appl. Polym. Sci., 2016, 133 DOI:10.1002/app.43570.
- L. Wang, Z. Liu and X. Liu, et al., Microwave-assisted synthesis of chitooligosaccharide guanidine and its effect on GLUT4-dependent glucose uptake through Akt-activated protein kinase signaling pathway in L6 skeletal muscle cells, RSC Adv., 2016, 6, 90777–90785 RSC.
- J. M. Sargent, The use of the MTT assay to study drug resistance in fresh tumour samples, Recent Results Cancer Res., 2003, 161, 13–25 CrossRef CAS PubMed.
- W. G. Zhang, Y. G. Zhou and Y. D. Yang, et al., Effect of Organic Acid and Degradation Condition on Degradation Speed of Chitosan, J. Hebei Norm. Univ. Sci. Technol., 2006, 9, 263–273 Search PubMed.
- T. Wu, Q. Shao and S. Ge, et al., The facile preparation of novel magnetic zirconia composites with the aid of carboxymethyl chitosan and their efficient removal of dye, RSC Adv., 2016, 6, 63 Search PubMed.
- Y. I. Gui-Yuan and C. Z. Cao, Influence of Electronegativity, Polarizability and Steric Effects on the ∼(13)C Nuclear Magnetic Resonance Chemical Shift of Aliphatic Amines, Chin. J. Anal. Chem., 2009, 37, 205–210 Search PubMed.
- L. Heux, J. Brugnerotto and J. Desbrières, et al., Solid state NMR for determination of degree of acetylation of chitin and chitosan, Biomacromolecules, 2000, 1, 746–751 CrossRef CAS PubMed.
- N. Xu and D. Ding, Preparation and Antibacterial Activity of Chitosan Derivative Membrane Complexation with Iodine, RSC Adv., 2015, 5, 79820–79828 RSC.
- T. Tantiplapol, Y. Singsawat and N. Narongsil, et al., Influences of solution plasma conditions on degradation rate and properties of chitosan, Innovative Food Sci. Emerging Technol., 2015, 32, 116–120 CrossRef CAS.
- A. J. Krentz, R. E. Ferner and C. J. Bailey, Comparative Tolerability Profiles of Oral Antidiabetic Agents, Drug Saf., 1994, 11, 223–241 CrossRef CAS PubMed.
- D. D. S. H. Bell, A Comparison of Agents Used to Manage Type 2 Diabetes Mellitus, Treat. Endocrinol., 2004, 3, 67–76 CrossRef PubMed.
- S. C. Shen, F. C. Cheng and N. J. Wu, Effect of guava (Psidium guajava Linn.) leaf soluble solids on glucose metabolism in type 2 diabetic rats, Phytother. Res., 2008, 22, 1458–1464 CrossRef PubMed.
| This journal is © The Royal Society of Chemistry 2017 |