
 Open Access Article
 This Open Access Article is licensed under a
 Creative Commons Attribution 3.0 Unported Licence
Microencapsulation of α-tocopherol with zein and β-cyclodextrin using spray drying for colour stability and shelf-life improvement of fruit beverages†
C. Saldanha do Carmo ab,
C. Maiaab,
Joana Poejoab,
I. Lychkoab,
P. Gamitoab,
I. Nogueirac,
M. R. Bronzeabd,
Ana Teresa Serra*ab and
Catarina M. M. Duarte*ab
ab,
C. Maiaab,
Joana Poejoab,
I. Lychkoab,
P. Gamitoab,
I. Nogueirac,
M. R. Bronzeabd,
Ana Teresa Serra*ab and
Catarina M. M. Duarte*ab
aiBET, Instituto de Biologia Experimental e Tecnológica, Apartado 12, 2780-901 Oeiras, Portugal. E-mail: tserra@ibet.pt; cduarte@itqb.unl.pt
bInstituto de Tecnologia Química e Biológica António Xavier, Universidade Nova de Lisboa (ITQB NOVA), 2780-157 Oeiras, Portugal
cCEFEMA, Instituto Superior Técnico, Universidade de Lisboa, Av. Rovisco Pais, 1049-001 Lisboa, Portugal
diMED, Faculdade de Farmácia da Universidade de Lisboa (FFUL), Av. Prof. Gama Pinto, 1649-019 Lisboa, Portugal
First published on 23rd June 2017
Abstract
α-Tocopherol (TOC) has become an important food additive due to its antioxidant effect and capacity to increase shelf-life of products. However, it is a hydrophobically active compound, which compromises its applicability in soft drinks and fruit beverages. The aim of this study was to develop sustained release forms of α-tocopherol using zein and cyclodextrin as carriers to be further applied in fruit beverage products for improved shelf-life. For this purpose, the encapsulation of α-tocopherol into zein protein was first optimized using a spray-drying technology. Different process conditions, namely temperature (110–180 °C) and solids concentration (0.01–0.04 g mL−1), were tested aiming at maximizing the encapsulation of α-tocopherol and antioxidant capacity using response surface methodology (RSM) following a Face Centred Design (FCD). Results showed that lower inlet gas temperature and lower solids concentration enable the production of α-tocopherol:zein forms with a higher antioxidant activity (oxygen radical absorbance capacity >90 μmol Trolox equivalent antioxidant capacity per g), and the highest encapsulation efficiency (42.05%) was obtained using 0.02 g mL−1 of solids concentration. β-Cyclodextrin was further added to the best system to increase the solubility capacity of α-tocopherol in fruit juice beverages. Despite the lower antioxidant activity (46.2 μmol Trolox equivalent antioxidant capacity per g), α-tocopherol:zein:cyclodextrin forms reduced colour losses when compared to the normal juice, and this effect was probably related to the suppression of anthocyanin degradation due to the formation of inclusion complexes with β-cyclodextrin. Importantly, none of these forms induced cytotoxicity in the Caco2 cell model, confirming the safety of these systems.
Introduction
In recent times, an increasing interest has been observed in employing food biopolymers to fabricate delivery systems of bioactive compounds due to their non-toxicity, biocompatibility and biodegradability.1 Apart from the focus of researchers on the delivery of functional ingredients in foods that bring health benefits, the food industry is also interested in bioactive substances that are also able to improve processing efficiency and maintain quality of food products during processing, transportation and storage. In this field, antioxidants are widely used to enhance the oxidative stability and extend the shelf-life of products.2Tocopherols comprise a class of bioactive compounds that includes various methylated phenols. Tocopherols are extremely valuable compounds because of their bioactivity as vitamins and capacity as anti-oxidizing agent.3 Vitamin E includes both tocopherols and tocotrienols that occur in groups of four (α, β, γ, δ) lipophilic antioxidants synthesized by photosynthetic organisms. α-Tocopherol is the isomer with highest vitamin E activity, and it has become an important additive of numerous food products due to its biological properties,4–7 including antioxidant effect,8 which can promote the shelf-life of products. However, vitamin E is hydrophobically active, which makes it difficult to be directly dispersed into an aqueous phase,9 compromising its applicability in soft drinks and fruit beverages. In addition, it is labile to heat and oxygen; for example, α-tocopherol is irreversibly converted to quinone via epoxide formation when exposed to oxygen and heat.10
As important as the active principle, is the way to deliver/incorporate it in specific food systems. Moreover, its protection from degradation could be significantly improved by using the convenient carriers. Micro- and nano-encapsulated forms of antioxidants are choices of easy application that can overcome this issue, helping to increase the shelf-life of fruits and other products of high demand like fruit beverages, thereby reducing product losses. Moreover, edible coatings containing antioxidants can be used to decrease browning of fruit-based products.11
Zein is the major storage protein from corn, which is considered as a prolamine due to its characteristic hydrophobicity. It has been studied as a versatile food biopolymer to fabricate nanoparticles for encapsulating a large variety of bioactive compounds.12,13 In contrast to hydrophilic animal proteins, zein, a hydrophobic plant protein, enables the production of sustained-release particulate systems, which might not require any further chemical treatment to harden them, thus preventing use of toxic chemical crosslinkers.2 Moreover, the use of plant-protein-based delivery systems may offer novel functional foods to consumers particularly for vegans. Zein is also known for its high thermal resistance and great oxygen barrier properties,14 making it suitable to encapsulate food antioxidants. Processing temperature is an important factor for various proteins because they denature at high temperatures, causing irreversible structural changes. Zein has a very stable structure, requiring high concentration of denaturants, pH, or elevated temperature to produce structure changes.15 In recent years, zein has been applied in the development of delivery systems to encapsulate several hydrophobic active ingredients using different methodologies, such as curcumin by evaporation, followed by freeze-drying,16 vitamin D3 by freeze-drying,17 lutein by solution enhanced dispersion by supercritical fluids (SEDS),18 and quercetin by complexation followed by freeze-drying.19 Zein was also used to prepare TOC nanoparticles coated with chitosan, demonstrating to be a promising delivery system for hydrophobic nutrients due to the improvement of TOC slow release and better protection against gastrointestinal conditions.20 This study confirmed the occurrence of electrostatic interactions between α-tocopherol and zein.
Recently, several studies have been conducted to investigate the impact of having stabilizers, namely arabic gum, sodium caseinate and chitosan, to facilitate zein dispersion in water and provide protection of active principles against gastrointestinal conditions and enhance its releasing property.9,12,20 In this field, cyclodextrins are very attractive due to their ability to form complexes with the target compounds and protect them against oxidation and heat-induced degradation21 and improve the solubility of zein in aqueous food products.22
In this study, a novel micro-scale delivery system of α-tocopherol using zein and cyclodextrins was developed to improve the shelf-life and colour stability of fruit beverages. Response surface methodology (RSM) was used to model the encapsulation of the antioxidant into zein protein using spray-drying technology. The influence of temperature and solids concentration on the encapsulation efficiency and antioxidant activity was evaluated. β-Cyclodextrin was further added to the best formulation aiming at improving the solubility of zein:α-tocopherol forms in aqueous systems and the shelf-life of fruit juices.
Experimental
Materials
Corn zein (NF F4400C non-GMO/food grade) was supplied by Flo Chemical Corporation (Ashburnham, MA, USA); α-tocopherol ≥ 95.5% was purchase from Sigma-Aldrich Chemical Co. Ltd. (St. Louis, MO, USA); ethanol absolute 99.9% was purchase from Scharlau (Sentmenat, Barcelona, Spain); β-cyclodextrin (Cavamax® W7 Food) was supplied by Wacker Chemie AG (München, Germany).Chemicals used for antioxidant activity assays (ORAC) included 2′,2′-azobis(2-amidinopropane)dihydrochloride (AAPH), 6-hydroxy-2,5,7,8-tetramethylchroman-2-carboxylic acid (Trolox), and disodium fluorescein (FL) and they were obtained from TCI Europe (Antwerp, Belgium).
Reagents used for phosphate buffered solution (PBS) preparation included sodium phosphate monobasic monohydrate (NaH2PO4·H2O) from Sigma-Aldrich (St. Quentin Fallavier, France) and sodium phosphate dibasic heptahydrate (Na2HPO4·6H2O) from Riedel-de-Haën (Seelze, Germany).
Reagents used for cytotoxicity: all cell culture media and supplements, namely, RPMI 1640 medium, 10% of fetal bovine serum (FBS), 1% penicillin–streptomycin (PS) and trypsin/EDTA (0.25 trypsin–EDTA (1×)), were obtained from Invitrogen (Invitrogen Corporation, Paisley, UK). Phosphate buffered saline (PBS) powder was obtained from Sigma-Aldrich (St. Louis, MO, USA), and CellTiter 96® AQueous One Solution Cell Proliferation Assay was obtained from Promega (Wisconsin, USA).
Methods used for the encapsulation of α-tocopherol
![[thin space (1/6-em)]](https://www.rsc.org/images/entities/char_2009.gif) :Z of 1:6. This ratio was selected and fixed after preliminary trials concerning homogeneity of dispersion by visual observation. After their preparation, they were pumped into the spray dryer.
:Z of 1:6. This ratio was selected and fixed after preliminary trials concerning homogeneity of dispersion by visual observation. After their preparation, they were pumped into the spray dryer.
| Variable, factors, unit | Levels | ||
|---|---|---|---|
| −1 | 0 | +1 | |
| Temperature, T (°C) | 110 | 150 | 180 |
| [Solids], g mL−1 | 0.01 | 0.02 | 0.04 |
![[thin space (1/6-em)]](https://www.rsc.org/images/entities/b_char_2009.gif) :α-tocopherol (1:6) solution with addition of β-cyclodextrin in 40% EtOH. After the best formulation was obtained, β-cyclodextrin was added as a protecting agent during spray-drying process that simultaneously enhances the solubility of zein in aqueous systems. Two solutions were prepared separately, both using 40% ethanol, which is an intermediate solubility between zein and β-cyclodextrin.23 To prepare the first solution, 2.5 g of zein was solubilized in 200 mL of ethanol at 50 °C. For the preparation of the second solution, 1.85 g of β-cyclodextrin was solubilized in 100 mL of ethanol, and then 0.5 g of α-tocopherol was added (inclusion complex). The two solutions were mixed together after cooling (room temperature) of the first solution and homogenised, leading to a final volume of 300 mL that was pumped into the spray dryer.
:α-tocopherol (1:6) solution with addition of β-cyclodextrin in 40% EtOH. After the best formulation was obtained, β-cyclodextrin was added as a protecting agent during spray-drying process that simultaneously enhances the solubility of zein in aqueous systems. Two solutions were prepared separately, both using 40% ethanol, which is an intermediate solubility between zein and β-cyclodextrin.23 To prepare the first solution, 2.5 g of zein was solubilized in 200 mL of ethanol at 50 °C. For the preparation of the second solution, 1.85 g of β-cyclodextrin was solubilized in 100 mL of ethanol, and then 0.5 g of α-tocopherol was added (inclusion complex). The two solutions were mixed together after cooling (room temperature) of the first solution and homogenised, leading to a final volume of 300 mL that was pumped into the spray dryer.| Experiment number | Variables | Responses | |
|---|---|---|---|
| Temperature, T (°C) | Solids concentration ([solids] (g mL−1)) | ||
| 1 | 110 | 0.01 | |
| 2 | 110 | 0.04 | Yield of collected particles (%) |
| 3 | 180 | 0.01 | |
| 4 | 180 | 0.04 | Encapsulation load (mg TOC per mg particles) |
| 5 | 110 | 0.02 | Encapsulation efficiency (%) |
| 6 | 180 | 0.02 | |
| 7 | 150 | 0.01 | Oxygen radical absorbance capacity – ORAC (μmol TEAC per g part.) |
| 8 | 150 | 0.04 | |
| 9 (C) | 150 | 0.02 | |
| 10 (C) | 150 | 0.02 | |
Characterization of the encapsulated forms
Cytotoxicity evaluation in Caco2 cells
 of CIElab):
  . The results were expressed in accordance with the CIElab system with reference to illuminant D65.38 Statistical analysis was carried out using GraphPad Prism 5 software. Data are mean ± SD from at least duplicate data. One-way ANOVA analysis with Turkey's post multiple comparison test was performed to assess differences between samples. Statistical significance was found for p < 0.05.
Results and discussion
Modelling of TOC encapsulation into zein protein through spray-drying technology
Aiming at producing zein-encapsulated forms of α-tocopherol to be further incorporated in beverages the spray-drying process was modelled and optimized according to the CCFC design previously described (Table 2). The obtained results, i.e. α-tocopherol load, encapsulation efficiency (EE), yield of collected particles (YCP) and ORAC values, are shown in Table 3.| Samples | DOE # | T (°C) | [Solids] (g mL−1) | YCP (%) | Load (mg TOC per mg particles) | EE (%) | ORAC (μmol TEAC per g particles) | Z-Average (nm) |
|---|---|---|---|---|---|---|---|---|
| TOC | — | — | — | — | — | — | 33.0 ± 1.0 | — |
| SD zein | — | — | — | — | — | — | 59.7 ± 1.7 | — |
| Experiment number | 1 | 110 | 0.01 | 61.67 | 0.063 ± 0.0035 | 31.40 | 106.2 ± 7.0 | 1523.3 ± 377.2 |
| 2 | 110 | 0.04 | 72.79 | 0.070 ± 0.0028 | 34.80 | 87.5 ± 2.2 | 2359.7 ± 819.2 | |
| 3 | 180 | 0.01 | 55.33 | 0.081 ± 0.0009 | 40.59 | 86.0 ± 2.4 | 6122.0 ± 909.3 | |
| 4 | 180 | 0.04 | 77.67 | 0.081 ± 0.0010 | 40.86 | 64.9 ± 3.4 | 6116.0 ± 256.0 | |
| 5 | 110 | 0.02 | 57.72 | 0.084 ± 0.0002 | 42.05 | 96.4 ± 0.4 | 5199.5 ± 236.9 | |
| 6 | 180 | 0.02 | 43.57 | 0.075 ± 0.0015 | 37.36 | 86.9 ± 0.7 | 5384.0 ± 149.9 | |
| 7 | 150 | 0.01 | 60.90 | 0.075 ± 0.0009 | 37.71 | 88.2 ± 2.4 | 4583.5 ± 265.2 | |
| 8 | 150 | 0.04 | 66.49 | 0.073 ± 0.0042 | 36.34 | 75.8 ± 1.8 | 8534.0 ± 240.4 | |
| 9 (C) | 150 | 0.02 | 47.93 | 0.073 ± 0.0007 | 36.62 | 86.0 ± 2.5 | 3772.5 ± 724.8 | |
| 10 (C) | 150 | 0.02 | 76.50 | 0.069 ± 0.0003 | 34.51 | 87.9 ± 0.7 | 2127.0 ± 260.2 |
These results were used to estimate both linear and quadratic effects of variables and also their linear interactions (see ESI†). For the YCP, EL and EE, a lack of fit of the polynomial models exhibited by low values of R2 and Radj2 was observed.
The response surface (Fig. 1) fitted to ORAC values can be described by a second-order polynomial model as a function of temperature (T) and solids concentration ([solids]) (Table 4). In these response surface models, the significant effects with p < 0.05 and those having confidence range smaller than the value of the effect, or smaller than the standard deviation (data not shown), were included in the model equations of this surface. It is better to accept a factor with values higher than 0.05 rather than to take the chance of missing an important factor.30
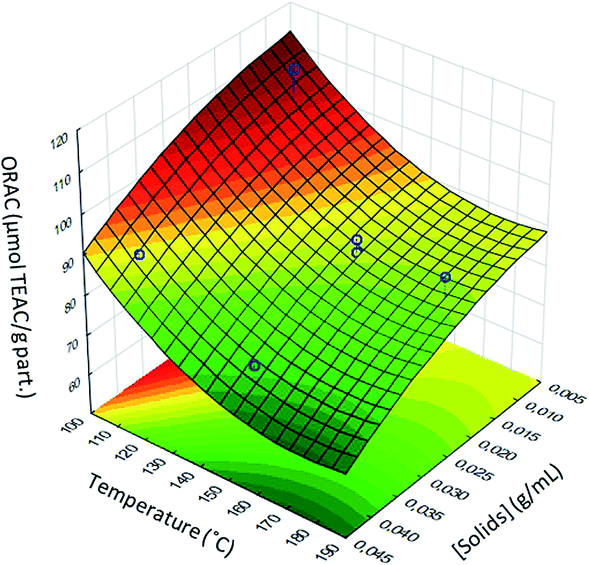 | ||
| Fig. 1 Response surface fitted to the ORAC as a function of temperature and solid concentration. | ||
| Polynomial model equation | R2 | Radj2 |
|---|---|---|
| ORAC = 226.595 − 56.451 [solids] − 992.932 [solids]2 − 1.587T + 0.005T2 | 0.92 | 0.85 |
The good values for both R2 and Radj2 of these models (Table 4) suggest a close agreement between the experimental data and the theoretical values predicted by the model. About 92% of the observed results concerning the ORAC are explained by the present model. However, only the identification of the region corresponding to the best response could be achieved. The best response was achieved at a temperature of 110 °C and solids concentration of 0.01 g mL−1.
The analysis of the data showed that there was a significant negative linear effect of [solids] and T on the ORAC values, indicating that as the [solids] and T increased (independently), the ORAC value decreased, meaning that when the encapsulation process was conducted at higher temperatures or higher [solids], the antioxidant activity of the systems decreased. This can be due to the degradation of α-tocopherol and zein pigments under higher temperatures once these compounds are thermosensitive.39,40 The antioxidant activities obtained were between 64.9 and 106.2 μmol TEAC per g particles. The repeatability (coefficient of variation) of the encapsulation process through spray drying was around 4.2%, taking into account two samples of the design (centre points).
As shown in Table 3, YCP (mass of particles collected/mass of product introduced in the pressure vessel) was between 43.57 and 77.67%, being higher at higher temperatures (180 °C) and higher solids concentration (0.04 g mL−1). Quispe-Condori et al., 2011, have reported similar findings that can be possibly explained by the fact that a larger amount of zein together with higher temperatures (less stickiness) might have allowed the formation of thicker microparticle walls.41 In this study, flax oil was microencapsulated with zein using spray and freeze drying, and similar process yields (64.22–78.97%) were obtained.41 However, it is important to highlight that the highest temperature used in this study was 135 °C. Another study concerning the encapsulation of tomato oleoresin with zein prepared from corn gluten meal produced by spray drying enabled particle yields of 67.41–76.12%.42 In this case, the highest temperature used was 120 °C. Lower process yields were obtained at lower temperatures once the particles became stickier towards the equipment due to their expected higher water content. Moreover, the spray drier contains dead volume that leads to a large amount of powders stacked along the walls and corners of the equipment that cannot be manually recovered with the brush. The encapsulation efficiency was determined from the tocopherol load that was found to be between 31.40% and 42.05%. For the same solid concentration, with an increase in temperature, not only a decrease in the antioxidant activity was observed but also an increase in the encapsulation load was verified.
SEM micrographs of non-processed zein and spray-dried TOC:Z forms for comparable conditions are presented in Fig. 2.
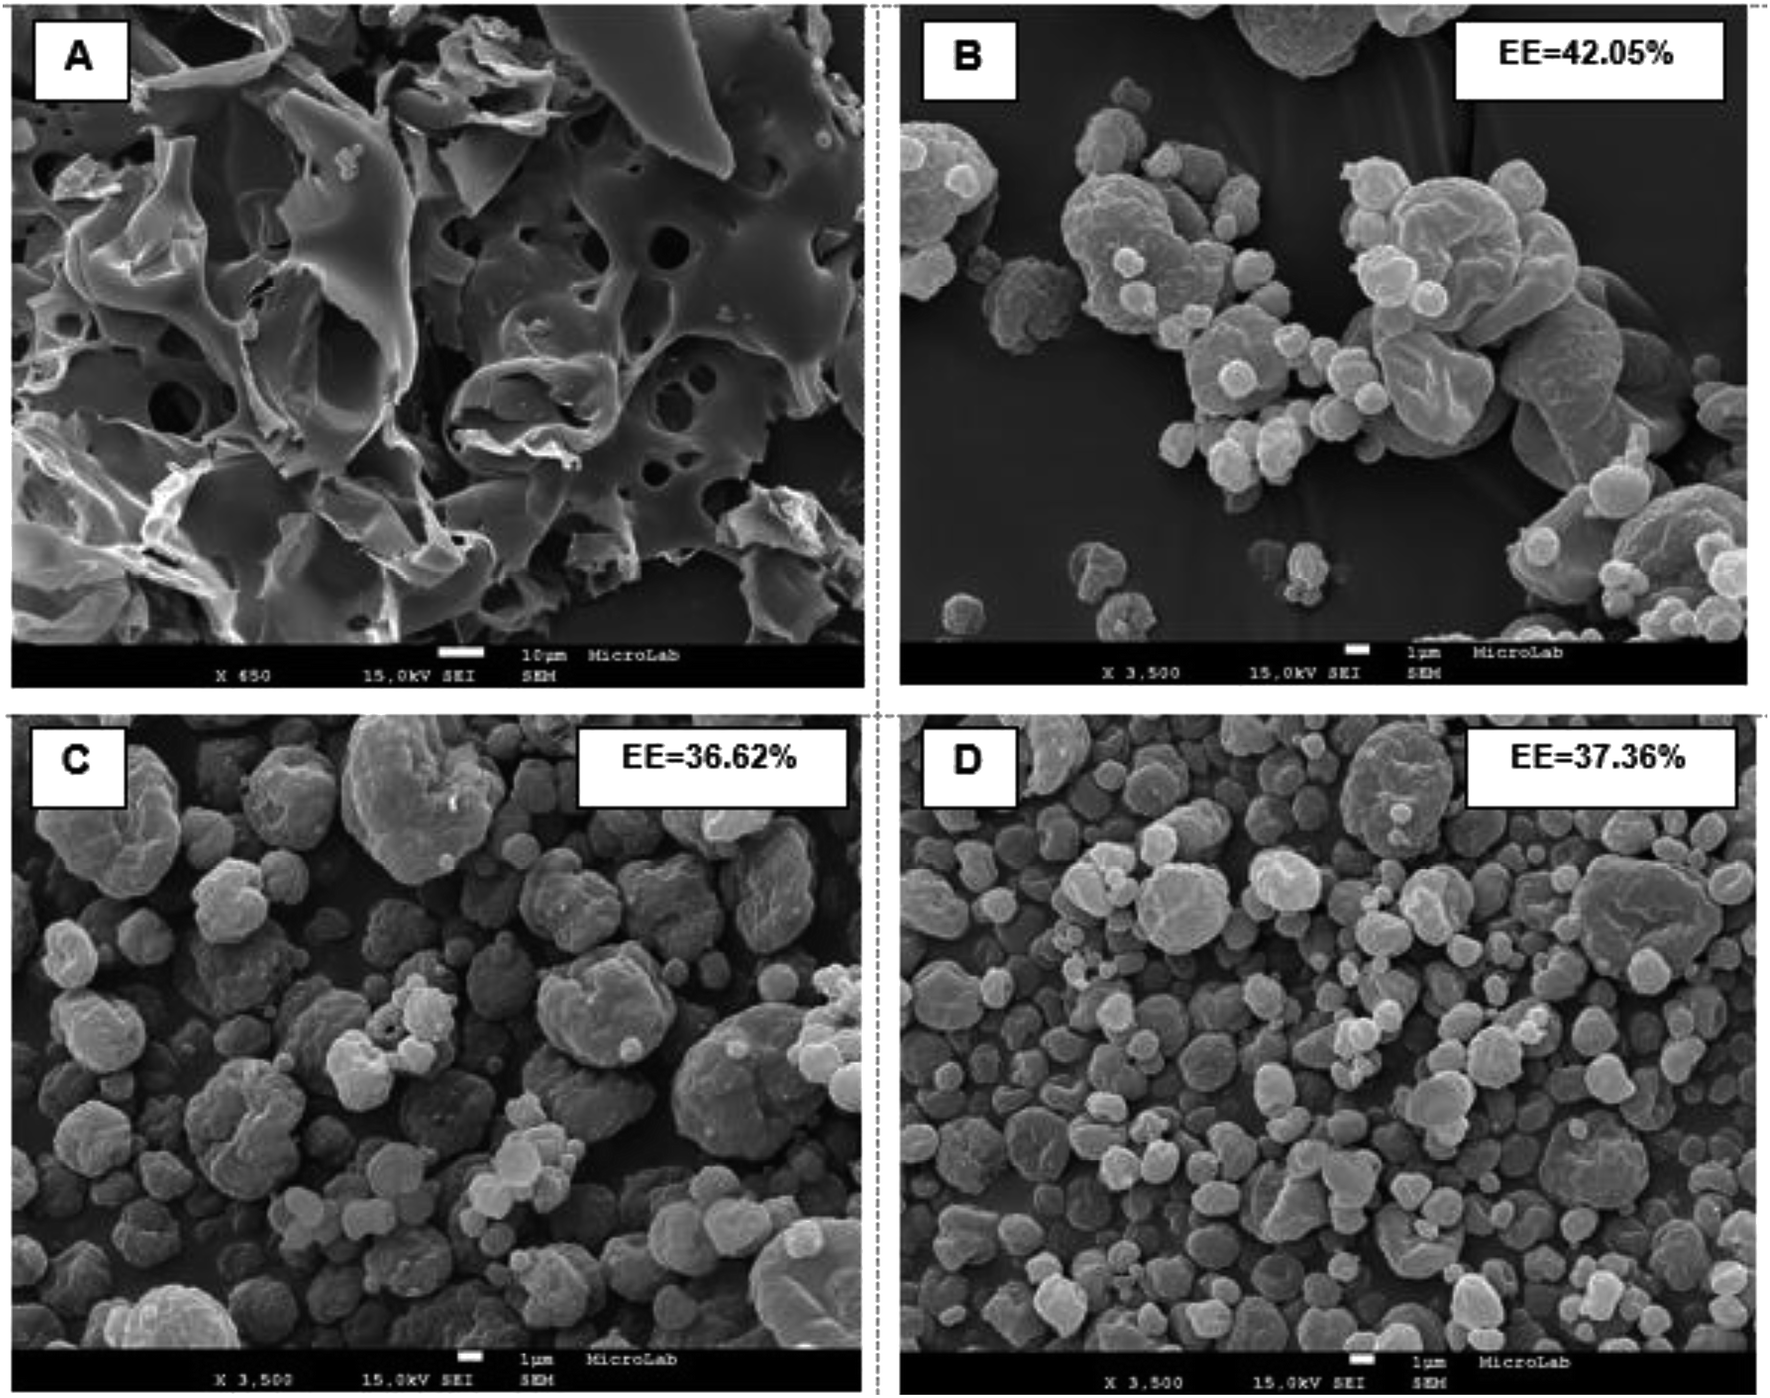 | ||
| Fig. 2 SEM micrographs: (A) non-spray-dried zein (×200); (B) spray-dried Z:TOC microparticles (110 °C, 0.02 g mL−1); (C) spray-dried Z:TOC microparticles (150 °C, 0.02 g mL−1); (D) spray-dried Z:TOC microparticles (180 °C, 0.02 g mL−1). SEM images (B–D) with magnification of ×3500. | ||
Non-processed zein had an irregular shape with an internal porous network. This observation is similar to that observed by other authors.41,43
Concerning the spray-dried TOC:Z microparticles, for the same solids concentration, it was possible to visualize an increased deformation when operating at lower temperatures (110 °C) as the solvent diffusion is slower, allowing more time for structures to deform. These results are in agreement with previous studies.44 In the case of microparticles produced with different solids concentration (images not shown), it was possible to visualize a more round shape with increasing solids concentration. Analogous results were obtained by Gomez-Estaca et al., 2012, during the formation of zein nanoparticles by electrohydrodynamic atomization.45
When the concentration of zein was increased to 2.5%, the formation of compact and round particles could be perceived with a smoother surface. The average particle diameter was 1–5 μm (110 °C, 0.02 g mL−1), 1–5 μm (150 °C, 0.02 g mL−1) and 0.5–5 μm (180 °C, 0.02 g mL−1). Gomez-Estaca et al., 2012, have found an average particle size for zein particles for curcumin encapsulation of about 175–900 nm (ref. 45), and Davidov-Pardo et al.,2013, have found an average particle size of 4–16 μm for zein microcapsules for encapsulation of a grape seed extract.39
Development of CD–Z–TOC complexes
α-Tocopherol:zein particles incorporating β-cyclodextrin were obtained by spray drying using the optimized process conditions (110 °C; 0.01%). The antioxidant activity of this system was found to be 46.2 μmol TEAC per g particles. SEM images of TOC:CD:Z forms after spray drying are shown in Fig. 3. From the images captured by SEM for TOC:CD:Z, it was possible to identify the presence of β-cyclodextrin (CD) with a spherical shape and smooth surface with more or less pronounced concavities. The average particle diameter was found to be around 10 μm.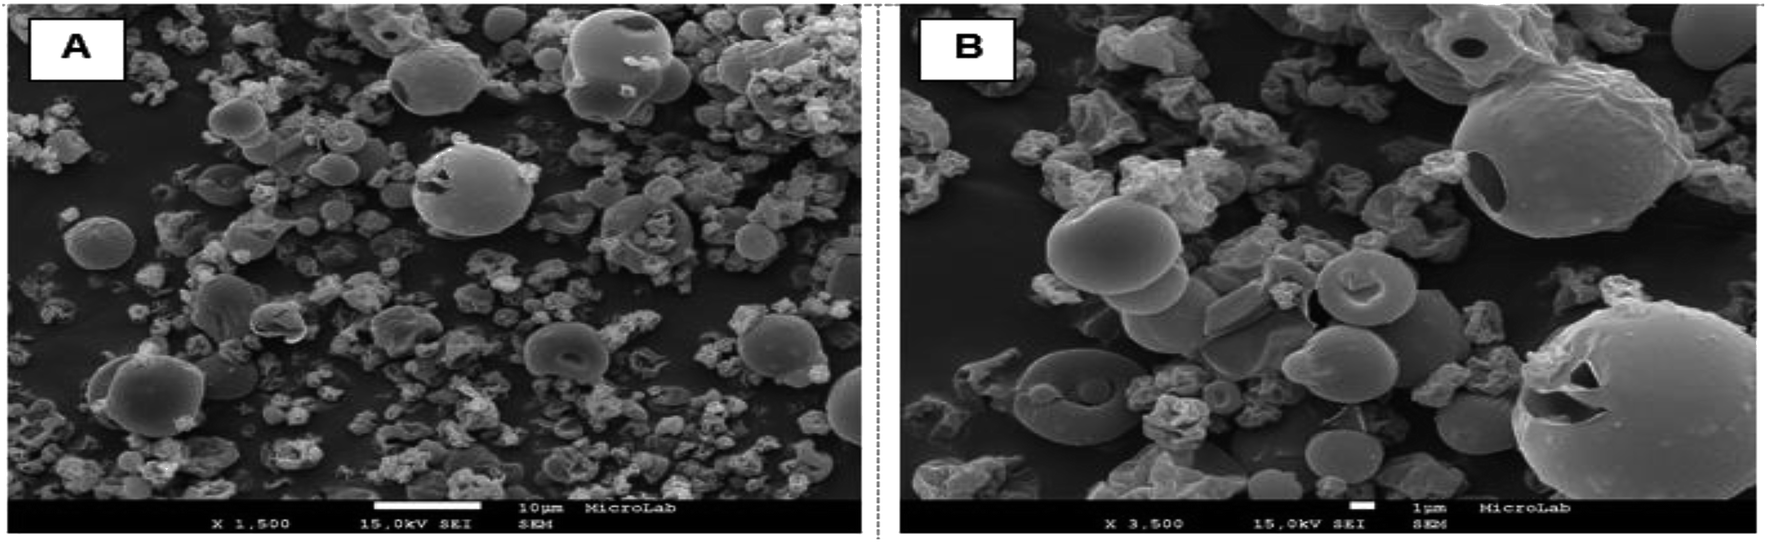 | ||
| Fig. 3 SEM micrographs: spray-dried TOC:CD:Z with magnification of ×1500 (A) and ×3500 (B). | ||
FTIR-ATR
FTIR spectra of β-cyclodextrin (β-CD), zein (Z), spray-dried zein (SD Z), α-tocopherol:zein particles (TOC:Z) and α-tocopherol:cyclodextrin:zein particles (TOC:CD:Z) are shown in Fig. 4.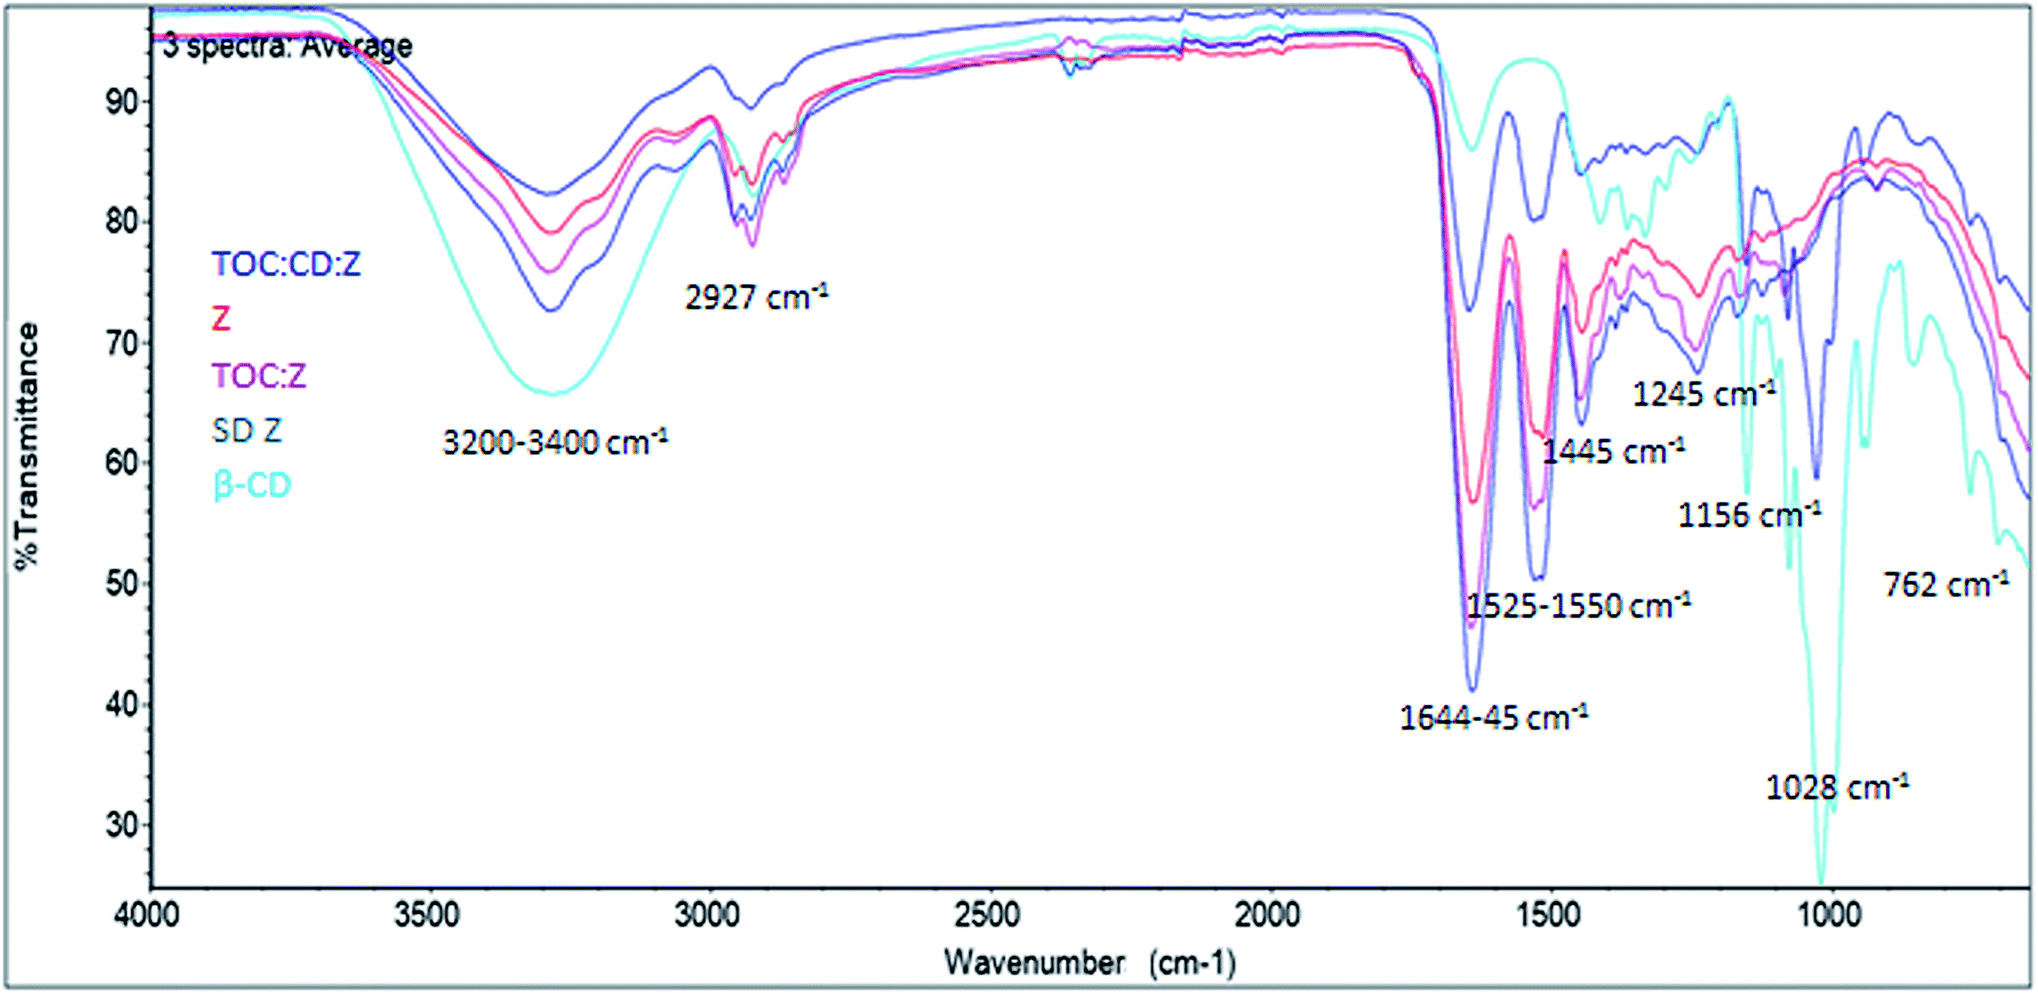 | ||
| Fig. 4 FTIR spectrum of β-cyclodextrin (β-CD), zein (Z), spray-dried zein (SD Z), α-tocopherol:zein particles (TOC:Z) and α-tocopherol:cyclodextrin:zein particles (TOC:CD:Z). | ||
All samples presented a strong and broad band peak between 3255 and 3289 cm−1, corresponding to bonded O–H stretching.46 A broad band due to hydrogen bond appeared normally between 3200 and 3400 cm−1, which is attributed to complex vibrational stretching, associated with free, inter- and intramolecular bound hydroxyl groups.47 Nevertheless, bands 3289–3285 cm−1 of all samples except for β-CD are associated with N–H stretching of the amine group, belonging to zein protein.48 Band 2927 cm−1 in all samples reveals the presence of C–H bonding.49
Samples containing zein show a characteristic FTIR spectrum, with bands of amide I at ∼1650 cm−1, amide II at ∼1530–50 cm−1, and a set of weaker bands that represent amide III vibration modes centered at ∼1245 cm−1.50,51
For β-CD, a band at 1645 cm−1 could be observed corresponding to a O–H bending characteristic of this compound.52 A band at 1525 cm−1 except for β-CD corresponds to a shift from β-sheet structure of zein, which absorbs around 1525 cm−1, to α-helical structure, which has its amide II maximum at 1545 cm−1. The shift in the amide II peak was shifted to around 1535 cm−1, suggesting the presence of interaction between CD molecules and zein chains. It is expected that β-CD sequesters the hydrophobic moieties on the protein surface.53–55 A band was also observed at the 1447 cm−1 for SD Z, TOC:Z and Z, which is attributed to the vibrations of attached hydrocarbon chains.56 Bands at 1156 cm−1 and 1028 cm−1 appearing for pure β-CD and the complexes (TOC:CD:Z) correspond to C–O and CO/CC stretches, respectively, and are characteristic of this compound.52,57,58 According to the literature, α-tocopherol presents a characteristic absorption band at 1460 cm−1 for the phenyl skeletal and the overlap of asymmetrical methyl bending and methylene scissoring vibration and at 1377 cm−1 for symmetrical methyl bending. These bands were used to assess the interaction between cyclodextrins and the guest molecule (α-tocopherol) in the solid state.21 It is proposed that a tight fitting of α-tocopherol within the β-CD cavity would hinder these molecular vibrations, consequently diminishing the intensities of their absorption bands. It is expected that electrostatic interactions occurred between α-tocopherol and zein once the bands of amide I and amide II groups of α-tocopherol and zein particles were shifted from 1664 and 1550 cm−1 to 1660 and 1547 cm−1, respectively.20
The spectrum of the TOC:CD:Z complex appears to be very similar to that of its β-CD host. These observations are in accordance with what was found by Koontz et al., 2009.21 Finally, the band at 762 cm−1 is characteristic of a pyranose ring vibration of β-CD that is present only for pure β-CD and the complexes (TOC:CD:Z).
Overall, FTIR spectra confirm the interaction between zein and cyclodextrin and between cyclodextrin and α-tocopherol.
DLS
The particle size distribution of TOC:Z particles obtained by spray drying was analysed by DLS. The average size of particles produced at different drying conditions varied between 1523.3 and 8534.0 nm (Table 3), being in agreement with SEM images (Fig. 2). The wide range of particle sizes obtained could be also due to some particle aggregation.Cytotoxicity
The cytotoxicities of TOC:Z and TOC:CD:Z were assessed using confluent and undifferentiated Caco2 cells. Because our study was focused on the development of microparticles for food applications, we tested their safety on the gastrointestinal track using an accepted intestinal model, namely Caco2 cell model, which shares some characteristics with crypt enterocytes.59 This cell model has been widely implemented to assess the effect of chemicals, food compounds and nanoparticles on the intestinal function as described by several authors.32,33,59,60 As shown in Fig. 5, cell viability obtained after 24 hours of incubation with different concentrations of TOC formulations did not significantly decrease (p > 0.05) relative to the control group (cells with RPMI medium). However, when Caco2 cells were incubated for 48 h with Z:TOC samples, a slight decrease (up to 15% reduction) was observed. Importantly, the sample CD:Z:TOC did not show cytotoxic effect at 48 h of incubation, indicating that the addition of β-cyclodextrin to the system decreased the cytotoxic effects of Z:TOC, as previously suggested by other authors.61,62 As expected, free TOC did not present cytotoxic effect in this cell line (data not shown).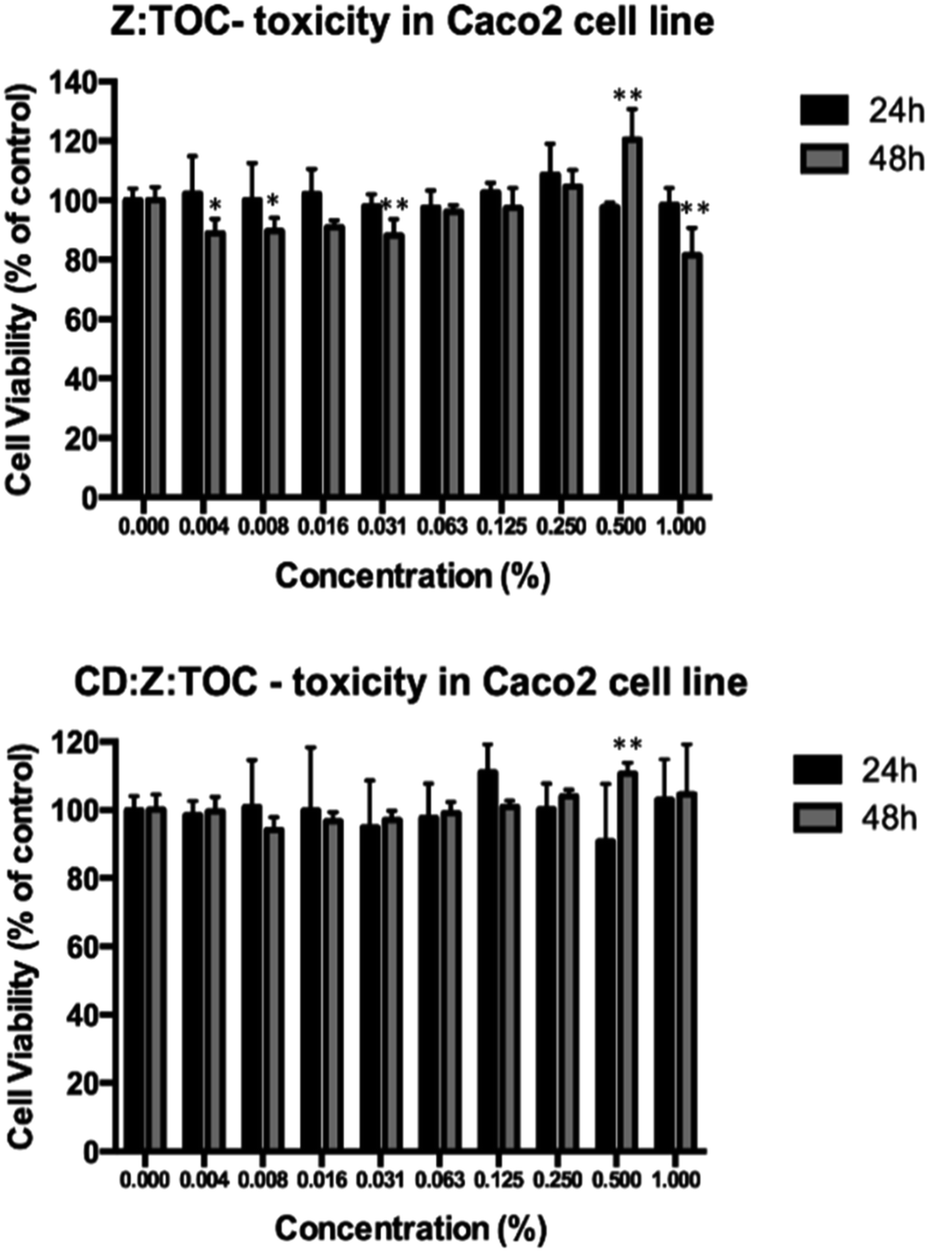 | ||
| Fig. 5 Percentage of cell viability obtained for Caco2 cells incubated with increasing concentrations of α-tocopherol formulations during 24 and 48 hours. Results are means of 2 independent experiments performed in triplicate ± SD. For both assays, a p < 0.05 was considered as statistically significant; *p < 0.05 and **p < 0.01 are relative to respective control. | ||
Shelf-life stability
To assess the commercial applicability for the obtained TOC:Z and TOC:CD:Z forms, their performance in freshly prepared strawberry juice was evaluated. The quantity of TOC:Z forms added to the juice was 1%, whereas for TOC:CD:Z forms, a lower amount was incorporated (0.59%), taking into account the maximum amount of β-CD allowed in beverages.63 The obtained results concerning the colour properties are present in Table 5. The CIELab system was used to define the colour properties, and L*, a*, b*, C*, h° and ΔE* were calculated. Lightness of freshly prepared juice without (control sample) and with addition of free TOC (+TOC), TOC:Z forms (+TOC:Z) and TOC:CD:Z forms (+TOC:CD:Z) did not change much throughout the accelerated aging time. However, great changes were verified for a* (green-red) and b* values (blueness-yellowness) for all samples compared to their respective control samples (t = 0). Chroma, which expresses the brilliance or purity of a colour, decreased and the hue angle, which indicated the tonality, also decreased with aging. The total colour difference value (ΔE*) is a measurement of the extent to which the colour of the other samples was similar to the control samples (t = 0).| t | L* | a* | b* | C* | h° | ΔE* | |
|---|---|---|---|---|---|---|---|
| Control (juice) | 0 | 30.83 ± 0.12 | 25.86 ± 0.31 | 12.76 ± 0.21 | 28.84 | 26.26 | 0.00 |
| 10 | 30.80 ± 0.06 | 18.58 ± 0.02 | 7.86 ± 0.01 | 20.18 | 22.93 | 8.77 | |
| +TOC | 0 | 29.98 ± 0.20 | 23.90 ± 0.04 | 10.95 ± 0.08 | 26.29 | 24.62 | 0.00 |
| 10 | 31.40 ± 0.01 | 19.31 ± 0.05 | 8.59 ± 0.02 | 21.14 | 23.98 | 5.35 | |
| +TOC:Z | 0 | 32.09 ± 0.29 | 24.24 ± 0.40 | 10.81 ± 0.30 | 26.53 | 24.04 | 0.00 |
| 10 | 31.64 ± 0.04 | 18.66 ± 0.08 | 8.03 ± 0.04 | 20.31 | 23.28 | 6.25 | |
| +TOC:CD:Z | 0 | 31.05 ± 0.16 | 23.27 ± 0.47 | 11.38 ± 0.06 | 25.90 | 26.06 | 0.00 |
| 10 | 32.13 ± 0.05 | 16.82 ± 0.51 | 8.38 ± 0.03 | 18.79 | 26.48 | 6.16 |
It may be considered that more than 5 units of difference indicates that the human eye is capable of distinguishing between these colours. An overall color difference of 0–1.5 can be considered small, which indicates that the sample is almost identical to the original by visual observation.
When the ΔE* value is located within the range of 1.5–5, the colour difference can be distinguished, and this difference becomes evident when the ΔE* value is greater than 5.64
It is important to mention that free TOC leads to phase separation after accelerated aging (Fig. 6). This observation was expected because vitamin E is not soluble in aqueous systems, and therefore, it is important to find solutions so it can be used in beverages. Upon its addition in beverages, it is common to observe vitamin E droplets gradually rising to the surface of a beverage bottle within days and forming a ring around the bottle.8
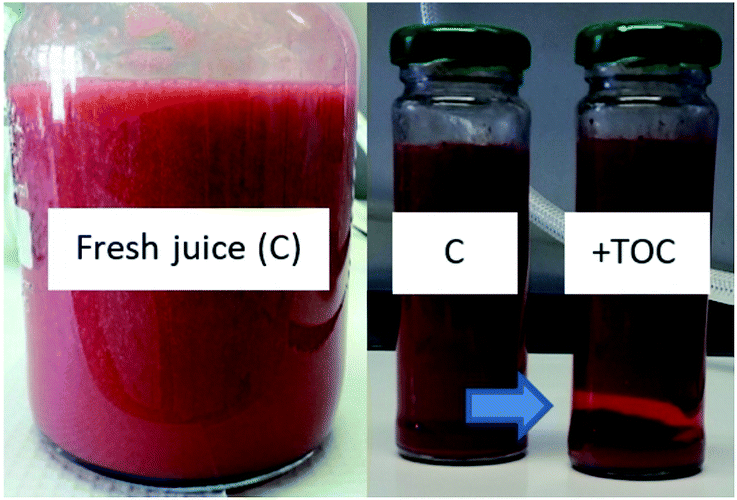 | ||
| Fig. 6 Phase separation upon addition of TOC (+TOC) into the strawberry juice compared to the juice without addition of TOC (C), after accelerating aging (10 days). | ||
Concerning TOC:Z:CD forms, the hue angle, which indicated the tonality, also did not decrease with accelerated aging. Even though TOC:Z:CD particles presented antioxidant activity lower than that of TOC:Z particles, their performance seemed to be better for protection against degradation. This can probably be explained by the capacity of β-cyclodextrin to suppress anthocyanin degradation65 due to the formation of inclusion complexes (Mourtzinos et al., 2008).
Conclusions
This study demonstrated that the use of TOC:Z and TOC:CD:Z forms prepared by spray drying is a promising approach to prolong the shelf-life of beverages due to its antioxidant properties and good dispersibility and solubility. Under an inlet gas temperature of 110 °C and solids concentration of 0.01 g L−1, the TOC:Z and TOC:CD:Z forms presented antioxidant activity (ORAC) of 106.2 and 46.2 μmol TEACper g particles, respectively. High correlation between experimental data and theoretical values predicted by the model were obtained (92%). The average particle size was shown to be between 1 and 9 μm. After accelerated aging studies, TOC:Z and TOC:CD:Z forms enabled less colour losses compared to the juice without the addition of the forms. Future studies need to be performed in order to optimize the development of TOC:CD:Z forms and further investigate the insights generated in this study. The information produced in this study will be useful for designing delivery systems containing active lipophilic components for applications in foods and beverages for improved quality.Acknowledgements
This study acknowledges Fundação para a Ciência e Tecnologia (FCT) through the doctoral fellowship (SFRH/BDE/51856/2012), R&D units iNOVA4Health – UID/Multi/04462/2013 and GreenIT – UID/Multi/04551/2013, programs financially supported by FCT/Ministério da Educação e Ciência, through national funds and co-funded by FEDER under the PT2020 Partnership Agreement.References
- L. Chen, G. E. Remondetto and M. Subirade, Trends Food Sci. Technol., 2006, 17, 272–283 CrossRef CAS.
- Z.-L. Wan, J. Guo and X.-Q. Yang, Food Funct., 2015, 6, 2876–2889 CAS.
- J. Lee, L. Ye, W. O. Landen Jr and R. R. Eitenmiller, J. Food Compos. Anal., 2000, 13, 45–57 CrossRef CAS.
- R. S. London, G. S. Sundaram, L. Murphy and P. J. Goldstein, J. Am. Coll. Nutr., 1983, 2, 115–122 CrossRef CAS PubMed.
- S. Marubayashi, K. Dohi, K. Ochi and T. Kawasaki, Surgery, 2016, 99, 184–192 Search PubMed.
- M. Kunisaki, S.-E. Bursell, F. Umeda, H. Nawata and G. L. King, BioFactors, 1998, 7, 55–67 CrossRef CAS PubMed.
- F. Andıran, A. Ayhan, F. C. Tanyel, O. Abbasoğlu and İ. Sayek, J. Surg. Res., 2000, 89, 184–188 CrossRef PubMed.
- K. Kailasapathy, in Advances in Food Biotechnology, ed. Ravishankar Rai V, John Wiley & Sons Ltd, Chichester, UK, 2015, pp. 311–334 Search PubMed.
- H. Chen and Q. Zhong, Food Hydrocolloids, 2015, 43, 593–602 CrossRef CAS.
- S.-H. Yoo, Y.-B. Song, P.-S. Chang and H. G. Lee, Int. J. Biol. Macromol., 2006, 38, 25–30 CrossRef CAS PubMed.
- M. L. Zambrano-Zaragoza, E. Mercado-Silva, A. Del Real L, E. Gutiérrez-Cortez, M. A. Cornejo-Villegas and D. Quintanar-Guerrero, Innovative Food Sci. Emerging Technol., 2014, 22, 188–196 CrossRef CAS.
- H. Chen and Q. Zhong, Food Hydrocolloids, 2014, 35, 358–366 CrossRef CAS.
- Y. Luo and Q. Wang, J. Appl. Polym. Sci., 2014, 131, 1–12 CrossRef.
- C. G. Drosou, M. K. Krokida and C. G. Biliaderis, Drying Technol., 2017, 35(2), 139–162 CrossRef CAS.
- G. W. Selling, A. Biswas, A. Patel, D. J. Walls, C. Dunlap and Y. Wei, Macromol. Chem. Phys., 2007, 208, 1002–1010 CrossRef CAS.
- A. Patel, Y. Hu, J. K. Tiwari and K. P. Velikov, Soft Matter, 2010, 6, 6192–6199 RSC.
- Y. Luo, Z. Teng and Q. Wang, J. Agric. Food Chem., 2012, 60, 836–843 CrossRef CAS PubMed.
- D. Hu, C. Lin, L. Liu, S. Li and Y. Zhao, J. Food Eng., 2012, 109, 545–552 CrossRef CAS.
- A. R. Patel, P. C. M. Heussen, J. Hazekamp, E. Drost and K. P. Velikov, Food Chem., 2012, 133, 423–429 CrossRef CAS PubMed.
- Y. Luo, B. Zhang, M. Whent, L. Yu and Q. Wang, Colloids Surf., B, 2011, 85, 145–152 CrossRef CAS PubMed.
- J. L. Koontz, J. E. Marcy, S. F. O'Keefe and S. E. Duncan, J. Agric. Food Chem., 2009, 57, 1162–1171 CrossRef CAS PubMed.
- A. R. Patel and K. P. Velikov, Curr. Opin. Colloid Interface Sci., 2014, 19, 450–458 CrossRef CAS.
- A. K. Chatjigakis, C. Donze, A. W. Coleman and P. Cardot, Anal. Chem., 1992, 64, 1632–1634 CrossRef CAS.
- T. Lundstedt, E. Seifert, L. Abramo, B. Thelin, Å. Nyström, J. Pettersen and R. Bergman, Chemom. Intell. Lab. Syst., 1998, 42, 3–40 CrossRef CAS.
- M. C. Regier, J. D. Taylor, T. Borcyk, Y. Yang and A. K. Pannier, J. Nanobiotechnol., 2012, 10, 44 CrossRef CAS PubMed.
- D. Huang, B. Ou, M. Hampsch-Woodill, J. A. Flanagan and R. L. Prior, J. Agric. Food Chem., 2002, 50, 4437–4444 CrossRef CAS PubMed.
- R. Feliciano, M. Bravo, M. Pires, A. Serra, C. Duarte, L. Boas and M. Bronze, Food Anal. Methods, 2009, 2, 149–161 CrossRef.
- B. W. Bolling, Y.-Y. Chen, A. G. Kamil and C.-Y. O. Chen, J. Food Sci., 2012, 77, H69–H75 CrossRef CAS PubMed.
- M. C. Gacula Jr, Statistical methods in food and consumer research, Elsevier, 2013 Search PubMed.
- P. D. Haaland, Experimental design in biotechnology, CRC press, 1989, vol. 105 Search PubMed.
- Y. Sambuy, I. De Angelis, G. Ranaldi, M. L. Scarino, A. Stammati and F. Zucco, Cell Biol. Toxicol., 2005, 21, 1–26 CrossRef CAS PubMed.
- G. Manda, A. M. Mocanu, E. D. Marin and I. Taranu, Toxins, 2015, 7, 593–603 CrossRef CAS PubMed.
- G. Cano-Sancho, C. A. González-Arias, A. J. Ramos, V. Sanchis and M. L. Fernández-Cruz, Toxicol. In Vitro, 2015, 29, 1639–1646 CrossRef CAS PubMed.
- A. T. Serra, A. A. Matias, R. F. M. Frade, R. O. Duarte, R. P. Feliciano, M. R. Bronze, M. E. Figueira, A. de Carvalho and C. M. M. Duarte, J. Funct. Foods, 2010, 2, 46–53 CrossRef.
- R. Cassano, T. Ferrarelli, A. G. Schätzlein, I. F. Uchegbu and S. Trombino, Eur. J. Pharm. Biopharm., 2013, 84, 540–548 CrossRef CAS PubMed.
- V. Rocha, C. Marques, J. L. Figueiredo, A. R. Gaio, P. C. Costa, J. M. S. Lobo and I. F. Almeida, Food Chem. Toxicol., 2017, 103, 214–222 CrossRef CAS PubMed.
- T. Mosmann and J. Immunol, Methods, 1983, 65, 55–63 CAS.
- International Organization for Standardization, Colorimetry – Part 4: CIE 1976 L*a*b* Colour Space, 2008 Search PubMed.
- G. Davidov-Pardo, I. Arozarena and M. R. Marín-Arroyo, Food Bioprocess Technol., 2013, 6, 941–951 CrossRef CAS.
- R. Murugesan and V. Orsat, Food Bioprocess Technol., 2012, 5, 3–14 CrossRef.
- S. Quispe-Condori, M. D. a. Saldaña and F. Temelli, LWT-Food Sci. Technol., 2011, 44, 1880–1887 CrossRef CAS.
- F. Xue, C. Li, Y. Liu, X. Zhu, S. Pan and L. Wang, J. Food Eng., 2013, 119, 439–445 CrossRef CAS.
- Q. Zhong, M. Jin, P. M. Davidson and S. Zivanovic, Food Chem., 2009, 115, 697–700 CrossRef CAS.
- F. Gandía-Herrero, M. Jiménez-Atiénzar, J. Cabanes, F. García-Carmona and J. Escribano, J. Agric. Food Chem., 2010, 58, 10646–10652 CrossRef PubMed.
- J. Gomez-Estaca, M. P. Balaguer, R. Gavara and P. Hernandez-Munoz, Food Hydrocolloids, 2012, 28, 82–91 CrossRef CAS.
- L. Wang, D. A. Schiraldi and M. Sánchez-Soto, Ind. Eng. Chem. Res., 2014, 53, 7680–7687 CrossRef CAS.
- V. Paşcalău, V. Popescu, G. L. Popescu, M. C. Dudescu, G. Borodi, A. Dinescu, I. Perhaiţa and M. Paul, J. Alloys Compd., 2012, 536, S418–S423 CrossRef.
- A. A. Shamsuri, D. D. Abdullah and R. Daik, Cellul. Chem. Technol., 2012, 46, 45–52 CAS.
- W. Liu, X. Yan, J. Chen, Y. Feng and Q. Xue, Nanoscale, 2013, 5, 6053–6062 RSC.
- K. J. Payne and A. Veis, Biopolymers, 1988, 27, 1749–1760 CrossRef CAS PubMed.
- D. J. Sessa and K. K. Woods, J. Am. Oil Chem. Soc., 2011, 88, 1037–1043 CrossRef CAS.
- S. Songkro, N. Hayook, J. Jaisawang, D. Maneenuan, T. Chuchome and N. Kaewnopparat, J. Inclusion Phenom. Macrocyclic Chem., 2012, 72, 339–355 CrossRef CAS.
- F. L. Aachmann, D. E. Otzen, K. L. Larsen and R. Wimmer, Protein Eng., Des. Sel., 2003, 16, 905–912 CrossRef CAS PubMed.
- F. Kayaci and T. Uyar, Carbohydr. Polym., 2012, 90, 558–568 CrossRef CAS PubMed.
- T. Uyar, A. Balan, L. Toppare and F. Besenbacher, Polymer, 2009, 50, 475–480 CrossRef CAS.
- S. K. Pankaj, C. Bueno-Ferrer, N. N. Misra, L. O'Neill, A. Jiménez, P. Bourke and P. J. Cullen, Innovative Food Sci. Emerging Technol., 2014, 21, 107–113 CrossRef.
- A. Fernandez, S. Torres-Giner and J. M. Lagaron, Food Hydrocolloids, 2009, 23, 1427–1432 CrossRef CAS.
- C. Yao, X. Li, T. Song, Y. Li and Y. Pu, Polym. Int., 2009, 58, 396–402 CrossRef CAS.
- Y. Sambruy, S. Ferruzza, G. Ranaldi and I. De Angelis, in Cell Culture Methods for In Vitro Toxicology, Springer, 2001, pp. 97–113 Search PubMed.
- J. Martins, Ó. Ramos, A. Pinheiro, A. Bourbon, H. Silva, M. Rivera, M. Cerqueira, L. Pastrana, F. X. Malcata, Á. González-Fernández and A. Vicente, Food Eng. Rev., 2015, 1–23 Search PubMed.
- F. Gómez-Galván, L. Pérez-Álvarez, J. Matas, A. Álvarez-Bautista, J. Poejo, C. M. Duarte, L. Ruiz-Rubio, J. L. Vila-Vilela and L. M. León, Carbohydr. Polym., 2016, 142, 149–157 CrossRef PubMed.
- P. Tang, S. Li, L. Wang, H. Yang, J. Yan and H. Li, Carbohydr. Polym., 2015, 131, 297–305 CrossRef CAS PubMed.
- W. B. Corp, FDA, JECFA SCF.
- J. M. Obon, M. R. Castellar, M. Alacid and J. A. Fernandez-Lopez, J. Food Eng., 2009, 90, 471–479 CrossRef.
- Y. Watanabe, K. Yoshimoto, Y. Okada and M. Nomura, LWT-Food Sci. Technol., 2011, 44, 891–895 CrossRef CAS.
Footnote |
| † Electronic supplementary information (ESI) available. See DOI: 10.1039/c6ra25946d |
| This journal is © The Royal Society of Chemistry 2017 |