 Open Access Article
Creative Commons Attribution 3.0 Unported Licence
Preparation and characterization of mesostructured cellular foam silica supported Cu–Ce mixed oxide catalysts for CO oxidation
Zhimin Luo,
Dongsen Mao *,
Weiwei Shen,
Yuling Zheng and
Jun Yu
Research Institute of Applied Catalysis, School of Chemical and Environmental Engineering, Shanghai Institute of Technology, Shanghai 201418, PR China. E-mail: dsmao@sit.edu.cn
First published on 3rd February 2017
Abstract
In this paper, a series of mesostructured cellular foam (MCF) silica supported CuO–CeO2 catalysts (CuO–CeO2/MCF) with various total metal loadings (10–40 wt%) and various Cu/Ce ratios (Cu/Ce = 1/9, 2/8, and 3/7 wt/wt) were prepared by using a co-impregnation method. Their physicochemical properties and catalytic activity were investigated by various techniques including XRD, TEM, N2 adsorption–desorption, Raman, XPS, H2-TPR, CO-TPD, and a low-temperature CO oxidation reaction test. The results show that the catalyst with a bimetallic loading of 30 wt% and Cu/Ce ratio of 2![[thin space (1/6-em)]](https://www.rsc.org/images/entities/char_2009.gif) :
:![[thin space (1/6-em)]](https://www.rsc.org/images/entities/char_2009.gif) 8 (wt/wt) has the highest catalytic activity, which can be attributed to the largest amount of finely dispersed Cu species strongly interacting with CeO2, the highest concentrations of oxygen vacancies and active lattice oxygen, and the largest amount of Cu+ (the better CO adsorption sites).
8 (wt/wt) has the highest catalytic activity, which can be attributed to the largest amount of finely dispersed Cu species strongly interacting with CeO2, the highest concentrations of oxygen vacancies and active lattice oxygen, and the largest amount of Cu+ (the better CO adsorption sites).
1. Introduction
The catalytic oxidation of CO is a very important reaction for many applications, such as CO removal from vehicle exhausts, CO2 laser exhaust abatement, and CO preferential oxidation for proton exchange membrane fuel cells.1 Noble metal catalysts, such as Au, Pt, and Pd exhibit superior activity for CO oxidation, but their sensitivity to sulfur poisoning and the high cost limit their practical applications.2 Therefore, more and more attention has recently been paid to base metal catalysts in order to find an alternative catalytic component to reduce using or even replace noble metals.3 Among them, CuO–CeO2 has excellent catalytic performance for CO oxidation, which is comparable with or even higher than that on noble metals like Pt.4 The excellent activity of CuO–CeO2 for CO oxidation has been essentially attributed to the synergistic redox properties produced upon the formation of CuO–CeO2 interfacial sites, which are considered to be the active sites for the CO oxidation reaction.5,6In this context, extending the interfacial boundary area between CuO and CeO2 should greatly enhance the activity for CO oxidation.7–9 For application purposes, dispersing CuO and CeO2 on a large area support could be a feasible alternative, which not only extends the interfacial boundary area but also reduces the usage of these oxides.7 For example, Araya and co-workers10 studied the activity of CuO–CeO2 catalysts supported on Al2O3, SiO2, and ZrO2, and found that CuO–CeO2 supported on SiO2 displays the best activity for CO oxidation, which is due to the fact that the inert characteristic of SiO2 facilitates the formation of CuO–CeO2 interfacial sites on its surface.8 Furthermore, Luo et al.11 investigated the influence of carrier porosity on the activity of SiO2 supported CuO–CeO2 catalyst and found that higher catalytic activity was observed in the CuO–CeO2 catalyst supported on silica carrier with larger surface area and pore diameter, which is due to a higher dispersion of CuO particles and stronger synergistic interaction between CuO and CeO2.
Owing to their high specific surface area, pore volume, and precisely controllable pore size, ordered mesoporous silicas, such as MCM-41, MCM-48, SBA-15, and KIT-6, have proven to be excellent supports for numerous catalytically active species. However, there have been only limited reports on the utilization of ordered mesoporous silicas as supports of Cu-based catalysts for CO oxidation so far.12–15 On the other hand, siliceous mesostructured cellular foam (MCF) is a relatively new mesoporous silica material, which features a well-defined 3-dimensional (3D) mesoporosity with large pores (up to 40 nm).16,17 The latter characteristics should allow a better transportation of reactants and products in the mesoporous network in case of partial pore blocking, thus resulting in the excellent catalytic performance.18–20 For example, Piumetti et al.18 studied the activity of Rh catalysts supported on mesoporous silica (MCM-41, SBA-15, KIT-6, and MCF), and found that Rh supported on MCF displayed the best N2O decomposition activity, which is due to the senior pore structure of MCF. However, CuO–CeO2 supported on MCF for CO oxidation has not been reported to date, to the best of our knowledge.
In this work, a series of supported CuO–CeO2/MCF catalysts with various total metal loadings (10–40 wt%) and various Cu/Ce ratios (Cu/Ce = 1/9, 2/8, and 3/7 wt/wt) were prepared by using co-impregnation method. The effects of total metal loading and Cu/Ce ratio on the catalytic performance of the CuO–CeO2/MCF catalysts for CO oxidation were investigated. The prepared catalysts were characterized extensively by XRD, N2 adsorption–desorption, TEM, Raman, XPS, H2-TPR, and CO-TPD techniques. Furthermore, the catalytic performances of the catalysts were discussed in relation to the results of physicochemical characterization.
2. Experimental
2.1 Catalyst preparation
The MCF support was synthesized according to the literature procedure.16,17 Briefly, 4.0 g of pluronic P123 (Sigma-Aldrich) was dissolved in 150 mL of 1.6 M hydrochloric acid (performed with 36–38% HCl, General-Reagent) solution and 3.0 g of 1,3,5-trimethylbenzene (TMB, 99%, Damas-Beta) was added. After stirring at room temperature for 1 h, 8.5 g of tetraethyl orthosilicate (TEOS, 98%, General-Reagent) was added and then stirred at 48 °C for 24 h. The mixture was transferred to a Teflon-lined stainless steel autoclave and heated at 110 °C for 24 h. The precipitate product was filtered, washed with distilled water, dried at 110 °C overnight and calcined in air at 600 °C for 8 h (ramp of 1 °C min−1).The catalysts were prepared by impregnating the MCF support with an aqueous solution containing Ce(NO3)3·6H2O (99%, General-Reagent) and Cu(NO3)2·3H2O (99%, Sinopharm Chemical Reagent Co., Ltd (China)). These catalysts were dried at 110 °C for 12 h, and then calcined in air at 500 °C for 4 h (ramp of 1 °C min−1).
2.2 Catalyst characterization
The crystal structure of mesoporous silica supported Cu–Ce catalysts were determined on a Rigaku Uitima IV diffraction meter using Cu Kα radiation (λ = 0.15406 nm) at 2θ = 10–80°. The average crystalline size was determined from XRD line broadening measurement using the Scherrer equation. The lattice parameter was obtained from the CeO2(111) plane and calculated by Bragg's law:2d![[thin space (1/6-em)]](https://www.rsc.org/images/entities/char_2009.gif) sin sin![[thin space (1/6-em)]](https://www.rsc.org/images/entities/char_2009.gif) θ = nλ θ = nλ |
where d, θ, n, λ and, a represent interplanar spacing, diffraction half angle, series of diffraction, the wavelength of the target for XRD, and lattice parameter, respectively; H, K and L represent plane indices.
Nitrogen sorption isotherms were measured at −196 °C using a Micrometrics ASAP-2020 system. Before measurement, all samples were degassed for 10 h at 200 °C. The specific surface areas (SBET) were calculated from the linear part of the BET plot. The MCFs possess ink-bottle-type pores in which large cells are connected by narrower windows. The cell and window sizes were obtained from the adsorption and desorption branches, respectively.16,17
Transmission electron microscopy (TEM) experiments were performed on a TECNAI instrument at an acceleration voltage of 200 kV.
Raman measurement (at 4 cm−1 resolution) was carried out on a DXR-Raman microscope (Thermo Fisher Scientific, American) using the 532 nm exciting line (20 mW beam), 5 scans for every spectrum.
The X-ray photoelectron spectra (XPS) were obtained on a Kratos Axis Ultra DLD spectrometer, using Al Kα radiation. The XPS data from the regions related to the O 1s, Ce 3d, and Cu 2p core levels were recorded for each sample. All the binding energy (B.E.) values were referenced to the C 1s peak at 284.6 eV.
H2 temperature-programmed reduction (H2-TPR) measurement was carried out in a quartz micro-reactor. Before reduction, the samples were pre-treated in N2 stream at 400 °C for 1 h and then cooled to room temperature (RT). After that, the sample was heated to 500 °C under a flow of H2 (10 vol%)/N2 (50 mL min−1) at a rate of 10 °C min−1. The effluent gas was analyzed by an on-line gas chromatography (FULI, GC 9750) equipped with a thermal conductivity detector (TCD).
The CO adsorption properties were measured by temperature-programmed desorption of CO (CO-TPD). The samples were pre-treated in He (50 mL min−1) stream at 500 °C for 1 h and then cooled to RT. The next step was CO adsorption at 30 °C for 0.5 h, and then the sample was swept again with He for 3 h. After that, the sample was heated in flowing He (50 mL min−1) up to 500 °C at a rate of 10 °C min−1. The analysis of the effluent gases was carried out with a quadrupole mass spectrometer (QMS, Balzers Omni Star 200).
2.3 Catalytic activity tests
The activities of the catalysts in CO oxidation reaction were measured in a flow, fixed-bed micro-reactor (i.d. = 6 mm) at atmospheric pressure. The catalyst temperature was measured with a K-type thermocouple inserted in the middle of the catalyst bed. The reaction gas composition is 1.0 vol% CO, 2.5 vol% O2, and 96.5 vol% N2 at a space velocity of 36![[thin space (1/6-em)]](https://www.rsc.org/images/entities/char_2009.gif) 000 mL gcat−1 h−1.
000 mL gcat−1 h−1.
A 100 mg catalyst was used for each measurement. Prior to the measurements, the samples were pre-treated in a N2 stream (60 mL min−1) at 300 °C for 1 h to remove impurities, and then cooled to RT. The gas composition after the reaction was analyzed by an on-line gas chromatography (RAMIIN, GC 2060) with a flame ionization detector (FID), connected with a computer integrator system. To allow detection of CO and CO2 with FID a methanator was inserted between one column and the FID. The CO conversion (XCO) was calculated as follows:
| XCO (%) = 100 × ([CO]in − [CO]out)/[CO]in |
3. Results and discussion
Experiments were performed to investigate the Cu and Ce loadings that optimize the CuO–CeO2/MCF catalyst for CO oxidation reaction. First, the influence of the total loading for a constant Cu/Ce ratio of 2![[thin space (1/6-em)]](https://www.rsc.org/images/entities/char_2009.gif) :
:![[thin space (1/6-em)]](https://www.rsc.org/images/entities/char_2009.gif) 8 (wt/wt) was investigated. Then, the previous optimum total metal loading (30 wt%) was kept constant, and the Cu/Ce ratio was changed.
8 (wt/wt) was investigated. Then, the previous optimum total metal loading (30 wt%) was kept constant, and the Cu/Ce ratio was changed.
3.1 Effect of the total metal loading
For this study, a series of catalysts with a constant Cu/Ce ratio of 2![[thin space (1/6-em)]](https://www.rsc.org/images/entities/char_2009.gif) :
:![[thin space (1/6-em)]](https://www.rsc.org/images/entities/char_2009.gif) 8 (wt/wt) but with different total metal loadings (10–40 wt%) were prepared. These catalysts were denoted as x-CCM-2/8, where x represented the weight percentage of total loading of Cu and Ce relative to support MCF.
8 (wt/wt) but with different total metal loadings (10–40 wt%) were prepared. These catalysts were denoted as x-CCM-2/8, where x represented the weight percentage of total loading of Cu and Ce relative to support MCF.
| Sample | DCeO2a (nm) | Cell parametera (nm) | Dcb (nm) | Dwc (nm) | SBET (m2 g−1) | Vpd (cm3 g−1) |
|---|---|---|---|---|---|---|
| a From line broadening of CeO2 (111) peak in XRD, cell parameter calculated by Bragg's law.b Cell diameter determined from N2 adsorption data.c Window diameter determined from N2 desorption data.d Pore volume determined by N2 desorption data. | ||||||
| MCF | — | — | 29.6 | 12.5 | 496 | 2.07 |
| Ce/MCF | 6.9 | 0.5401 | — | — | — | — |
| 10-CCM-2/8 | 4.6 | 0.5394 | 20.3 | 10.7 | 414 | 1.16 |
| 20-CCM-2/8 | 5.8 | 0.5394 | 20.9 | 10.5 | 384 | 1.05 |
| 30-CCM-2/8 | 5.9 | 0.5387 | 20.5 | 10.4 | 334 | 0.98 |
| 40-CCM-2/8 | 6.2 | 0.5374 | 20.4 | 10.2 | 302 | 0.80 |
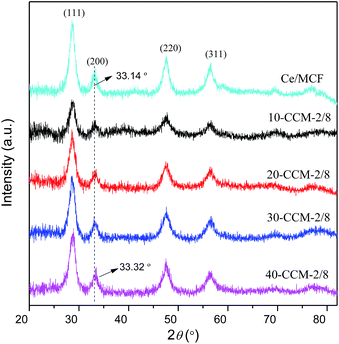
Detailed analysis of line broadening by Sherrer equation provided the crystallite sizes of CeO2 in the samples and the results are also presented in Table 1. It can be seen that the crystal size of CeO2 in 30-CCM-2/8 is smaller than that in Ce/MCF, although the two samples contain the same content of Ce. This result suggests that the addition of CuO can inhibit the growth of CeO2 crystals during the calcination process.27–29 On the other hand, the crystal size of CeO2 enlarged slightly with the increase in metal loading from 10 to 40 wt%, which is connected with excessive Ce species aggregation on the surface of MCF.
In order to obtain the morphology and structure of the CuO–CeO2/MCF catalysts, TEM measurements were carried out on the representative 10-CCM-2/8 and 40-CCM-2/8. TEM images of the 10-CCM-2/8 sample (Fig. 2C and E) indicate the cellular foams structure, typical of MCF's.19,30,31 From the micrographs of 40-CCM-2/8 (Fig. 2D and F), however, there are no significant characteristic structural features of the MCF material, which is connected with excessive metallic species aggregation on the surface of MCF. On the other hand, it is clear from Fig. 2A and B that the crystal size of CeO2 (the fringe of 0.32 nm is characteristic of the (111) plane of CeO2) enlarged with the increase in metal contents from 10 wt% (4–5 nm) to 40 wt% (6–7 nm), which is consistent with the result obtained by XRD analysis as shown in Table 1.
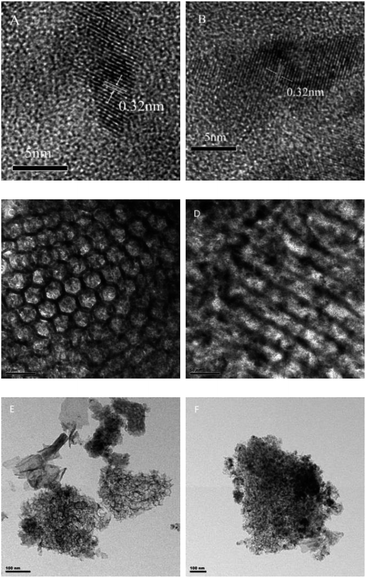 | ||
| Fig. 2 TEM images of 10-CCM-2/8 ((A) 5 nm, (C) 50 nm, and (E) 100 nm), and 40-CCM-2/8 ((B) 5 nm, (D) 50 nm, and (F) 100 nm). | ||
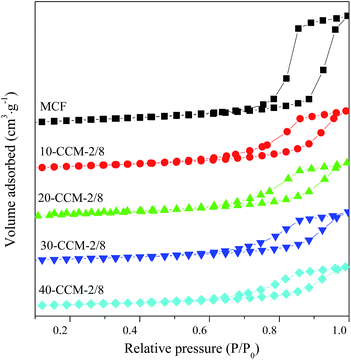
The textural properties of the MCF support and CuO–CeO2/MCF catalysts were investigated by N2-adsorption analysis. It can be seen from Fig. 3 that all the samples displayed type IV isotherms and showed type H1 hysteresis loop at high pressures, which is typical for mesoporous materials according to IUPAC classification.32 The isotherms of CuO–CeO2/MCF catalysts showed a sharp jump at p/p0 = 0.6–1.0, lower than that for pure MCF at p/p0 = 0.7–1.0; and the shapes of the loop of the CuO–CeO2/MCF catalysts are slightly different from that of the pure MCF. These results indicate that the pore size of the MCF support decreased after loading with Cu and Ce species, and a part of the supported species have entered into the MCF channels.33–35 The BET surface area, pore volume, and pore size of all the samples are presented in Table 1. Apparently, the incorporation of Cu and Ce had significant impacts on the textural properties of the MCF support, as notable decreases in BET surface area, pore volume and pore size, confirming that parts of the Cu and Ce species added had entered into the pore system successfully.33–35
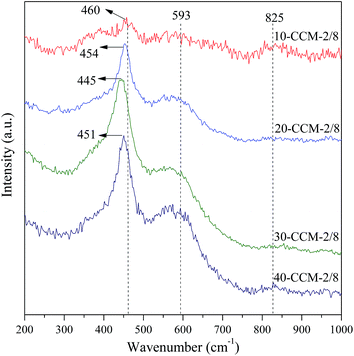
Raman analysis can provide direct evidence of oxygen vacancies and defects owing to changes in the vibrational structure of the CeO2 lattice.36 The Raman spectra of the different catalysts are shown in Fig. 4. As seen, all the samples exhibit a strong vibration band at ∼460 cm−1, corresponding to the F2g Raman vibration mode of fluorite CeO2.37 On the other hand, the weak band at 825 cm−1 can be assigned to the symmetrical Si–O–Si stretching mode,38 while the broad band at about 590 cm−1 is often related to the presence of oxygen vacancies in the CeO2 lattice.39 The relative concentration of oxygen vacancies on different catalysts is usually calculated from the area ratio of peaks at ∼590 and ∼460 cm−1 (A590/A460).25 However, the intensity of the peak at ∼590 cm−1 is influenced by Si–O–Si bending vibrations within inter-tetrahedral linkages at between 600 and 700 cm−1,40 and the degree of the influence is changed with the increasing of Ce content. So, it is impractical to obtain the relative concentration of oxygen vacancies on different catalysts from A590/A460. Nevertheless, it is worth noticing that an evident red shift and broadening of the F2g band (Fig. 4) with the increasing of Cu and Ce loading. According to literature,22,37,41 this phenomenon is also considered to be an evidence of copper that have been incorporated into the CeO2 crystal lattice and the oxygen vacancies generated. More specifically, for 10-CCM-2/8, 20-CCM-2/8, and 30-CCM-2/8, the peak of the F2g band are at 460 cm−1, 454 cm−1, and 445 cm−1, respectively. It also can be seen that the width and strength of the band increased gradually with the metal loading. However, when the total loadings of Cu and Ce are higher than 30 wt%, the peak is shifted from 445 cm−1 for 30-CCM-2/8 to 451 cm−1 for 40-CCM-2/8, and the band width decreased slightly. These results suggest that the 30-CCM-2/8 catalyst has the largest amount of oxygen vacancies among the investigated CuO–CeO2/MCF catalysts.42
In order to examine the surface composition and the chemical state of the elements present in the CuO–CeO2/MCF catalysts, the XPS measurements were performed. As shown in Table 2, it can be seen that the surface concentrations of copper and cerium are much lower than the nominal values, which is supposed to be related to pore confined effect.33,43 Due to the limited detection depth of photoelectron (<2 nm), the Cu and Ce species located in the mesopores may not be detected with the shielding of silica skeleton. Therefore, the signal is only partially collected.29
| Sample | Cua (wt%) | Cea (wt%) | Ce(III) | Isat/Imain (%) | Cu+ | ||
|---|---|---|---|---|---|---|---|
| Rb (%) | Ac (μmol g−1) | Rd (%) | Ae (μmol g−1) | ||||
| a The data in parenthesis represent nominal bulk compositions.b Relative content as expressed by the intensity of the Ce3+ peak as a percentage of the total Ce 3d area.c Actual content calculated from the relative content of Ce3+ and the total content of Ce.d Relative content as expressed by the intensity of the Cu+ peak as a percentage of the total Cu 2p3/2 area.e Actual content calculated from the relative content of Cu+ and the total content of Cu. | |||||||
| 10-CCM-2/8 | 0.9(2) | 2.4(8) | 19.9 | 34.1 | 52.0 | 16.3 | 22.9 |
| 20-CCM-2/8 | 1.2(4) | 3.5(16) | 19.5 | 48.7 | 53.7 | 16.1 | 30.1 |
| 30-CCM-2/8 | 1.4(6) | 4.5(24) | 19.1 | 61.4 | 53.6 | 15.8 | 34.6 |
| 40-CCM-2/8 | 1.5(8) | 5.1(32) | 16.2 | 58.9 | 59.2 | 12.9 | 30.3 |
| 30-CCM-1/9 | 1.0(3) | 5.2(27) | 15.6 | 57.8 | 51.2 | 18.3 | 28.6 |
| 30-CCM-3/7 | 1.8(9) | 4.2(21) | 15.2 | 45.6 | 59.3 | 11.2 | 31.5 |
The O 1s, Ce 3d, and Cu 2p3/2 XPS spectra of the CuO–CeO2/MCF catalysts are shown in Fig. 5(A–C). For O 1s spectra (Fig. 5A), it can be seen that two O 1s peaks are included in CuO–CeO2/MCF catalysts, the main peak at higher binding energy (532.3 eV) attributed to –OH and the shoulder peak at 528.9 eV to characteristic lattice oxygen of metal oxides.44
The Ce 3d XPS data obtained from different CuO–CeO2/MCF catalysts are shown in Fig. 5B. The nonlinear curve-fitting process is performed by using Xpspeak41 software package and the assignments are defined. The complex Ce 3d spectra are composed of eight peaks with the assignment defined in Fig. 5B, which are attributed to four pairs of spin–orbit doublets. Letters u and v refer to the 3d3/2 and 3d5/2 spin–obit components, respectively. It is implied that the chemical valence of cerium on the surface of theses samples was mainly in +4 state (u, u′′, u′′′ and v, v′′, v′′′), and a small amount of Ce3+ (u′, v′) co-exists.45 The presence of Ce3+ is believed to be related to the formation of oxygen vacancies, which can improve catalytic performance in the CO oxidation reaction.46,47 The relative amount of Ce3+ presented on the catalyst surface can be determined by calculating the ratio of area under the peaks of u′ and v′ to the total area according to the literature,48 and the results are listed in Table 2. The Ce(III)% values of the 10-CCM-2/8, 20-CCM-2/8 and 30-CCM-2/8 catalysts are similar, and larger than that of the 40-CCM-2/8 catalyst, indicating that the former three catalysts have a stronger interaction between CuO and CeO2 than the last one.
Furthermore, the actual amount of Ce(III) from different CuO–CeO2/MCF catalysts had been calculated, and the results are also listed in Table 2. Clearly, the 30-CCM-2/8 catalyst has the largest amount of Ce(III) among the investigated CuO–CeO2/MCF catalysts, indicating that the amount of oxygen vacancies on the 30-CCM-2/8 catalyst is larger than those of the other catalysts.49 The result is consistent with that obtained by the above Raman study.
As shown in Fig. 5C, there are two sets of peaks for all the samples, corresponding to Cu 2p3/2. According to literature,50 the strong peak centred at 933.4 eV and the weak satellite peaks located at 938–946 eV are characteristics of Cu2+ and a weaker peak centred at 931.9 eV is identified as the reduced copper species (Cu+ or Cu0). On the other hand, the presence of reduced copper species can be manifested in the intensity ratios of the main peaks and the satellite peaks. As shown in Table 2, it can be seen that the Isat/Imain values of all the catalysts are lower than that of the pure Cu2+ species (62%), further confirming that there are reduced Cu species present on the samples. The formation of the reduced copper species may result from strong interaction of CuO with the support.51 It is well known that the Cu 2p XPS spectrum cannot be used to distinguish between Cu+ and Cu0, because the corresponding peaks are essentially identical. However, Li et al.52 suggests that the presence of Cu+ instead of Cu0 is most possible in catalyst prepared by calcination in air for Cu–Ce catalyst. On the other hand, many researchers attributed the weak peak centred at ∼931.9 eV to the presence of Cu+ species.53–56 Based on these results, it can be inferred that the reduced Cu species present on the CuO–CeO2/MCF catalysts is Cu+. Thus, the relative percentages of Cu+ species are quantified based on the area of their XPS peaks and the results are shown in Table 2. It can be noted that the 10-CCM-2/8, 20-CCM-2/8, and 30-CCM-2/8 catalysts have the similar percentages of Cu+ and they are higher than that on the 40-CCM-2/8 catalyst, indicating that the 40-CCM-2/8 catalyst has a weaker interaction between CuO and CeO2 than other catalysts.57 Furthermore, the actual amount of Cu+ of different CuO–CeO2/MCF catalysts had been calculated, and the results are listed in Table 2. It can be seen that the actual amount of Cu+ first increases with the increase in metal loading, then decreases, with a maximum at 30 wt%.
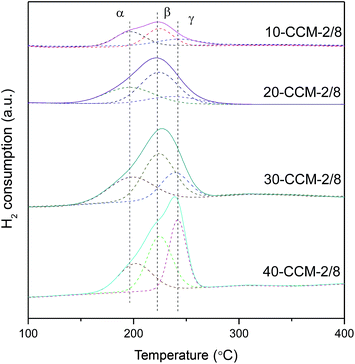
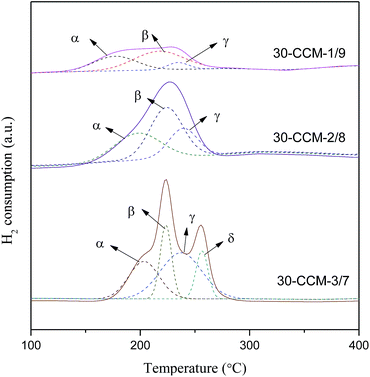
In order to investigate the reduction behavior of this series of CuO–CeO2/MCF catalysts, H2-TPR measurements were carried out and the results are given in Fig. 6. As noted, all the samples exhibit a broad peak of H2 consumption in the range of 150–260 °C, which is lower than the reduction temperature of pure CuO (280 °C).21,58 This result means that CeO2 or MCF support can enhance the reducibility of Cu species. A qualitative attribution of the TPR peaks to different CuO species over the CuO–CeO2/SiO2 catalysts has been proposed by many researchers. For example, Araya and co-workers10 reported two reductive peaks, which are attributed to the reduction of small CuO clusters with and without interaction with CeO2, respectively. In another paper,8 the same authors reported three reductive peaks, and the first one can be attributed to small, highly dispersed Cu particles in contact with ceria; the second one is assigned to the bigger CuO particles in contact with ceria, and the third one is attributed to the reduction of the agglomerated CuO that is not in contact with CeO2. Tang et al.33 reported that three reductive peaks are responsible for reduction of copper species on CuO–CeO2/SBA-15, and the third reduction peak reflects the reduction of CuO on SBA-15. According to these literatures and the above XRD results, the α, β, and γ peaks can be attributed to small, highly dispersed CuO particles in contact with ceria, the bigger CuO particles in contact with ceria, and highly dispersed copper species on MCF, respectively. To further reveal the quantitative aspect of copper species on the CuO–CeO2/MCF catalysts, the peak positions and the areas of α, β, and γ peaks are summarized in Table 3. It can be clearly seen that with the increasing of metal loading from 10 to 30 wt%, both the areas of α and β peaks increases noticeably, indicating that the number of CuO particles in contact with ceria increases continuously. However, when the metal loading is higher than 30 wt%, the areas of these peaks decrease evidently, which indicates the formation of more CuO species without interaction with CeO2. Therefore, the area of the γ peak increases significantly.
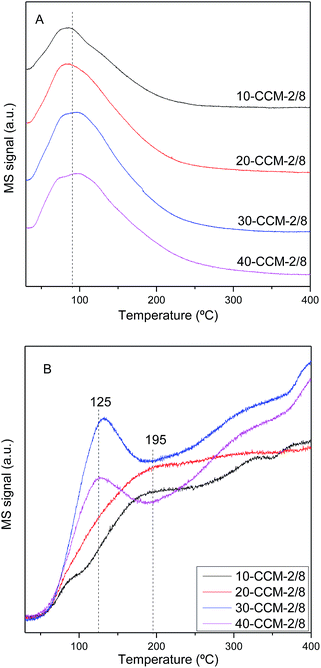
Fig. 7 gives the CO-TPD patterns of the investigated catalysts. It can be seen that there is one broad CO desorption peak at 30–200 °C (Fig. 7A) and one weak and broad CO2 desorption peak at 50–300 °C (Fig. 7B), which can be due to different CO adsorption approaches: a fraction of CO probably reacts with CeO2 surface and adsorbs as carbonate, and desorbs as CO2 at lower temperatures (50–150 °C); another fraction of the CO probably develops into bidentate carbonate on the reactive sites, and desorbs as CO2 at higher temperatures (150–300 °C).22,28,41,59
It is evident that the intensity of CO and CO2 desorption peaks increases with the increase of metal loading from 10 to 30 wt%. However, further increase in metal loading higher than 30 wt% results in the decrease in the intensity of the two desorption peaks. On the other hand, the temperature (Tmax) of the maximum of CO2 desorption peak decreases from 195 °C for the 10-CCM-2/8 and 20-CCM-2/8 to 125 °C for the 30-CCM-2/8 and 40-CCM-2/8, suggesting that the produced carbonate species can desorb more easily on the latter two catalysts. These results indicate that the 30-CCM-2/8 catalyst has the largest amount of active sites for CO adsorption and reaction,22,28,41 which is in good agreement with the above Raman and TPR results.
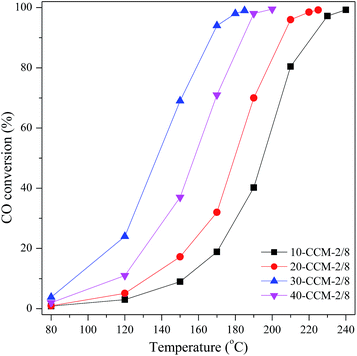
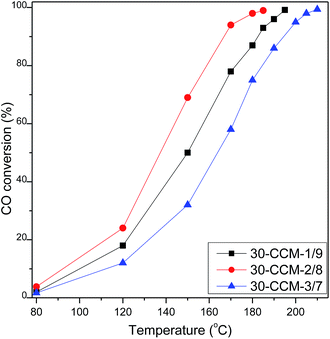
So far, substantial investigations on CO oxidation reaction over CuO–CeO2 catalysts have been made and it has been well documented that there are many factors that can affect the activity of the CuO–CeO2 catalyst for CO oxidation.41 Gamarra et al.60 claimed that active sites for CO oxidation reaction are related to interfacial copper oxide, which is closely contacted with ceria by spectroscopic analysis under reaction conditions of catalysts. These structural features of the Cu species are easily to be reduced to Cu+ during the course of interaction with reactant mixtures, and the Cu+ acted as a mainly adsorption and oxidation sits for CO.61,62 The above TPR result suggests that there are larger amounts of well-dispersed Cu species strongly interacting with CeO2 on the 30-CCM-2/8 catalyst than on the other catalysts. In addition, the XPS result indicates that the 30-CCM-2/8 catalyst has the largest amount of reduced copper species (Cu+) among the investigated CuO–CeO2/MCF catalysts. These structural features of the Cu species on the 30-CCM-2/8 catalyst were responsible for its highest activity.
On the other hand, the larger amounts of lattice oxygen and oxygen vacancy will be advantageous to the oxidation of CO.22,28,41,63 Li et al.63 reported that the oxidation of CO on metal oxides conforms to the following mechanism: (1) CO + Olat → CO2 + Ovac, (2) O2 + 2Ovac → 2Olat, where the Olat and Ovac represent lattice oxygen and oxygen vacancy, respectively. The above CO-TPD result suggests that the 30-CCM-2/8 sample possesses the largest amount of active lattice oxygen. In addition, the Raman and XPS results indicate that there are larger amounts of oxygen vacancy on the 30-CCM-2/8 catalyst than on the other ones. Obviously, the largest amounts of active lattice oxygen and oxygen vacancy of the 30-CCM-2/8 catalyst are responsible for its highest activity. Similar results were also reported by us previously22,28,41 and other researchers.63
3.2 Effect of Cu/Ce ratio
For the catalysts with a fixed total metal (Cu + Ce) loading, increasing the Cu loading means decreasing the Ce loading, and it will affect the concentration of the active Cu–Ce interface, thus affecting the catalytic activity.8 Experiments were therefore carried out by varying the Cu/Ce ratio from 1![[thin space (1/6-em)]](https://www.rsc.org/images/entities/char_2009.gif) :
:![[thin space (1/6-em)]](https://www.rsc.org/images/entities/char_2009.gif) 9 to 3
9 to 3![[thin space (1/6-em)]](https://www.rsc.org/images/entities/char_2009.gif) :
:![[thin space (1/6-em)]](https://www.rsc.org/images/entities/char_2009.gif) 7 and keeping the total metal (Cu + Ce) loading constant at 30 wt% (the optimum value obtained before).
7 and keeping the total metal (Cu + Ce) loading constant at 30 wt% (the optimum value obtained before).
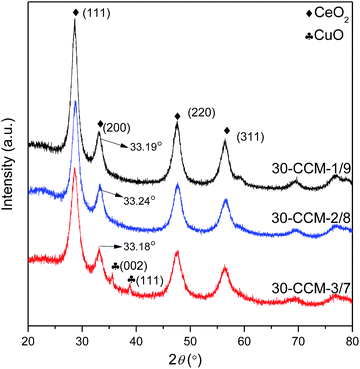
![[thin space (1/6-em)]](https://www.rsc.org/images/entities/char_2009.gif) :
:![[thin space (1/6-em)]](https://www.rsc.org/images/entities/char_2009.gif) 7. On the other hand, all the catalysts exhibit the cubic, fluorite structure of CeO2. Moreover, the diffraction peak of CeO2(200) in all the catalysts shifts to higher 2θ values (33.19° for 30-CCM-1/9, 33.24° for 30-CCM-2/8, and 33.18° for 30-CCM-3/7, respectively) compared with that in the reference Ce/MCF (33.14°), indicating the interaction between CuO and CeO2. On the other hand, it can be observed from Table 4 that the crystal size of CeO2 decreased with the increase in Cu/Ce ratio from 1
7. On the other hand, all the catalysts exhibit the cubic, fluorite structure of CeO2. Moreover, the diffraction peak of CeO2(200) in all the catalysts shifts to higher 2θ values (33.19° for 30-CCM-1/9, 33.24° for 30-CCM-2/8, and 33.18° for 30-CCM-3/7, respectively) compared with that in the reference Ce/MCF (33.14°), indicating the interaction between CuO and CeO2. On the other hand, it can be observed from Table 4 that the crystal size of CeO2 decreased with the increase in Cu/Ce ratio from 1![[thin space (1/6-em)]](https://www.rsc.org/images/entities/char_2009.gif) :
:![[thin space (1/6-em)]](https://www.rsc.org/images/entities/char_2009.gif) 9 to 3
9 to 3![[thin space (1/6-em)]](https://www.rsc.org/images/entities/char_2009.gif) :
:![[thin space (1/6-em)]](https://www.rsc.org/images/entities/char_2009.gif) 7, which can be attributed to the decreased content of CeO2.
7, which can be attributed to the decreased content of CeO2.
| Catalyst | DCeO2a (nm) | DCuOb (nm) | Cell parameterc (nm) | Temperature of peaks (°C) | Peak areas (a.u.) | Ad (a.u.) | ||||||
|---|---|---|---|---|---|---|---|---|---|---|---|---|
| Tα | Tβ | Tγ | Tδ | Aα | Aβ | Aγ | Aδ | |||||
| a From line broadening of CeO2 (111) peak in XRD.b From line broadening of CuO (111) peak in XRD.c Cell parameter calculated by Bragg's law.d The total area of reductive peaks. | ||||||||||||
| 30-CCM-1/9 | 6.2 | — | 0.5395 | 178 | 217 | 235 | — | 33 | 52 | 9 | — | 94 |
| 30-CCM-2/8 | 5.9 | — | 0.5387 | 198 | 224 | 240 | — | 70 | 91 | 45 | — | 206 |
| 30-CCM-3/7 | 5.7 | 23 | 0.5396 | 203 | 223 | 237 | 257 | 62 | 49 | 106 | 32 | 249 |
From the TEM images of the 30-CCM-2/8 and 30-CCM-3/7 catalysts (Fig. 10A and C) we can see the significant characteristic structural features of the MCF material from the two catalysts. Furthermore, from the micrograph of Fig. 10D, it can be noted that Cu species has appeared, which is consistent with the result obtained by XRD analysis.
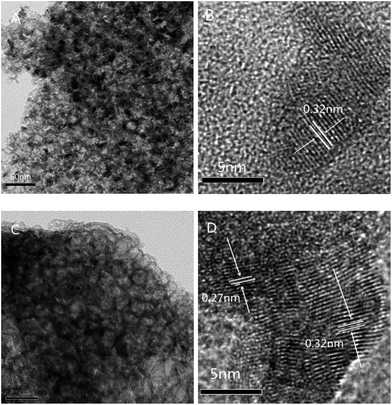 | ||
| Fig. 10 TEM images of 30-CCM-2/8 ((A) 50 nm, and (B) 5 nm), and 30-CCM-3/7 ((C) 50 nm, and (D) 5 nm). | ||
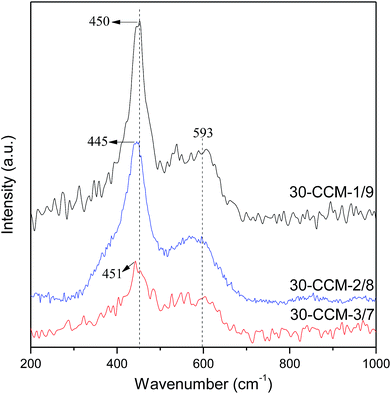
The Raman spectra of the CuO–CeO2/MCF catalysts with different Cu/Ce ratios are shown in Fig. 11. As seen, all the catalysts exhibit the F2g Raman vibration mode of fluorite CeO2. Additionally, the peaks of the F2g band are at 450 cm−1, 445 cm−1, and 451 cm−1 for the 30-CCM-1/9, 30-CCM-2/8, and 30-CCM-3/7 catalysts, respectively; and the width of the band for the 30-CCM-2/8 catalyst is the largest. These results suggest that the 30-CCM-2/8 catalyst has the largest amount of oxygen vacancies among these catalysts.22,41
The XPS measurement results of these catalysts are shown in Fig. 12 and the corresponding parameters are listed in Table 2. As seen, the Ce(III)% values of these catalysts increased first with the Cu/Ce ratio from 1![[thin space (1/6-em)]](https://www.rsc.org/images/entities/char_2009.gif) :
:![[thin space (1/6-em)]](https://www.rsc.org/images/entities/char_2009.gif) 9 (15.6%) to 2
9 (15.6%) to 2![[thin space (1/6-em)]](https://www.rsc.org/images/entities/char_2009.gif) :
:![[thin space (1/6-em)]](https://www.rsc.org/images/entities/char_2009.gif) 8 (19.1%), and then decreased with the Cu/Ce ratio increased to 3
8 (19.1%), and then decreased with the Cu/Ce ratio increased to 3![[thin space (1/6-em)]](https://www.rsc.org/images/entities/char_2009.gif) :
:![[thin space (1/6-em)]](https://www.rsc.org/images/entities/char_2009.gif) 7 (15.2%), indicating that the 30-CCM-2/8 catalyst has the stronger interaction between CuO and CeO2 than the others catalysts. From Table 2, we can see the actual amount of Ce(III) from different CuO–CeO2/MCF catalysts. Clearly, the 30-CCM-2/8 catalyst has the largest amount of Ce(III) (61.4 μmol g−1) among the investigated CuO–CeO2/MCF catalysts (57.8 μmol g−1 for 30-CCM-1/9 and 45.6 μmol g−1 for 30-CCM-3/7), indicating that the 30-CCM-2/8 catalyst has the largest amount of the oxygen vacancies. This result is consistent with that obtained by the above Raman characterization. From Table 2, we can also see that the Isat/Imain values of these catalysts (51.2% for 30-CCM-1/9, 53.6% for 30-CCM-2/8, and 59.3% for 30-CCM-3/7, respectively) are lower than that of the pure Cu2+ species (62%), further confirming that there are reduced Cu species (Cu+) present on the samples. The relative percentages of Cu+ are shown in Table 2, which indicates that the percentage of 30-CCM-1/9 (18.3%) is bigger than the others (15.8% for 30-CCM-2/8, and 11.2% for 30-CCM-3/7, respectively). The reason is because with the increasing of Cu loading, the Ce loading decreased, thus having extra copper that will not be able to interact with CeO2.8 Furthermore, the actual amount of Cu+ of different catalysts are listed in Table 2. It can be seen that the actual amount of Cu+ first increases with the increase in Cu/Ce ratio, then decreases, with a maximum at 2/8. These results indicate that the 30-CCM-2/8 catalyst has the largest amount of the active Cu–Ce interface.
7 (15.2%), indicating that the 30-CCM-2/8 catalyst has the stronger interaction between CuO and CeO2 than the others catalysts. From Table 2, we can see the actual amount of Ce(III) from different CuO–CeO2/MCF catalysts. Clearly, the 30-CCM-2/8 catalyst has the largest amount of Ce(III) (61.4 μmol g−1) among the investigated CuO–CeO2/MCF catalysts (57.8 μmol g−1 for 30-CCM-1/9 and 45.6 μmol g−1 for 30-CCM-3/7), indicating that the 30-CCM-2/8 catalyst has the largest amount of the oxygen vacancies. This result is consistent with that obtained by the above Raman characterization. From Table 2, we can also see that the Isat/Imain values of these catalysts (51.2% for 30-CCM-1/9, 53.6% for 30-CCM-2/8, and 59.3% for 30-CCM-3/7, respectively) are lower than that of the pure Cu2+ species (62%), further confirming that there are reduced Cu species (Cu+) present on the samples. The relative percentages of Cu+ are shown in Table 2, which indicates that the percentage of 30-CCM-1/9 (18.3%) is bigger than the others (15.8% for 30-CCM-2/8, and 11.2% for 30-CCM-3/7, respectively). The reason is because with the increasing of Cu loading, the Ce loading decreased, thus having extra copper that will not be able to interact with CeO2.8 Furthermore, the actual amount of Cu+ of different catalysts are listed in Table 2. It can be seen that the actual amount of Cu+ first increases with the increase in Cu/Ce ratio, then decreases, with a maximum at 2/8. These results indicate that the 30-CCM-2/8 catalyst has the largest amount of the active Cu–Ce interface.
H2-TPR measurements for these catalysts were carried out and the results are given in Fig. 13 and Table 4. According to literatures8,10,33 and the above XRD results, the α, β, γ, and δ peaks can be attributed to small, highly dispersed CuO particles in contact with ceria, the bigger CuO particles in contact with ceria, highly dispersed copper species on MCF, and the agglomerated CuO species on MCF, respectively. Clearly, the intensity of the reduction peaks enhanced with the increase of the Cu/Ce ratio, which accords with the increased CuO content. From Table 4, it can be clearly seen that with the increase of Cu/Ce ratio, the reduction temperatures of α and β peaks shifted to higher values, but the areas of α and β peaks first increases noticeably with the increase in Cu/Ce ratio, then decreases, with a maximum at 2/8. The result indicates that the 30-CCM-2/8 catalyst has the largest number of CuO particles in contact with ceria. Accordingly, the area of the γ peak increases significantly, and the δ peak is observed over the 30-CCM-3/7 catalyst.
4. Conclusions
A series of mesostructured cellular foam (MCF) silica supported CuO–CeO2 catalysts (CuO–CeO2/MCF) were prepared by using co-impregnation method. It was found that the bimetallic content and Cu/Ce ratio greatly influenced the catalytic activity for CO oxidation, of which the catalyst with bimetallic loading of 30 wt% and Cu/Ce ratio of 2![[thin space (1/6-em)]](https://www.rsc.org/images/entities/char_2009.gif) :
:![[thin space (1/6-em)]](https://www.rsc.org/images/entities/char_2009.gif) 8 (wt/wt) (30-CCM-2/8) showed the highest activity due to the largest amounts of Cu+ species, lattice oxygen, oxygen vacancies and dispersed copper oxide nanoparticles over ceria, which was evidenced by the XPS, CO-TPD, Raman, and H2-TPR techniques.
8 (wt/wt) (30-CCM-2/8) showed the highest activity due to the largest amounts of Cu+ species, lattice oxygen, oxygen vacancies and dispersed copper oxide nanoparticles over ceria, which was evidenced by the XPS, CO-TPD, Raman, and H2-TPR techniques.
Acknowledgements
Financial support from the National Natural Science Foundation of China (21273150) and the “ShuGuang” Project (10GG23) of Shanghai Municipal Education Commission and Shanghai Education Development Foundation is gratefully acknowledged.Notes and references
- H. Wan, D. Li, Y. Dai, Y. Hu, Y. Zhang, L. Liu, B. Zhao, B. Liu, K. Sun, L. Dong and Y. Chen, Appl. Catal., A, 2009, 360, 26 CrossRef CAS.
- M. F. Luo, Y. P. Song, J. Q. Lu, X. Y. Wang and Z. Y. Pu, J. Phys. Chem. C, 2007, 111, 12686 CAS.
- S. Royer and D. Duprez, ChemCatChem, 2011, 3, 24 CrossRef CAS.
- M. F. Luo, Y. J. Zhong, X. X. Yuan and X. M. Zheng, Appl. Catal., A, 1997, 162, 121 CrossRef CAS.
- J. L. Ayastuy, A. Gurbani, M. P. González-Marcos and M. A. Gutiérrez-Ortiz, Appl. Catal., A, 2010, 387, 119 CrossRef CAS.
- A. P. Jia, S. Y. Jiang, J. Q. Lu and M. F. Luo, J. Phys. Chem. C, 2010, 114, 21605 CAS.
- J. B. Wang, W. H. Shih and T. J. Huang, Appl. Catal., A, 2000, 203, 191 CrossRef CAS.
- J. Astudillo, G. Águila, F. Díaz, S. Guerrero and P. Araya, Appl. Catal., A, 2010, 381, 169 CrossRef CAS.
- A. Davó-Quiñonero, M. Navlani-García, D. Lozano-Castelló, A. Bueno-López and J. A. Anderson, ACS Catal., 2016, 6, 1723 CrossRef.
- G. Águila, F. Gracia and P. Araya, Appl. Catal., A, 2008, 343, 16 CrossRef.
- J. Luo, W. Chu, H. Xu, C. Jiang and T. Zhang, J. Nat. Gas Chem., 2010, 19, 355 CrossRef CAS.
- C. H. Tu, A. Q. Wang, M. Y. Zheng, X. D. Wang and T. Zhang, Appl. Catal., A, 2006, 297, 40 CrossRef CAS.
- X. Liu, A. Wang, X. Wang, C. Y. Mou and T. Zhang, Chem. Commun., 2008, 44, 3187 RSC.
- N. K. Renuka, K. Anas and C. U. Aniz, Chin. J. Catal., 2015, 36, 1237 CrossRef CAS.
- A. Chirieac, B. Dragoi, A. Ungureanu, C. Ciotonea, I. Mazilu, S. Royer, A. S. Mamede, E. Rombi, I. Ferino and E. Dumitriu, J. Catal., 2016, 339, 270 CrossRef CAS.
- P. Schmidt-Winkel, J. W. W. Lukens, D. Y. Zhao, P. D. Yang, B. F. Chmelk and G. D. Stucky, J. Am. Chem. Soc., 1999, 121, 254 CrossRef CAS.
- P. Schmidt-Winkel, J. W. W. Lukens, P. D. Yang, D. I. Margolese, J. S. Lettow, J. Y. Ying and G. D. Stucky, Chem. Mater., 2000, 12, 686 CrossRef CAS.
- M. Piumetti, M. Hussain, D. Fino and N. Russo, Appl. Catal., B, 2015, 165, 158 CrossRef CAS.
- L. P. Qian, W. J. Cai, L. Zhang, L. Ye, J. Li, M. Tang, B. Yue and H. Y. He, Appl. Catal., B, 2015, 164, 168 CrossRef CAS.
- Y. M. Liu, W. L. Feng, T. C. Li, Y. Cao, H. Y. He and K. N. Fan, J. Catal., 2006, 239, 125 CrossRef CAS.
- J. L. Cao, Y. Wang, T. Y. Zhang, S. H. Wu and Z. Y. Yuan, Appl. Catal., B, 2008, 78, 120 CrossRef CAS.
- Y. L. Zheng, D. S. Mao, S. S. Sun and G. Y. Fu, J. Mater. Sci., 2016, 51, 917 CrossRef CAS.
- C. Q. Hu, Q. S. Zhu, L. Chen and R. F. Wu, Mater. Res. Bull., 2009, 44, 2174 CrossRef CAS.
- A. P. Jia, G. S. Hu, L. Meng, Y. L. Xie, J. Q. Lu and M. F. Luo, J. Catal., 2012, 289, 199 CrossRef CAS.
- L. Qi, Q. Yu, Y. Dai, C. J. Tang, L. J. Liu, H. L. Zhang, F. Gao, L. Dong and Y. Chen, Appl. Catal., B, 2012, 119, 308 CrossRef.
- R. T. Guo, W. L. Zhen, W. G. Pan, Y. Zhou, J. N. Hong, H. J. Xu, Q. Jin, C. G. Ding and S. Y. Guo, J. Ind. Eng. Chem., 2014, 20, 1577 CrossRef CAS.
- S. Scirè, C. Crisafulli, P. M. Riccobene, G. Patanè and A. Pistone, Appl. Catal., A, 2012, 417, 66 CrossRef.
- G. Y. Fu, D. S. Mao, S. S. Sun, J. Yu and Z. Q. Yang, J. Ind. Eng. Chem., 2015, 31, 283 CrossRef CAS.
- P. Gaudin, S. Dorge, H. Nouali, D. Kehrli, L. Michelin, L. Josien, P. Fioux, L. Vidal, M. Soulard, M. Vierling, M. Molière, J. F. Brilhac and J. Patarin, Appl. Catal., A, 2015, 504, 110 CrossRef CAS.
- Y. Su, Y. M. Liu, L. C. Wang, M. Chen, Y. Cao, W. L. Dai, H. Y. He and K. N. Fan, Appl. Catal., A, 2006, 315, 91 CrossRef CAS.
- M. Piumetti, B. Bonelli, P. Massiani, S. Dzwigaj, I. Rossetti, S. Casale, L. Gaberova, M. Armandi and E. Garrone, Catal. Today, 2011, 176, 458 CrossRef CAS.
- B. S. Brunauer, L. S. Deming, W. E. Deming and E. Telle, J. Am. Chem. Soc., 1940, 62, 1723 CrossRef.
- C. J. Tang, J. F. Sun, X. J. Yao, Y. Cao, L. C. Liu, C. Y. Ge, F. Gao and L. Dong, Appl. Catal., B, 2014, 146, 201 CrossRef CAS.
- D. Li, L. Zeng, X. Y. Li, X. Wang, H. Y. Ma, S. Assabumrungrat and J. L. Gong, Appl. Catal., B, 2015, 176, 532 CrossRef.
- L. X. Hu, F. Yang, L. P. Zou, H. Yuan and X. Hu, Chin. J. Catal., 2015, 36, 1785 CrossRef CAS.
- M. Fernández-García, A. Martínez-Arias, A. Iglesias-Juez, C. Belver, A. B. Hungría, J. C. Conesa and J. Soria, J. Catal., 2000, 194, 385 CrossRef.
- J. Li, Y. X. Han, Y. H. Zhu and R. X. Zhou, Appl. Catal., B, 2011, 108, 72 Search PubMed.
- X. T. Gao, S. R. Bare, B. M. Weckhuysen and I. E. Wachs, J. Phys. Chem. B, 1988, 102, 10842 CrossRef.
- D. Gamarra, A. L. Cámara, M. Monte, S. B. Rasmussen, L. E. Chinchilla, A. B. Hungría, G. Munuera, N. Gyorffy, Z. Schay, V. C. Corberán, J. C. Conesa and A. Martínez-Arias, Appl. Catal., B, 2013, 130, 224 CrossRef.
- J. X. Gao, G. H. Wen, T. Huang, P. Tang and Q. Liu, J. Non-Cryst. Solids, 2016, 435, 33 CrossRef CAS.
- Y. L. Zheng, D. S. Mao, S. S. Sun and G. Y. Fu, J. Nanopart. Res., 2015, 17, 471 CrossRef.
- E. S. Gnanakumar, J. M. Naik, M. Manikandan, T. Raja and C. S. Gopinath, ChemCatChem, 2014, 6, 3116 CrossRef CAS.
- T. Tsoncheva, G. Issa, T. Blasco, M. Dimitrov, M. Popova, S. Hernandez, D. Kovacheva, G. Atanasova and J. M. L. Nieto, Appl. Catal., A, 2013, 453, 1 CrossRef CAS.
- M. Alifanti, B. Baps, N. Blangenois, J. Naud, P. Grange and B. Delmon, Chem. Mater., 2003, 15, 395 CrossRef CAS.
- S. S. Lee, H. G. Zhu, E. Q. Contreras, A. Prakash, H. L. Puppala and V. L. Colvin, Chem. Mater., 2012, 24, 424 CrossRef CAS.
- J. Fan, X. D. Wu, X. D. Wu, Q. Liang, R. Ran and D. Weng, Appl. Catal., B, 2008, 81, 38 CrossRef CAS.
- Y. Nagai, T. Hirabayashi, T. Minami, K. Dohmae, H. Shinjoh, N. Takagi and S. Matsumoto, J. Catal., 2006, 242, 103 CrossRef CAS.
- L. H. Reddy, G. K. Reddy, D. Devaiah and B. M. Reddy, Appl. Catal., A, 2012, 445, 297 CrossRef.
- D. W. Jeong, W. J. Jang, H. S. Na, J. O. Shim, A. Jha and H. S. Roh, J. Ind. Eng. Chem., 2015, 27, 35 CrossRef CAS.
- G. Avgouropoulos and T. Ioannides, Appl. Catal., A, 2003, 244, 155 CrossRef CAS.
- S. P. Wang, X. Y. Wang, J. Huang, S. M. Zhang, S. R. Wang and S. H. Wu, Catal. Commun., 2007, 8, 231 CrossRef CAS.
- L. Y. Li, W. L. Han, J. Y. Zhang, G. X. Lu and Z. C. Tang, Microporous Mesoporous Mater., 2016, 231, 9 CrossRef CAS.
- X. J. Yao, F. Gao, Q. Yu, L. Qi, C. J. Tang, L. Dong and Y. Chen, Catal. Sci. Technol., 2013, 3, 1355 CAS.
- L. J. Liu, Z. J. Yao, Y. Deng, F. Gao, B. Liu and L. Dong, ChemCatChem, 2011, 3, 978 CrossRef CAS.
- C. R. Jung, A. Kundu, S. W. Nam and H. I. Lee, Appl. Catal., B, 2008, 84, 426 CrossRef CAS.
- G. Avgouropoulos, T. Ioannides and H. Matralis, Appl. Catal., B, 2005, 56, 87 CrossRef CAS.
- W. Liu and M. Flytzanistephanopoulos, J. Catal., 1995, 153, 317 CrossRef CAS.
- X. L. Tang, B. C. Zhang, Y. Li, Y. D. Xu, Q. Xi and W. J. Shen, Catal. Today, 2004, 93, 191 CrossRef.
- G. Avgouropoulos and T. Ioannides, J. Mol. Catal. A: Chem., 2008, 296, 47 CrossRef CAS.
- D. Gamarra, C. Belver, M. Fernández-García and A. Martínez-Arias, J. Am. Chem. Soc., 2007, 129, 12064 CrossRef CAS PubMed.
- S. S. Sun, D. S. Mao, J. Yu, Z. Q. Yang, G. Z. Lu and Z. Ma, Catal. Sci. Technol., 2015, 5, 3166 CAS.
- B. Eren, C. Heine, H. Bluhm, G. A. Somorjai and M. Salmeron, J. Am. Chem. Soc., 2015, 137, 11186 CrossRef CAS PubMed.
- J. Li, P. F. Zhu, S. F. Zuo, Q. Q. Huang and R. X. Zhou, Appl. Catal., A, 2010, 381, 261 CrossRef CAS.
| This journal is © The Royal Society of Chemistry 2017 |


