 Open Access Article
Creative Commons Attribution 3.0 Unported Licence
Direct observation of flow and bubble behavior in flat sheet modules with a distributor
Tao Wanga,
Xinping Hea,
Zhen Wub and
Jiding Li *a
*a
aThe State Key Laboratory of Chemical Engineering, Department of Chemical Engineering, Tsinghua University, Beijing 100084, China. E-mail: lijiding@mail.tsinghua.edu.cn; Fax: +86 10 62770304; Tel: +86 10 62782432
bOrdos Redbud Innovation Institute, Ordos 017000, China
First published on 30th March 2017
Abstract
The air sparging method, which involves the introduction of air bubbles, is widely used in membrane separation to enhance performance. However, in flat sheet modules with distributors, the bubble behavior is complicated, which can have a critical impact on the air sparging efficiency. In this work, industrial-scale transparent modules were fabricated to visualize the two-phase flow with a distributor in different air sparging methods. Initially, the pressure drop in the channels induced by the inclusion of a distributor and spacer was evaluated, and the flow regime of the fluid was determined in visualization test. As for two-phase flows, five different solutions were investigated, categorized into two groups according to the coalescence behavior, namely the coalescence group and the non-coalescence group. Then, the bubble behaviors in a tubular flow module with different air sparging devices were studied for the two coalescence groups. In the pre-mixing method, the anti-coalescence phenomenon of bubbles clearly occurred at a high gas flow rate in the non-coalescence system. When an aerator head was used, smaller air bubbles were obtained, especially for the non-coalescence system, where the bubbles were small enough to ignore the resistance of the orifice. The flow patterns were subsequently investigated with empty flat sheet modules with different air sparging devices. Three flow regions were depicted for different solutions and air sparging devices. In the pre-mixing method, the coalescence effect led to a higher liquid flow rate being required to reach region (III) for water. The introduction of an aerator nozzle had the advantage of uniformly distributing the bubbles, while a higher gas flow rate was required to achieve a bubbly flow. With the incorporation of a spacer, the liquid flow rates needed to be higher than 0.32 m s−1 and 0.29 m s−1 to eliminate stagnant bubbles in the pre-mixing and air nozzle methods, respectively, in the coalescence system, and it was found the phenomenon was similar as for ethanol solution. According to our results, optimal operating conditions of air sparging devices for two-phase flow are proposed.
1. Introduction
Membrane separation is widely used in many industrial applications.1–5 Concentration polarization6,7 and membrane fouling8,9 significantly influence the membrane performance. Several techniques have been adopted to minimize these phenomena, such as applying a pre-treatment method, introduction of a turbulence promoter,10,11 membrane surface modification,12 and air sparging,13,14 which is supposed to be promising since it could be mild to the membrane surface and should not introduce other impurities.15,16 Extensive research has been carried out on tubular and hollow fiber modules and the performance improvement by the air sparging method has been proven.17,18 Flat sheet modules are one of the fundamental types available in the marketplace and could cover a broad range of feed solutions, though it is difficult to overcome their low packing density and high unit cost. However, only limited works have focused on flat sheet modules19–21 let alone channels with spacers22 or distributors, which represent significant parts of flat sheet modules.Net-type spacers or turbulence promoters are used in flat sheet modules to create a turbulent flow in order to eliminate concentration polarization, while the distributor is usually adopted to acquire a uniform fluid flow,23,24 as a complicated situation can occur when a two-phase flow is incorporated, compared with flow in an empty channel. Effective module design and optimization of the operating conditions can help gain a basic knowledge of the air sparging behaviors inside the modules.
Numerous studies25–27 have investigated the pressure losses and transport promoting effect in spacer-filled channels; while in contrast, little attention has been paid to the situation with two-phase flows. Ndinisa19,20 reported a comprehensive work on bubble flows in submerged flat sheet modules filled with spacer-like baffles. Channels equipped with traditional industrial diamond-like spacers were investigated by Willems22 for the first time, who studied the bubble flow behaviors under various spacers as well as the liquid and gas velocities through the use of visualization methods. Subsequently, the cleaning effect of a two-phase flow in spacer-filled channels was further validated,28,29 although the detailed flow behavior attracted little concern. Recently, particle image velocimetry (PIV)30 was introduced to obtain a more intuitive image of two-phase flows; however, precise instruments need to be adopted. In comparison, the direct observation method could be a convenient and economical way.
It is well known that, for tubular-shaped (tubular and hollow fiber module) and flat-shaped modules (flat sheet and disk module), bubbles should present a large bullet shape and approach the diameter or channel height to fulfill the cleaning effect. Under this circumstance, the movement of bubbles could disturb the boundary layer to hinder the formation of concentration polarization or a fouling layer. Moreover, the distribution of bubbles could affect the cleaning area of the membrane surface.15 However recently, many researchers have turned their attention to microbubbles (tens of micrometers in size) as they have peculiar characteristics to eliminate membrane fouling.31,32 However, on account of the different cleaning mechanism, they are not discussed herein. It is worth mentioning that, the coalescence behavior of bubbles could be drastically affected by a minute addition of surface-active materials.33,34 Surface-active molecules tend to accumulate at the gas–liquid interface to form a directional-alignment monolayer, which could hinder the motion of a liquid film, which is a crucial step for bubble coalescence. Therefore, it could be expected that there may be great discrepancies in the bubble-sized flow distribution and coalescence behavior, even under the same channel geometry.
Various aeration devices could be good candidates to improve the flow characteristics,35 among which an aerator head, aerator nozzle, and a pre-mixing method are discussed in this study. In this work, transparent modules of an industrial scale were fabricated. The pressure drop of the modules induced by a distributor and spacer was evaluated and visualization tests were carried out with the aid of an indicator. The bubble behavior in a tubular flow module and the flow patterns with different air sparging devices in flat sheet modules were investigated in coalescence and non-coalescence systems, respectively. Consequently, optimal operating conditions of air sparging devices for two-phase flow are proposed. With the results of the experiments, we aimed to obtain a greater understanding of bubble behavior in flat sheet modules with a spacer, distributor, and air sparging devices in different solutions, which could contribute to future work toward enhancing membrane performance.
2. Experimental
2.1. Spacer and materials
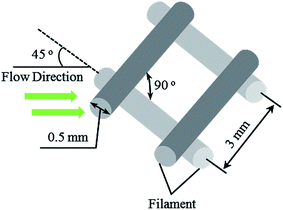
The spacer used in this study was obtained from commercial spiral-wound modules (Hydranautics, USA), with the structure of one repeating unit, as shown in Fig. 1.The spacer filament could be viewed as a cylinder with a diameter of 0.5 mm; therefore, the net thickness of the spacer was 1 mm. The geometry parameters of the spacer were calculated using the methods proposed by Schock.36 Consequently, the porosity (ε) and hydraulic diameter (dh) of the spacer investigated were 0.8429 and 1.035, respectively.
Five typical solutions were chosen to represent the separation systems most commonly encountered in ultrafiltration, nanofiltration, or reverse osmosis.37,38 A list of the solutions is shown in Table 1.
| No. | Name | Concentration (ppm) |
|---|---|---|
| 1 | Deionized water | Pure |
| 2 | Ethanol | 1000 |
| 3 | MgSO4 | 1000 |
| 4 | BSA | 500 |
| 5 | SDS | 200 |
Deionized water from Jiangchuan Corporation was used throughout the entire investigations. Ethanol, MgSO4, and sodium dodecyl sulfate (SDS) were supplied by Beijing Chemical Reagents Corporation, while Bull Serum Albumin (BSA) was acquired from Alfa Aesar. All the chemicals were used directly without further purification. Red ink, purchased from Shanghai Fine Stationery Corporation, was diluted to a certain extent as an indicator for flow visualization.
2.2. Experimental setup
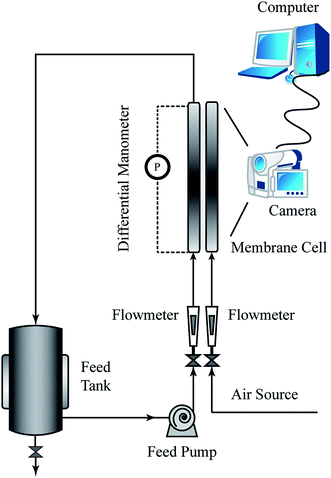
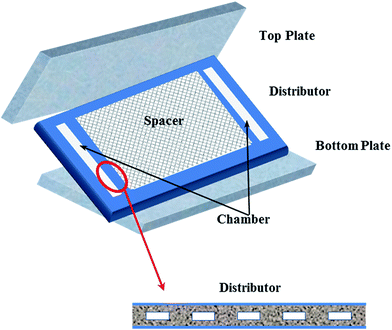
Visualization tests were performed in the self-designed setup demonstrated in Fig. 2. The test solutions were circulated in the system with the aid of a centrifugal pump (TE-5S-MD, MARCH, USA) and the temperature was maintained at room temperature by using an air conditioner. The membrane cell was transparent and was made of polymethacrylate (PMMA) to allow direct visualization of the channel inside. Other than a traditional flat sheet module, the permeate part was omitted, since the permeate flux was too small to affect the main flow stream that we were focused on.11,22 A precise pressure difference transmitter (HY3051DP, Beijing Xinhaizhongfeng Technology, China) was adopted to evaluate the pressure losses through the module. Compressed air was fed to the module by the air source. The fluid and gas flow rates were regulated by valves and detected by using flowmeters. Fluid flow was captured with a digital camera (Nikon D90, Japan) equipped with a micro lens and high speed shutter.The details of the membrane cell are shown in Fig. 3. The cell consisted of three parts that were stacked in turns and fastened by bolts to form the fluid channel. The distributor consisted of a series of rectangular holes connected to the chambers to avoid maldistribution of the fluid. The channel could be empty or embedded with a spacer according to the different demands. The effective “membrane” area was 160 × 250 square mm, while the distributor holes were in the scale of several mms.
2.3. Air sparging approaches
Air sparging has been proven to be an effective method to control membrane fouling.39 Three different devices, depicted in Fig. 4, for introducing air were adopted to investigate the gas behavior in the flow channel.40 The aerator head possessed a pore size of 2 μm to generate small-sized bubbles, while an aerator nozzle with 1 mm parallel holes could be used to obtain medium-sized bubbles. Besides, the pre-mixing method could offer large-scale bubbles.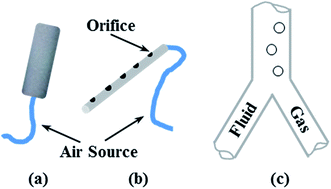 | ||
| Fig. 4 Air sparging devices: (a) aerator head (pore size 2 μm), (b) aerator nozzle (parallel holes with diameter of 1 mm), and (c) pre-mixing method. | ||
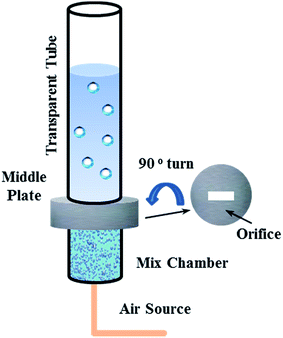
A tubular flow module was designed to describe the two-phase flow passing the distributor, which is depicted in Fig. 5.
Transparent tubular flow module was fabricated with one tiny hole in the middle of the bottom to simulate a distributor. The diameter of the tube was much larger than the bubble size to make sure the bubbles could be well developed. Also, a different air sparging method was employed linked to the mix chamber. As we were restricted by the structure of the mix chamber, a syringe needle with an inner diameter of 1 mm was used to represent the aerator nozzle. The module was placed perpendicular to the ground and the solutions were kept stationary.
2.4. Methods
The flow behavior passing through the distributor was studied with the aid of the indicator. Initially, a small amount of indicator was injected into the flow inlet carefully to make it stationary and then the three-way connections were turned to the main flow tube to push the indicator through the distributor hole to form a straight indicator column. Meanwhile, the flow paths were recorded by the camera with a high speed shutter.
Bubble behaviors with different air sparging methods were researched in the tubular flow module. Deionized water (representing the coalescence system) or ethanol solution (representing the non-coalescence system) was filled in the tube in advance, while different air sparging devices were adopted to introduce air from the bottom of the mix chamber. For various gas flow rates, diverse bubble behaviors were captured by the camera.
Contact angle measurements were carried out on a contact angle analyzer (Dataphysics Instruments, USA) for the five solutions at room temperature. The tests were performed on a Teflon surface, with at least five individual measurements made and the average taken for each solution.
3. Results and discussions
3.1. Pressure drop and flow visualization of a single-phase flow
To describe the flow characteristics of the fluid in the channel with or without a spacer, the Re number was adopted, which is expressed in eqn (1) as:
 | (1) |
 | (2) |
| f = aRe−b | (3) |
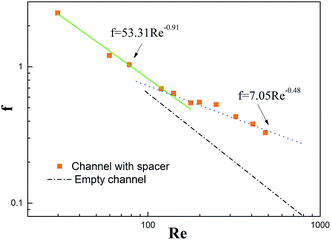
Friction factors and the Re number values of a spacer-filled channel without a distributor were calculated from the experimental measurements and were subsequently plotted in Fig. 6. The relationship with the empty channel was obtained by theoretical calculation by following the Fanning equation.
For the empty channel, since the flow was in typical laminar regimes (Re < 2000), the plot exhibited a straight line under logarithmic coordinates; whereas, two different variation trends were acquired in a spacer-filled channel, which could be viewed as different flow regimes. Correspondingly the intersection of the two fitting lines indicated the critical Re number of around 100, which was consistent with our previous work.42
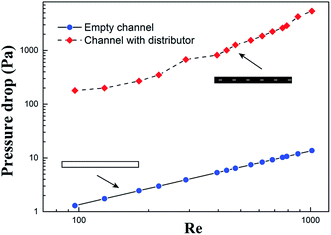
To evaluate the pressure drop introduced by the inclusion of a distributor, the pressure differences were measured with and without the three parts (inlet, outlet tube, and distributor), with the results displayed in Fig. 7.
The pressure losses were calculated by using the Fanning equation for an empty channel due to its simple structure, while the pressure drops in a channel with a distributor were measured directly. Obviously, the pressure losses were much higher in the latter since there were many factors contributing. The flow at the inlet and outlet of the channel experienced sudden expansion or contraction head losses, while a more severe phenomenon occurred in the flow passing the holes of the distributor. Moreover, the fluid velocity in rectangular holes was much higher than the bulk flow. Therefore, the flow regime might rush into the turbulent region, which undoubtedly brought about extra head losses.
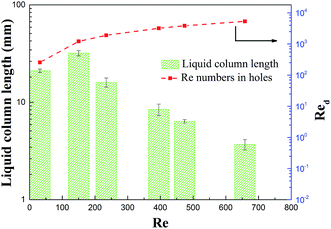
The visualization tests further confirmed the flow regime switch induced by the rectangular holes, as demonstrated in Fig. 8.
With the increase in the velocity, the Re numbers grow as well. It should be pointed out that the Re numbers in rectangular holes (noted as Red) were much larger than those in the empty channel. In the laminar region, the flow was stable, while the indicator column length rose as the flow rate increased, before distinct scattering occurred. With the flow rate ascending further, the mixing phenomenon was gradually observed, thus the streamline length began to reduce due to the quick mixing leaving less time for the column to grow. At Re numbers much higher than 2000, the flow region could be viewed as being deeply in the turbulent region, thus the drastic mixing gave little time for the column to develop. This circumstance is beneficial for minimizing the concentration polarization, although the pressure losses are unavoidable. In conclusion, turbulent regions in distributor holes are recommend for good operation, while a too high flow velocity is unnecessary since it might lead to significant head losses.
3.2. Coalescence behavior of different solutions
In air sparging processes, bubble coalescence is commonly observed when the bubbles approach each other and collide. Different from a pure water system, with the incorporation of a tiny amount of organics, the coalescence behavior of bubbles could be restricted, which is known as a non-coalescence system.33,34 Here, air was introduced in the test solutions by use of an aerator head under a low gas flow rate to obtain individual bubbles, which are depicted in Fig. 9.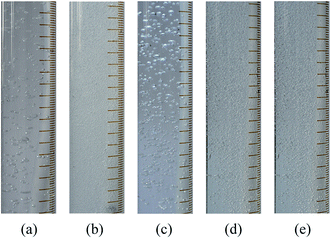 | ||
| Fig. 9 Air bubbles in test solutions generated by an aerator head: (a) pure water; (b) ethanol solution; (c) MgSO4 solution; (d) BSA solution; (e) SDS solution. | ||
The bubble behavior of the test solutions could be divided into two categories, namely the coalescence group (pure water, MgSO4 solution) and the non-coalescence group (ethanol solution, BSA solution, SDS solution). Contact angle measurements reflected that, with a tiny addition of organics or surface-active substance, the contact angle dropped sharply, as shown in Table 2.
| Name | Concentration (ppm) | Contact angle (°) |
|---|---|---|
| Water | Pure | 104.4 ± 3.5 |
| Ethanol | 1000 | 74.6 ± 2.6 |
| MgSO4 | 1000 | 108.0 ± 8.6 |
| BSA | 500 | 94.7 ± 4.8 |
| SDS | 200 | 88.0 ± 2.3 |
MgSO4 could be viewed as a non-surface-active substance that leads to an increase in the surface tension of solution. Therefore, accompanied with pure water, MgSO4 solution could be regarded as a coalescence system. Nevertheless, the other three additions tended to aggregate around the bubble surface, which lowered the surface tension. The surface-active substances gave rise to the resistance of bubble stretch, which is the crucial step for bubble coalescence. Attributed to the low gas flow rate, no coalescence behavior could be observed in the moving process, thus we could conclude that the bubbles had been well developed just after leaving the aerator head. In the coalescence group, the bubble size ranged from 2 mm to 5 mm, as roughly measured from Fig. 9 (the length of the minor scale mark is 2 mm), while the size was a bit lager in the MgSO4 solution, ascribed to the higher surface tension. As for the bubbles in the non-coalescence group, the precise bubble size was difficult to measure under the present resolution; however, they were well below 1 mm.
3.3. Bubble behavior in the tubular flow module with different air sparging devices
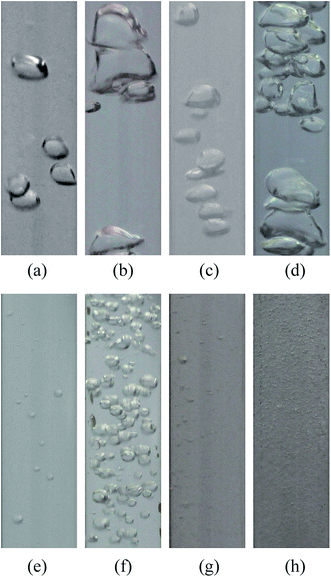
Three air sparging methods were adopted to investigate the bubble behavior passing through one “distributor hole” in the tubular flow module outlined in Fig. 5. The diameter of the module was wide enough to make sure that there was no contribution to the coalescence of bubbles. Gas was injected into the mixing chamber and subsequently entered the transparent tube filled with the coalescence solution (e.g., pure water as a representative solution) or non-coalescence solution (e.g., ethanol solution as a representative solution) through an orifice. It is worth mentioning that the air bubbles introduced by the syringe needle were larger than the size of orifice and so easily gathered below the separation plate to form an air layer. However, the situation was similar with the pre-mixing method, which means they could be studied together.The bubble behavior in a stationary liquid under different gas flow rates and air sparging devices are shown in Fig. 10.
In the pre-mixing method, a gas layer could be observed under the orifice, thus the bubbles were move upward driven by buoyancy and impeded by the orifice. At a low gas flow rate of 27 mL min−1 in the coalescence system, the isolated bubbles exhibited an ellipsoidal shape with a long axis of 4–6 mm. As the flow rate rose to 130 mL min−1, the coalescence behavior was distinctly observed where the bubbles “grew” lager with an irregular surface, as shown in Fig. 10(b). With regard to ethanol solution, the bubble behavior presented little discrimination at low gas flow rate. As for a high gas flow, the coalescence tendency was restrained, where the aggregated bubbles exhibited obvious boundaries, as described in Fig. 10(d). Generally, the cleaning effect of the bubbles was obvious once the bubble size approached the diameter of the tubular module, which is known as the slug flow.15 For a flat sheet module, the height of the channel (empty or spacer filled) rarely exceed 5 mm, therefore the cleaning effect could be maintained in either coalescence or non-coalescence systems using the pre-mixing methods.
When an aerator head was introduced, smaller air bubbles of 0.5–1.5 mm were obtained under a low gas flow rate of 27 mL min−1 in water. As the flow rate increased, air bubbles were driven to coalesce until a gas layer was formed, whereby the same phenomenon occurred as in pre-mixing methods. In ethanol solution, the bubbles were small enough to ignore the resistance of the orifice, such that the gas flow rate only influenced the density of bubbles. In traditional tubular modules, the slug flow was supposed to be effective, while the small bubbles were far away from reaching the standard in a flat sheet even in a spacer-filled channel. Recently, extensive research has focused on microbubbles to explore their potential to eliminate membrane fouling found in many applications.43,44 The bubbles obtained above approached the size of microbubbles though different generating approaches were adopted, therefore a transport-facilitation effect could be expected and further research is needed to investigate this further.
3.4. Two-phase flow patterns in an empty flat sheet module
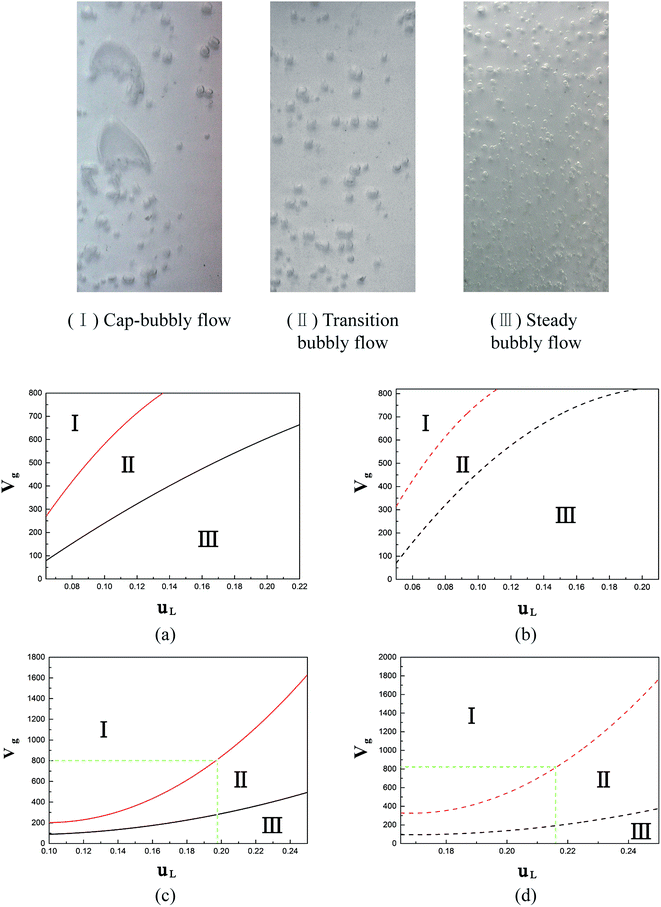
Flow patterns were investigated in empty flat sheet modules with different air sparging devices. The modules possessed a width of 160 mm, such that the distribution besides bubble coalescence behavior should be taken into consideration. The pre-mixing method remained the same as in Section 3.3, while the aerator nozzle shown in Fig. 4(b) was adopted below the distributor. Due to the limited dimension of the air sparging head, the function area could not cover the wide range of the channel. In this circumstance, the air bubbles tend to aggregate in a limited space to form a gas layer, which loses its significance. Certainly, in non-coalescence systems, the bubble moves upward without any obstruction, regardless of the distributor or spacers, due to the tiny size. As a consequence, the pre-mixing method and aerator nozzle were mainly focused on flat sheet modules.Air bubbles in a rectangular channel may suffer two forces, namely buoyancy and shear force, by the liquid flow besides the friction from the channel wall. Moreover, the distributor holes offer extra resistance when bubbles pass through them. In the test module, three different flow structures were acquired under diverse gas and liquid flow rates, which are shown in Fig. 11.
As is well known, bubbly flow and cap-bubbly flow are typical flow regimes in vertical rectangular channels.45 Since the transition regions herein covered a wide span of liquid and gas flow rates, the bubbly flow was subdivided into transition bubbly flow and steady bubbly flow. The regions related to the three flow regimes are depicted in Fig. 11(a)–(d) for the different solutions and air sparging devices. At a relatively high gas flow rate, the bubbles are prone to coalesce caused by the confinement of the channel wall, thus the cap-bubbly flow could be observed namely in region (I). In this situation, bubbles are primarily controlled by buoyancy. On the contrary, gas bubbles are uniformly dispersed in the successive liquid phase at relatively high liquid flow rate, called region (III). By this time, the shear force provided by the liquid flow dominates. While under a moderate gas and liquid flow rate, the bubbles exhibit a larger than steady bubble flow and are prepared to further “grow” with the increase in the gas flow rate in terms of region (II).
In the pre-mixing method (Fig. 11(a) and (b)), the boundaries between regions (I) and (II) were nearly located in the same gas and liquid flow rate range for both systems, indicating that geometry restriction counteracts the anti-coalescence function of the ethanol solution. As the liquid flow rate increases, the flow regimes turn to bubbly flows gradually. During this period, the coalescence effect distinctly leads to the higher liquid flow rate required to reach region (III) for water. One thing to be noted is that the well-distributed bubbles in region (III) were still hard to cover the whole width of the channel, even in the highest liquid flow rate studied. So we could conclude that the pre-mixing method was suitable for modules with a not so high width height ratio and where it is difficult to install extra air distributing devices.
The introduction of an aerator nozzle had natural advantages of uniformly distributing the bubbles compared with the pre-mixing method, whereas a higher gas flow rate was needed to achieve bubbly flow, as described in Fig. 11(c) and (d). Since the gas flow is dispersed along the channel, the shear stress caused by the liquid flow could be dominated to drive the bubbles to pass through the distributor holes, while in the pre-mixing method, the crowded bubbles provided a greater contribution for going across. An inadequate liquid flow rate may induce the accumulation of gas to form a gas layer under the distributor, in which condition the aerator nozzle becomes meaningless because a cap-bubbly flow is always obtained. To sum up, an aerator nozzle is appropriate for modules that possess enough room for them to be installed and that have a high requirement for a good distribution of bubbles.
3.5. Two-phase flow patterns in a flat sheet module with spacers
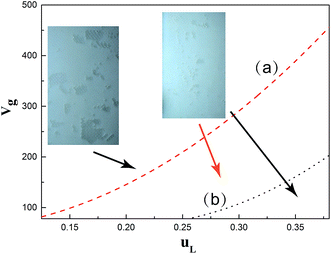
With the incorporation of a spacer, additional resistance by spacer filaments should be taken into consideration. Similar investigation methods were conducted to investigate this as in the above section. It was found that the existence of a spacer impeded the coalescence behavior of bubbles, taking advantages of filaments blocking in water. However, the bubbles were also prone to be captured in the spacer interval, such that a higher liquid flow rate was required to wash the “trapped bubbles” out. The liquid flow rates should be higher than 0.32 m s−1 and 0.29 m s−1 to eliminate stagnant bubbles for the pre-mixing and air nozzle methods, respectively, in coalescence systems. Willems22 also found the presence of stagnant bubbles at low velocity, while at moderate speed, the bubbles could be reduced. Similarly, uniform distribution existed only when an air nozzle was adopted.In a non-coalescence system, two bubble behaviors could be obtained, which are shown in Fig. 12. The region located in the upper-left of the red line is a low liquid flow region, where bubble aggregation is severe. This may induce much occupation of the effective membrane surface, which would harm the membrane performance. The lower-right of the red or black line demonstrates the bubbly flow region for the air nozzle and pre-mixing methods, respectively. In these areas, shear stress from liquid flow is crucial, such that other resistance could be ignored. Ascribed to the surface properties of bubbles changing in ethanol solution, the bubbles become smaller but more stable. In the pre-mixing method, a higher liquid flow should be used to push the bubbles crowded in the main flow path from escaping the spacer interval. The introduction of an air nozzle would still make the distribution more uniform. Thus it could be seen that an air nozzle enables optimization from the angle of energy consumption and a good distribution aspect, provided enough space could be offered.
4. Conclusion
The flow and bubble behavior in flat sheet modules with a distributor were investigated through direct observation. First, the pressure drop of channels fitted with a distributor and spacer of flat sheet modules was evaluated. In visualization tests, the flow regime inside the distributor holes suffered a transition from laminar to turbulent, which was beneficial to the elimination of concentration polarization, but at the cost of pressure losses.The coalescence behavior of five different solutions were investigated and then categorized into two groups, namely the coalescence group and the non-coalescence group. Contact angle measurements demonstrated that the bubble size change in the non-coalescence group should be attributed to the surface-active substance. The bubble behavior without the effect by the channel wall was investigated in a tubular flow module. In the pre-mixing method, the bubbles exhibited an ellipsoidal shape with a long axis of 4–6 mm, which could “grow” lager as the flow increased in the coalescence system. The size of bubbles met the requirements to fulfill the cleaning effect. With regard to ethanol solution, the coalescence tendency was restricted obviously at a high gas flow rate. When an aerator head was used, smaller air bubbles of 0.5–1.5 mm were obtained under low gas flow rate in water, while in ethanol solution, the bubbles were even smaller. Thus, in this situation, the bubbles were not satisfactory.
Three flow regions were depicted for different solutions and air sparging devices with empty flat sheet modules. In the pre-mixing method, the boundaries between region (I) and (II) were nearly the same. The coalescence effect led to the higher liquid flow rate required to reach region (III) for water. The introduction of an aerator nozzle had natural advantages of uniformly distributing the bubbles, whereas a higher gas flow rate was needed to achieve bubbly flow. With the incorporation of a spacer, the liquid flow rates should be higher than 0.32 m s−1 and 0.29 m s−1 to eliminate stagnant bubbles for the pre-mixing and air nozzle methods, respectively, in the coalescence system, and the situation was similar in ethanol solution.
So we could conclude that the pre-mixing method was suitable for modules with a not so high width height ratio and where it is difficult to install extra air distributing devices, while an aerator nozzle is appropriate for modules that possess enough room to install them and that have a high requirement for the good distribution of bubbles. As for the use of an air sparging head, due to the limited dimensions, the performance was the same as for the pre-mixing method in water, while in ethanol solution, the bubbles approached the size of microbubbles and thus lost their cleaning function.
Nomenclature
| dh | Hydraulic diameter (m) |
| f | Friction factor (–) |
| l | Length of the channel (m) |
| ΔP | Pressure drop of the channel (Pa) |
| Re | Liquid Reynolds number (–) |
| Rec | Critical Reynolds number (–) |
| Red | Reynolds numbers in rectangular holes (–) |
| u | Liquid velocity (m s−1) |
| μ | Liquid dynamic viscosity (Pa s) |
| ρ | Liquid density (kg m−3) |
Acknowledgements
The authors greatly appreciate the financial supports of Jiangsu National Synergetic Innovation Center for Advanced Materials (SICAM), National Natural Science Foundation of China (21576150), Science Foundation of Tsinghua University (20131089399) and the Special funds for technological development research of Research Institutes from National Ministry of Science and Technology (2013EG111129).References
- R. W. Baker, Ind. Eng. Chem. Res., 2002, 41, 1393–1411 CrossRef CAS
.
- M. S. El-Bourawi, Z. Ding, R. Ma and M. Khayet, J. Membr. Sci., 2006, 285, 4–29 CrossRef CAS
.
- X. S. Feng and R. Huang, Ind. Eng. Chem. Res., 1997, 36, 1048–1066 CrossRef CAS
.
- C. Visvanathan, R. B. Aim and K. Parameshwaranc, Crit. Rev. Environ. Sci. Technol., 2000, 30, 1–48 CrossRef CAS
.
- P. R. Danesi, Sep. Sci. Technol., 1984, 19, 857–894 CrossRef CAS
.
- S. S. Sablani, M. Goosen, R. Al-Belushi and M. Wilf, Desalination, 2001, 141, 269–289 CrossRef CAS
.
- V. Chen, A. G. Fane, S. Madaeni and I. G. Wenten, J. Membr. Sci., 1997, 125, 109–122 CrossRef CAS
.
- P. Le-Clech, V. Chen and T. A. G. Fane, J. Membr. Sci., 2006, 284, 17–53 CrossRef CAS
.
- F. Meng, S. Chae, A. Drews, M. Kraume, H. Shin and F. Yang, Water Res., 2009, 43, 1489–1512 CrossRef CAS PubMed
.
- A. Almeida, V. Geraldes and V. Semiao, Chem. Eng. Sci., 2010, 65, 3660–3670 CrossRef CAS
.
- V. Geraldes, V. Semiao and M. Pinho, J. Membr. Sci., 2002, 203, 87–102 CrossRef CAS
.
- D. S. Wavhal and E. R. Fisher, Langmuir, 2003, 19, 79–85 CrossRef CAS
.
- T. Taha, W. L. Cheong, R. W. Field and Z. F. Cui, J. Membr. Sci., 2006, 279, 487–494 CrossRef CAS
.
- M. Mercier-Bonin, C. Lagane and C. Fonade, J. Membr. Sci., 2000, 180, 93–102 CrossRef CAS
.
- Z. F. Cui, S. Chang and A. G. Fane, J. Membr. Sci., 2003, 221, 1–35 CrossRef CAS
.
- Y. Wibisono, E. R. Cornelissen, A. J. B. Kemperman, W. G. J. van der Meer and K. Nijmeijer, J. Membr. Sci., 2014, 453, 566–602 CrossRef CAS
.
- Q. Y. Li, Z. F. Cui and D. S. Pepper, Chem. Eng. J., 1997, 67, 71–75 CrossRef CAS
.
- C. Cabassud, S. Laborie, L. Durand-Bourlier and J. M. Lainé, J. Membr. Sci., 2001, 181, 57–69 CrossRef CAS
.
- N. V. Ndinisa, A. G. Fane and D. E. Wiley, Sep. Sci. Technol., 2006, 41, 1383–1409 CrossRef CAS
.
- N. V. Ndinisa, A. G. Fane, D. E. Wiley and D. F. Fletcher, Sep. Sci. Technol., 2006, 41, 1411–1445 CrossRef CAS
.
- K. Zhang, P. Wei, M. Yao, R. W. Field and Z. Cui, Desalination, 2011, 283, 221–226 CrossRef CAS
.
- P. Willems, A. J. B. Kemperman, R. G. H. Lammertink, M. Wessling, M. van Sint Annaland, N. G. Deen, J. A. M. Kuipers and W. G. J. van der Meer, J. Membr. Sci., 2009, 333, 38–44 CrossRef CAS
.
- J. Farkova, J. Membr. Sci., 1991, 64, 103–111 CrossRef CAS
.
- G. Belfort, J. Membr. Sci., 1989, 40, 123–147 CrossRef CAS
.
- A. R. Dacosta and A. G. Fane, Ind. Eng. Chem. Res., 1994, 33, 1845–1851 CrossRef CAS
.
- A. R. Dacosta, A. G. Fane and D. E. Wiley, J. Membr. Sci., 1994, 87, 79–98 CrossRef CAS
.
- Z. Cao, D. E. Wiley and A. G. Fane, J. Membr. Sci., 2001, 185, 157–176 CrossRef CAS
.
- J. S. Vrouwenvelder, J. Buiter, M. Riviere, W. G. J. van der Meer, M. C. M. van Loosdrecht and J. C. Kruithof, Water Res., 2010, 44, 689–702 CrossRef CAS PubMed
.
- E. Cornelissen, J. Vrouwenvelder, S. Heijman, X. Viallefont, D. Vanderkooij and L. Wessels, J. Membr. Sci., 2007, 287, 94–101 CrossRef CAS
.
- P. Willems, N. G. Deen, A. J. B. Kemperman, R. G. H. Lammertink, M. Wessling, M. van Sint Annaland, J. A. M. Kuipers and W. G. J. van der Meer, J. Membr. Sci., 2010, 362, 143–153 CrossRef CAS
.
- S. P. Chesters, M. W. Armstrong and M. Fazel, Desalin. Water Treat., 2015, 55, 2900–2908 CAS
.
- M. Fazel and S. Chesters, Desalin. Water Treat., 2015 Search PubMed
.
- G. Marrucci, Chem. Eng. Sci., 1969, 24, 975–985 CrossRef CAS
.
- M. Jamialahmadi and H. Mullersteinhagen, Chem. Eng. J., 1992, 50, 47–56 CrossRef CAS
.
- M. Mayer, R. Braun and W. Fuchs, J. Membr. Sci., 2006, 277, 258–269 CrossRef CAS
.
- G. Schock and A. Miquel, Desalination, 1987, 64, 339–352 CrossRef CAS
.
- M. Corbatón-Báguena, S. Álvarez-Blanco and M. Vincent-Vela, Sep. Purif. Technol., 2014, 125, 1–10 CrossRef
.
- S. T. Weinman and S. M. Husson, J. Membr. Sci., 2016, 513, 146–154 CrossRef CAS
.
- M. Mayer, R. Braun and W. Fuchs, J. Membr. Sci., 2006, 277, 258–269 CrossRef CAS
.
- E. Camarasa, C. Vial, S. Poncin, G. Wild, N. Midoux and J. Bouillard, Chem. Eng. Process., 1999, 38, 329–344 CrossRef CAS
.
- V. Geraldes, V. Semiao and M. N. de Pinho, J. Membr. Sci., 2002, 203, 87–102 CrossRef CAS
.
- T. Wang, Z. Zhang, X. Ren, L. Qin, D. Zheng and J. Li, Sep. Purif. Technol., 2014, 125, 275–283 CrossRef CAS
.
- E. Lee, Y. Kim, H. Kim and A. Jang, Environ. Sci. Pollut. Res., 2015, 22, 8451–8459 CrossRef CAS PubMed
.
- T. Watabe, K. Matsuyama, T. Takahashi and H. Matsuyama, Desalin. Water Treat., 2016, 57, 9558–9568 CrossRef CAS
.
- J. L. Xu, Int. J. Heat Fluid Flow, 1999, 20, 422–428 CrossRef
.
| This journal is © The Royal Society of Chemistry 2017 |

