
 Open Access Article
 This Open Access Article is licensed under a
 Creative Commons Attribution 3.0 Unported Licence
Characterization of Chlorella vulgaris and Chlorella protothecoides using multi-pixel photon counters in a 3D focusing optofluidic system
Jonathan B. Vander Wiela,
Jonathan D. Mikulicza,
Michael R. Boysena,
Niloofar Hashemib,
Patrick Kalgrena,
Levi M. Naumana,
Seth J. Baetzolda,
Gabrielle G. Powella,
Qing Hea and
Nicole Nastaran Hashemi *ac
*ac
aDepartment of Mechanical Engineering, Iowa State University, Ames, IA 50011, USA
bDepartment of Materials Science and Engineering, Sharif University of Technology, Tehran, Iran
cCenter for Advanced Host Defense Immunobiotics and Translational Comparative Medicine, Iowa State University, Ames, IA 50011, USA. E-mail: nastaran@iastate.edu
First published on 16th January 2017
Abstract
Analysis of microparticle size and fluorescence intensity can be used to classify microparticles. We designed and fabricated an optofluidic system that characterizes microparticles, including fluorescent microparticles and microalgae. A new type of multi-pixel photon counter (MPPC) was employed to miniaturize the device, lower its power consumption, and make it insensitive to magnetic fields. The system uses a 635 nm laser for excitation of the microparticles' fluorescence. The scattered light from the fluorescent microparticles, as well as Chlorella vulgaris and Chlorella protothecoides, were measured. Additionally, we analyzed the width and height of the measured signals generated as a result of microparticles and microalgae passing through the interrogation region. Using this device, we distinguished fluorescent microparticles of sizes of 3.2 μm and 10.2 μm. Additionally, different types of microalgae were distinguished using this high-throughput 3D focusing system. The analysis of the experimental results also confirms the capability of the device for monitoring of algae growth over time. The unique properties of MPPC as optical detector for both laboratory and field applications are demonstrated.
1. Introduction
In the past decade, microfluidic devices have become an important analytical method in the field of biology,1 clinical-biomedical,2 and environment studies.3 Effort has been devoted to developing microfluidic systems with smaller sizes, while simultaneously increasing the throughput and reducing the cost of microfluidic chips.4 Consequently, many commercially available bench top flow cytometers, with multiple lasers and detectors, for multi-color fluorescence analysis, have been developed. Market demand is pushing development of flow cytometers with smaller footprints, less weight for potential portability, and easier operating characteristics. An example of this development is off-chip syringe pumps often used for fluidic supply control in microfluidic systems. These pumps are desirable for their stable flow behavior and the ease of use. However, they are also bulky, heavy, and consume lots of power. Micropumps and T injection systems, used as on chip pumping systems, are light, small, and have low power consumption. Their drawbacks include increased difficulty of fabrication and a decrease in the stability of the fluidic behavior.5 The miniaturized off-chip peristaltic pump is an alternative choice as a durable pumping system with smaller footprint, less weight, lower power consumption, and stable fluidic behavior.The reduction of weight, footprint, and energy consumption6 gives these microfluidic devices characteristics that allow for field usage. These devices are not only suitable for routine laboratory analysis, but they are also a good option for safely monitoring and analyzing potential toxins using remote monitoring. The flow cytometer, which is one of the more commonly used microfluidic devices for testing and monitoring, is organized by four systems: the microfluidic channel for focusing the particles to be analyzed, a pumping system for injecting sample fluid into the microfluidic channel, a detection system for distinguishing the individual particles and generating output signals, and measurement circuitry for data collection and analysis. The microfluidic channel can significantly increase the detection sensitivity by hydrodynamically sorting and focusing the particles in sample fluid. Different methods have been previously used to sort and focus particles in the microfluidic channels. The mechanism of lateral migration has been used to manipulate randomly distributed particles in order to sort microparticles in straight rectangular sections.7 Affected by inertial lifting forces, caused by the channel wall, randomly distributed particles in sample fluid can be sorted in a straight microfluidic channel. The sizes of particles that can be sorted by the microfluidic channel however is limited by the size and shape of the microfluidic channel. Introducing sheathing flow to focus the sample flow is an excellent option due to the ability to adjust the sample flow size, thereby adjusting the ratio of sample to sheath flow rates. An alternative for focusing the sample stream, in a flow cytometer, is the introduction of secondary flow in the straight channel by means of grooves and herringbones on the channel walls.8 The grooves and herringbone's shape can focus the sample flow without introducing extra sheath flow. Additionally, the symmetric cross-section change of grooves and herringbones can reverse the flow stream completely. This allows the sample flow to be unsheathed and then the sheath flow to be recycled for flow cytometer in situ applications.
Several sensing methods can be integrated with microfluidic devices including electrical, electrochemical, optical, piezoelectric and thermal sensors.9 Amongst all these options, optical sensors have distinct advantages, especially their high detection sensitivity and reliability10 when analyzing small amounts of samples.11 These optical sensors can provide a variety of detection platforms, including fluorescence illumination,12 extinction13 and scattering measurements14 for relevant analysis of sample parameters. Many types of optical sensors have been employed in flow cytometers to enable accurate detection and small footprints for flow cytometers. Photomultiplier tubes (PMT) are commonly used for high sensitivity and high speed acquisition, however PMTs are relatively large. Avalanche photodiodes (APD) benefit from their small size, internal gain mechanism, fast response time, low dark current, their ability to be unaffected by magnetic fields. All these benefits make APDs the only choice when using weak light and high magnetic fields. One major disadvantage of APDs is it is only capable of detecting single photons. The multi-pixel photo counter (MPPC) is a new type of photo-counting device made up of an array of APDs with a significantly smaller size than a PMT. The output of a MPPC consists of the sum of each APD pixel. This characteristic enables the MPPC to detect single photons and pulses of multiple photons. The MPPC features a high multiplication ratio (gain), high photon detection efficiency, fast response, excellent time resolution, and a wide spectral response range so it delivers the high-performance level needed for photon counting.15 Comparing the MPPC to traditional optical sensors like PMTs, it has similar photo detection efficiency ranges. The internal gain of the MPPC and PMT are similar, however the time response is optimized in the MPPC. The MPPC is also immune to magnetic fields, highly resistant to mechanical shock, and, unlike the PMT, it will not suffer from “burn-in” by incident light saturation. All these advantages are unique to solid-state devices resulting in the MPPC being a strong potential option for optical sensors that have a high throughput, high sensitivity, and potential for miniaturization.
In this paper, a portable optofluidic system, capable of 3D focusing of the sample stream, equipped with a MPPC, is presented. Two sheath flows on both sides of the microfluidic channel are introduced to focus the sample stream horizontally followed by chevrons on the top and bottom of the microfluidic channel that are employed to focus the sample flow vertically in the interrogation region. The width of the sample stream can be controlled by changing the relative sample flow and sheath flow rates. The fluorescence emitting from the laser excited microparticles is detected by the MPPC when passing through the interrogation region. To excite the microparticles, the excitation laser is provided by a 635 nm diode-pumped solid-state laser. This laser, provided a convergent light source, and unlike traditional argon-ion gas laser which is larger, requires cooling and is power intensive. Because of this power requirement, the diode and diode-pumped solid-state laser is suitable for a portable device. We have studied the effect of the sheath-to-sample flow rate on the mean, coefficient of variations (CVs) of fluorescence intensity, and the effects on tested event count to theoretical event count. The device was used to distinguish fluorescent microbeads with different sizes, microalgaes, and microbeads with different fluorescence intensity. The experimental results show that our system has the potential to monitor the growth of microalgae.
2. Experimental details
2.1 Microfluidic design
The microfluidic channel was manufactured in polydimethylsiloxane (PDMS) (Dow Corning Corporation, Midland, MI) using standard soft lithography.16 Both the sheath flow and grooves were used to focus the sample stream. The sheath flow, which is located horizontally on both sides of the sample stream, focuses the sample stream horizontally. There are four sets of chevron shaped grooves embedded in the top and bottom of both the inlet and outlet side of the microfluidic channel which can focus the sample stream vertically on the inlet side and then unsheathe the sample flow on the outlet side. The sheath-to-sample flow rates determine the sample flow width, while the number of chevrons determines the height of the sample flow. The width and height of the channel are designed to be 390 μm and 130 μm respectively. The dimensions of chevron-shaped grooves are 100 μm wide and 65 μm deep, and the angle of chevrons are 45 degrees.17 Silicon tubes (Upchurch Scientific, Oak Harbor, WA) are used to connect inlets of the microfluidic channels and pumps. A syringe pump (Cole-Parmer, Vernon Hills, IL) is employed to inject sample flow into the microfluidic channel. Sheath flow was introduced into sheath flow channels on both sides of the sample flow by a bidirectional peristaltic pump (P625/66.143, Instech Laboratories, Inc., Plymouth, PA) with a Y connection to split the fluid flow. Sky blue fluorescent microbead solution (Spherotech Inc., Lake Forest, IL) was used to test the function of the system. The sky blue fluorescent microbeads have an excitation peak at 675 nm and an emission peak of 700 nm.2.2 Optical detection system
The sample stream was focused at the center of the microfluidic channel when passing through the interrogation region. Microparticles in the sample stream were excited by the 635 nm diode laser light (LAS 390-635-35, Laser Max, Rochester, NY) and emission fluorescence. Guide channels fabricated on the microfluidic chip were used to guide optical fibers to the interrogation region. Multiple guide channels have been fabricated on the microfluidic chip to enable the forward/side scattering (FSC/SSC) measurement for future research. Custom wavelength division multiplexing (WDM) fiber optic couplers (fiber instrument sales Inc., Oriskany, NY) with a numerical aperture were introduced to guide light into the interrogation region, collect the fluorescent signal, and direct the light onto the surface of the MPPC (S10362-33-100C, Hamamatsu Company, Japan) (Fig. 1).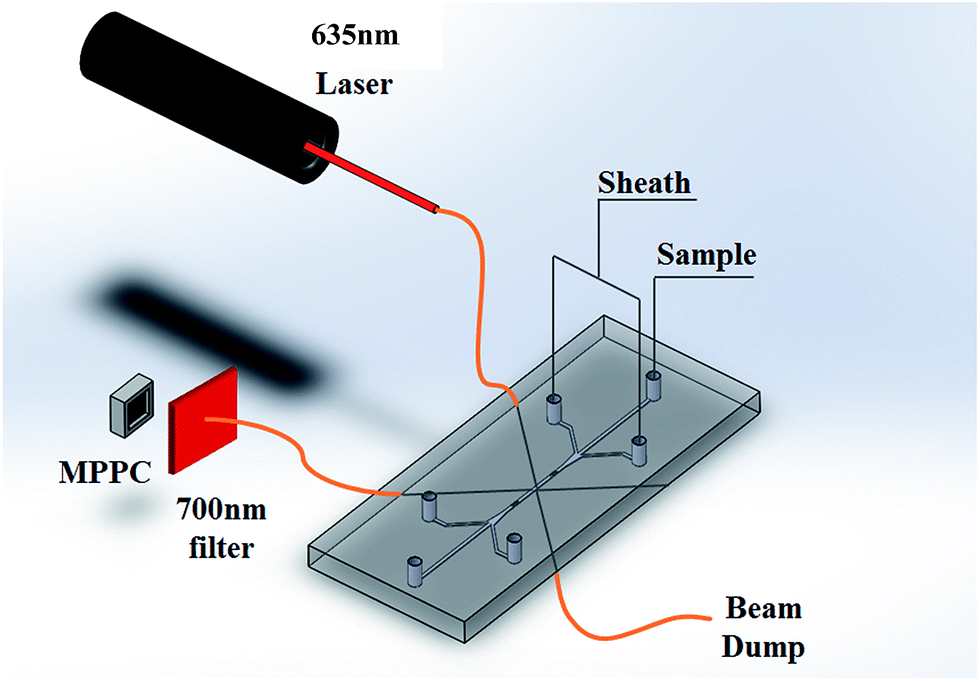 | ||
| Fig. 1 Optical and microfluidic components of the high-throughput 3D focusing system. | ||
The operation principles and basic performance is summarized by K. Yamamoto.18 The MPPC is a type of photon-counting device using multiple APDs. When the reverse voltage applied to an APD is higher than the breakdown voltage, the APD is in Geiger mode. In Geiger mode, the electric field in the APD will obtain a large discharge output when detecting even a single photon. The internal amplification of the MPPC can reach as high as 105 to 106 times, comparable to that of PMT. However, the performance of the MPPC is limited by the number of APDs in each MPPC. Each pixel in the MPPC outputs only one pulse when it is triggered and this does not vary with the number of incident photons. Each pulse generated by the pixels is at the same amplitude when it detects a photon, and the pulses generated by multiple pixels are superimposed onto each other. So the detected photons are limited by the size of the MPPC. Additionally, thermal electrons can trigger the MPPC to generate dark currents.15a,b Nevertheless, the advantages of the MPPC make it a promising potential alterative as an optical sensor in flow cytometry.
In our sensor, the reverse voltage to put the MPPC in Geiger mode is supplied by two power supplies connected in series to produce about 70 V (HY3005-3 DC Power Supply, San Jose, CA). The circuitry for signal collection is powered by a separate typical 5 V power supply. The optical fibers are cleaved and inserted into the optical fiber guide in the PDMS chips. The excitation optical fiber is 45 degrees to the microfluidic channel, while the fluorescence is collected 90 degrees to the excitation light source. A beam-dump fiber positioned at 180 degrees to the excitation light is used to collect scattered excitation light to reduce the background light. A 700 ± 10 nm filter (Thorlabs Inc., Newton, New Jersey, USA) is used for fluorescence detection to filter out background light. The output amperage generated by the MPPC was passed through a trans-impedance amplifier and the resultant voltage was sent to a personal computer by data acquisition (DAQ) unit (NI USB-6351, National Instrument, Austin, TX) with a USB cable. The data was collected at a frequency of 10 kilo-samples per second (kSPS). LabVIEW software, coupled with the DAQ unit, was used to monitor and visualize the testing process.
2.3 Microalgae
Algae are the main components of freshwater and marine ecosystems, and because of their sensitivity to environmental changes, they have been extensively used to evaluate the effect of contaminants on biodiversity.The algae species used in this study are Chlorella vulgaris (UTEX 395) and Chlorella protothecoides (UTEX B 25). The strains were obtained from the University of Texas (Austin, TX, USA). Chlorella is a unicellular green microalga. It is a spherically shaped algae with a size range of 2 μm to 10 μm. Chlorella has a cup-shaped chloroplast located in the cytoplasm peripherally, and the chloroplast occupies about half of the cell volume. Chlorella contains two classes of Chlorophyta, including Chlorophyceae and Trebouxiophyceae.19 Chlorella has been used for environmental monitoring applications and is also a promising biofuel source.20
C. vulgaris has been used as an indicator of the toxicity of zinc in bodies of water. In a high Zn2+ level water environment, the growth of C. vulgaris was significantly inhibited. As a result, monitoring of the growth of C. vulgaris can reflect the Zn2+ toxicity in water environment.21 Much research has been done to study the effects of environmental factors on the growth of Chlorella, which is a promising bio-fuel source.22 As a result, a fast response, small size optofluidic system, which has the ability to monitor the microalgae concentration, also has the potential to monitor the toxicity in a water environment. The capability of monitoring algal size distributions would make the device a useful tool for researchers to study the combination of complicated environmental factors on the algae growth.
Chlorella are grown in liquid TAP media at 25 °C under 5% CO2 for 4–5 days with moderate light for 4–5 days. After 4–5 days of cultivation, 5% CO2 supply is stopped and the algae samples are ready for test by the optofluidic system.
3. Results and discussions
In this study, the MPPC output signal of the fluorescent microparticles, as the measurable parameter for indicating the size and fluorescent intensity of microbeads, was studied. The fluorescent particle sample, with diameter of 3.2 μm and concentration of 1 × 10⁶ beads per mL, was used to examine the relationship between flow rate and the function of the flow cytometer. The sheath flow rate was fixed at 400 μL min−1, and different sample flow rates were tested. In order to test the micro particles individually, microbeads samples were ultrasonically treated for 5 minutes to separate and resuspend the microbeads. After suspension, the solution was injected into the microfluidic channel by a syringe-pump. As the sample flow allowed microbeads to flow through the channel, the fluorescent microbeads were excited by the laser and the photon emission of the microbead was detected by MPPC. As each microbead passes through the interrogation region, the detected emission formed a peak on the signal output. The experimental data was collected by LabView, and a data processing program based on Matlab was used to determine the width and integral signal strength for each peak. A threshold was set to eliminate the background noise when analyzing the signal output. The threshold was set to be 0.1 V above the highest level of background noise to eliminate all the noise peaks that were not caused by microbeads this caused some signal peaks caused by microbeads to be eliminated while using this method of removing background noise.3.1 Effect of sheath-to-sample flow rates
The fluorescent particle sample with diameter of 3.2 μm and concentration of 1 × 10⁶ beads per mL was used to test the relationship between flow rate and the function of the flow cytometer. The sky blue fluorescent microbeads are strongly excited when introduce to a light source at 675 nm. A significant fluorescence at 700 nm was observed. A band filter in front of the MPPC filtered out background light to ensure only fluorescence reached the MPPC. Each pixel in the MPPC generates the same amplitude when it detects a photon. As the fluorescence of each microparticle is detected by MPPC, multiple pulses generated by each pixel superimpose onto each other and form a peak in signal output. The signal width and integrated signal strength for each peak were analyzed as parameters to reflect the size and fluorescent strength of the microparticles.The effect of flow rate ratio of core flow to sheath flow has been studied. The mean and CV's of signal strength and signal width as well as the rate of tested event to theoretical event were studied with the flow rate ratio change. The sheath flow rate has been fixed at 400 μL min−1 with varying sheath flow rates being used in the experiment. The laser beam intensity is a Gaussian distribution across the sample stream at the interrogation region. When the sample stream is hydrodynamically focused in a confined region, the microparticles can receive a more uniform beam intensity.23 When increasing the sample flow rate, the area of sample flow would also increase. As shown in Table 1, with the sample flow rate increasing from 5 to 10 to 15 μL min−1, the CV of signal strength and signal width are increasing. This is due to the cells distributed in the sample stream receiving a less uniform laser excitation when passing through the interrogation region. The slightly pulsed peristaltic pump and syringe pump might also cause the elevation of CV for experiment results. As the concentration of sample solution was 1 × 10⁶ beads per mL, signal peaks overlapping were observed at 15 μL min−1, which would explain the elevated CV for the 15 μL min−1 sample flow rate results.
| Sample flow rate (μL min−1) | Mean signal strength (V) | Signal strength CV | Mean signal width (10−4 s) | Signal width CV | Event count | Tested even rate |
|---|---|---|---|---|---|---|
| 5 | 0.171 | 0.593 | 11.651 | 0.272 | 796 | 0.170 |
| 10 | 0.191 | 0.641 | 11.825 | 0.321 | 2062 | 0.449 |
| 15 | 0.221 | 0.786 | 11.951 | 0.467 | 4557 | 0.548 |
The fluorescent microbeads have higher density than water, so when diluted microbeads are introduced into the deionized water, the microbeads have the tendency to sediment with time. Sample solution was subject to vortex and ultrasonic stimulation before being injected into the sample flow channel to re-suspend sediment and attached microbeads. After the microbeads were injected into the microchannel, the sediment rate of microbeads becomes related to sample flow rate. Higher flow rates can provide higher lift and drag forces on the particle to prevent sedimentation. Experimental results show that the rate of tested event to theoretical event is increasing with sample flow rate, which could be explained by lower sediment rate in higher flow rate. The tested event rates that are lower than 55% may be explained by both sediment and signal peaks that were gated out by the threshold.
To get comparably high rates of tested event to theoretical event and low CV for signal strength and width, experiments are conducted with 10 μL min−1 sample flow rate in the following experiments.
3.2 Discrimination of particles with different sizes
To test the capability of discriminating different sized particles, 10.2 μm and 3.2 μm sky blue fluorescent microbeads samples were tested. Fig. 2 shows a distinct difference between 3.2 μm and 10.2 μm microbeads in signal peak height, which provides a simple way to discriminate microbeads with different sizes. The peak width of each signal was plotted against the peak height. The plot shows that the data point clusters of 3.2 μm microbeads and 10.2 μm microbeads are distributed at different regions, as both the signal peak width and signal peak strength are related to the size of the microparticles.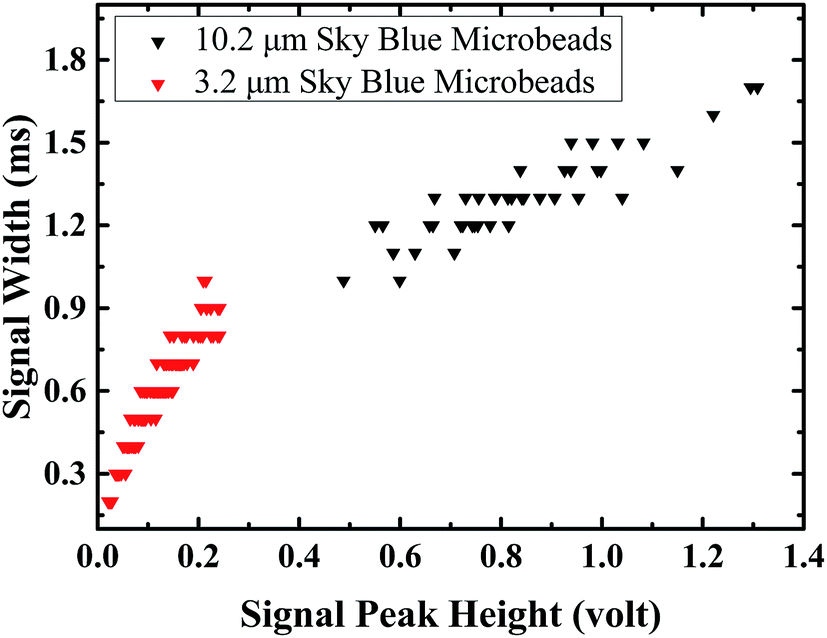 | ||
| Fig. 2 Signal peak width against signal peak height of 3.2 μm microbeads and 10.2 μm microbeads. The data point clusters of 3.2 μm microbeads and 10.2 μm microbeads are distributed at different regions. | ||
To compare the signal peaks, the signal height and signal width frequency distributions are plotted on the histogram (Fig. 3). The distribution of 3.2 μm particles and 10.2 μm particles are clearly separated in two separate distributions. The distribution of signal peak widths and height for 10.2 μm particles fits the normal distribution, while the distribution of signal peak widths and height for 3.2 μm particles are missing the left tail of the normal distribution. This is possibly explained by the weak signals that are missing during the signal collection and processing, as well as being removed by the background noise threshold criteria.
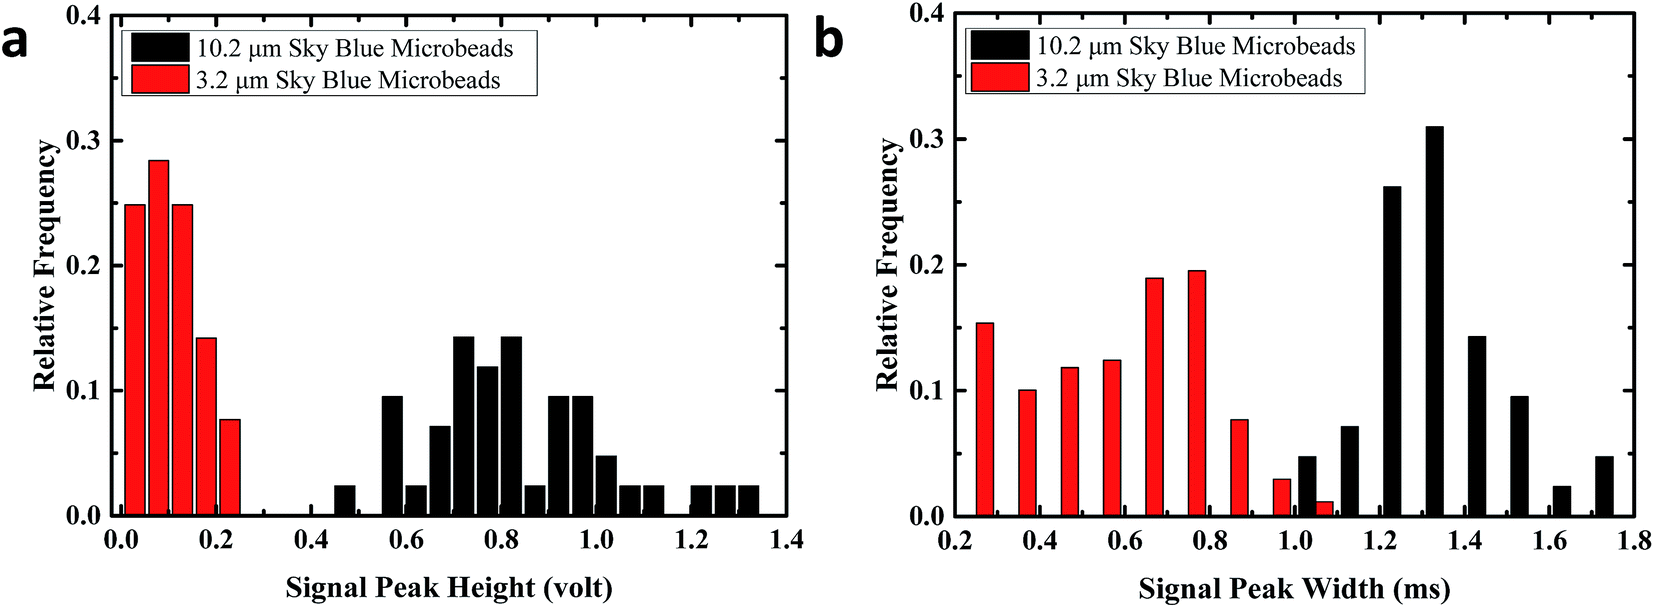 | ||
| Fig. 3 (a) Signal peak height frequency distribution of 3.2 μm microbeads and 10.2 μm microbeads. (b) Signal peak widths frequency distribution of 3.2 μm microbeads and 10.2 μm microbeads. Both the signal peak height and the signal widths distribution of 3.2 μm particles and 10.2 μm particles are clearly separated in two main areas. | ||
3.3 Discrimination of microalgae with different sizes and fluorescence intensities
The flow cytometer capability of discriminating microparticles with different characteristics is validated. More experiments were conducted to compare the distribution of signal peak width and signal height of C. vulgaris and C. protothecoides. C. vulgaris has an average diameter around 3 μm, C. protothecoides has an average diameter around 6 μm. The signal width and signal strength are rough indications of the sizes of the microbeads and are affected by the structure and pigment of the microparticles. As shown in the frequency distribution of signal width (Fig. 4), Chlorella, with size ranging from 2 μm to 10 μm, has a signal width from 0.2 ms to 1.1 ms. This is similar to the signal width range of 3.2 μm microbeads. Since fluorescent microbeads had higher fluorescence under laser light excitation, it shows a similar signal width and strength range as Chlorella which have a larger size. The frequency distribution of signal width and strength for 3.2 μm microbeads, for the C. vulgaris and the C. protothecoides, do not fit the normal distribution. The missing left tails were observed for all the histograms of signal peak width and height distribution. It may be caused by weak signals that were gated out by the threshold or by weak signals that are missed during the signal collection and processing. Although there may be some data missing, the obvious differences of distribution peaks can be observed indicating the different size and fluorescence strength of 3.2 μm microbeads for the C. vulgaris and the C. protothecoides.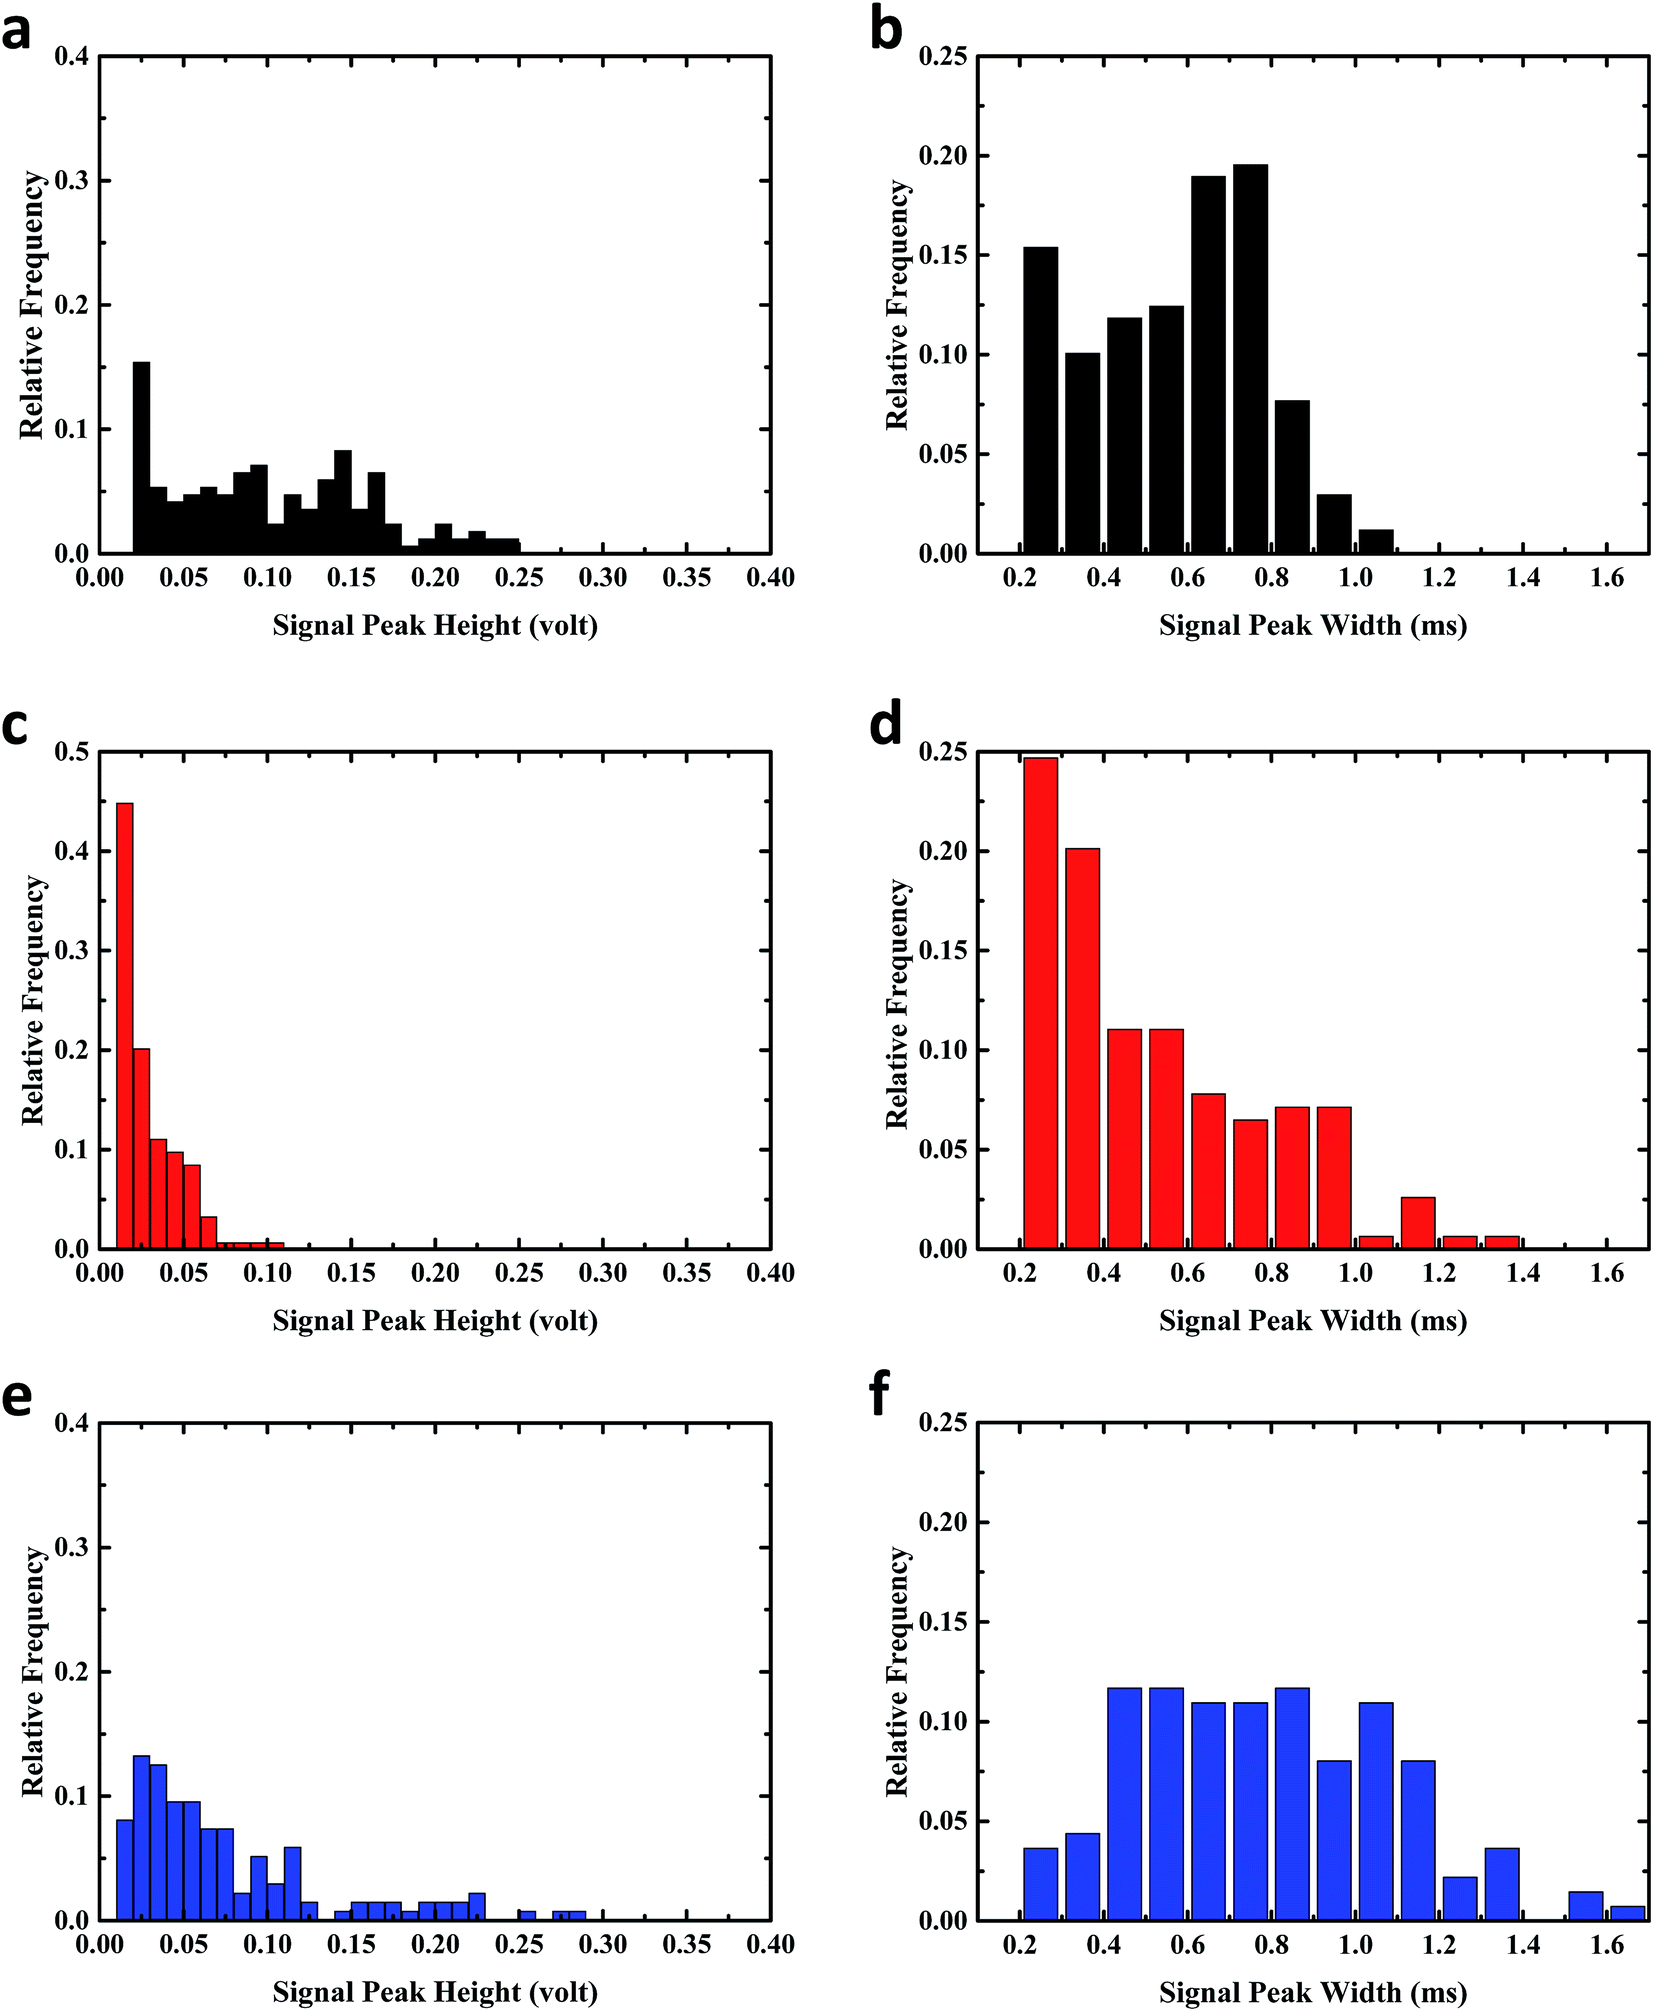 | ||
| Fig. 4 (a and b) Signal peak heights and signal peak widths frequency distribution of 3.2 μm microbeads. (c and d) Signal peak heights and signal peak widths frequency distribution of Chlorella vulgaris. (e and f) Signal peak heights and signal peak widths frequency distribution of Chlorella protothecoides. The signal peak height and the signal widths distribution of 3.2 μm particles, Chlorella vulgaris and Chlorella protothecoides are different. | ||
The signal peak widths to signal peak heights can indicate the fluorescent strength of the microparticles. The plot of peak width against the peak height for C. vulgaris, C. protothecoides, and the 3.2 μm microbeads (Fig. 5) shows that data point clusters of microalgae and 3.2 μm microbeads are distributed at different regions, seeing as the fluorescent emission strength under the 635 nm laser are different. Microbeads with a higher fluorescent strength have a distinguished distribution at the lower region of the plot of peak width against peak height.
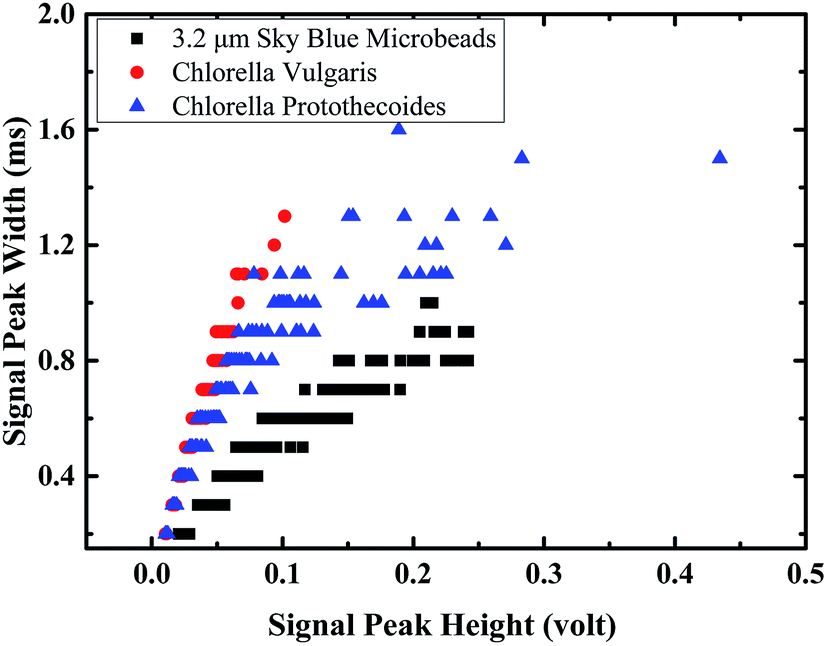 | ||
| Fig. 5 Signal peak widths to signal peak heights of 3.2 μm microbeads the Chlorella vulgaris and the Chlorella protothecoides. Data cluster of 3.2 μm microbeads is distributed at different region as Chlorella vulgaris and the Chlorella protothecoides. | ||
4. Conclusions
We have designed a sensitive and high-throughput 3D focusing optofluidic system equipped with a multi-pixel photon counter (MPPC) for analysis of microalgae. Both sheath flow and grooves on the micro channel were used to focus the sample flow horizontally and vertically at the center of the channel when samples pass through the interrogation region. Only very small amounts (less than 500 μL) of sample solution are needed for each fast response high resolution analysis. The MPPC is used as the new type of photodetector employed in our device. The application of an MPPC reduced the size and power consumption of the system and additionally made it resistant to magnetic fields. Microbead solutions and algae solutions were used to test the function of the device. Sample solution was injected into the microchannel and focused by sheath flow and grooves when passing through the interrogation region. Microparticles in the interrogate region were excited by a 635 nm laser, and the fluorescence of microparticles was collected by optical fibers and transmitted to the MPPC. Signals generated by MPPC were collected by a DAQ and analyzed. Experimental results showed that the device is capable of distinguishing microparticles with different sizes and fluorescent intensities. Particles with larger sizes or higher fluorescent intensities generated larger signal width and higher signal height. The results show that the system has potential to be used to monitor algal growth.Acknowledgements
We acknowledge useful interactions with Professor Martin Spalding and for providing us algae strains. The authors thank David Wright for assistance with algae samples and Pouya Asrar for his assistance during the project. This work was partially supported by the William March Scholar program and Iowa State University Bioeconomy Institute (BEI) Leading the Bioeconomy Graduate Fellowship.References
- (a) J. Wang, J. Zima, N. S. Lawrence, M. P. Chatrathi, A. Mulchandani and G. E. Collins, Anal. Chem., 2004, 76, 4721–4726 CrossRef CAS PubMed; (b) F. Sharifi, B. B. Patel, A. K. Dzuilko, R. Montazami, D. S. Sakaguchi and N. Hashemi, Biomacromolecules, 2016, 17, 3287–3297 CrossRef CAS PubMed.
- (a) L. J. Kricka, Clin. Chem., 1998, 44, 2008–2014 CAS; (b) A. Obubuafo, S. Balamurugan, H. Shadpour, D. Spivak, R. L. McCarley and S. A. Soper, Electrophoresis, 2008, 29, 3436–3445 CrossRef CAS PubMed; (c) C. Meis, R. Montazami and N. Hashemi, Anal. Methods, 2015, 7, 10217–10223 RSC; (d) D. Sechi, B. Greer, J. Johnson and N. Hashemi, Anal. Chem., 2013, 85, 10733–10737 CrossRef CAS PubMed.
- (a) S. Weagant and V. Karanassios, Anal. Bioanal. Chem., 2009, 395, 577–589 CrossRef CAS PubMed; (b) J. Do, S. Lee, J. Han, J. Kai, C.-C. Hong, C. Gao, J. H. Nevin, G. Beaucage and C. H. Ahn, Lab Chip, 2008, 8, 2113–2120 RSC; (c) N. Hashemi, J. M. Lackore, F. Sharifi, P. J. Goodrich, M. L. Winchell and N. Hashemi, Technology, 2016, 04, 98–103 CrossRef; (d) A. Schaap, Y. Bellouard and T. Rohrlack, Biomed. Opt. Express, 2011, 2, 658–664 CrossRef PubMed; (e) D. Spencer, G. Elliott and H. Morgan, Lab Chip, 2014, 14, 3064–3073 RSC.
- (a) D. Janasek, J. Franzke and A. Manz, Nature, 2006, 442, 374–380 CrossRef CAS PubMed; (b) A. Ros, W. Hellmich, J. Regtmeier, T. T. Duong and D. Anselmetti, Electrophoresis, 2006, 27, 2651–2658 CrossRef CAS PubMed; (c) C. E. Sims and N. L. Allbritton, Lab Chip, 2007, 7, 423–440 RSC; (d) P. J. Goodrich, F. Sharifi and N. Hashemi, RSC Adv., 2015, 5, 71203–71209 RSC.
- (a) H. T. G. Vanlintel, F. C. M. Vandepol and S. Bouwstra, Sens. Actuators, 1988, 15, 153–167 CrossRef; (b) J. L. Beckers, T. Verheggen and F. M. Everaerts, J. Chromatogr., 1988, 452, 591–600 CrossRef CAS.
- L. Fermin Capitan-Vallvey and A. J. Palma, Anal. Chim. Acta, 2011, 696, 27–46 CrossRef PubMed.
- G. Segre and A. Silberberg, Nature, 1961, 189, 209–210 CrossRef.
- A. Stroock, Science, 2002, 295, 647–651 CrossRef CAS PubMed.
- A. Jang, Z. Zou, K. K. Lee, C. H. Ahn and P. L. Bishop, Meas. Sci. Technol., 2011, 22, 032001 CrossRef.
- D. Huh, W. Gu, Y. Kamotani, J. B. Grotberg and S. Takayama, Physiol. Meas., 2005, 26, R73–R98 CrossRef PubMed.
- K. B. Mogensen and J. P. Kutter, Electrophoresis, 2009, 30, S92–S100 CrossRef PubMed.
- (a) Y. C. Tung, M. Zhang, C. T. Lin, K. Kurabayashi and S. J. Skerlos, Sens. Actuators, B, 2004, 98, 356–367 CrossRef CAS; (b) L.-M. Fu, C.-H. Tsai and C.-H. Lin, Electrophoresis, 2008, 29, 1874–1880 CrossRef CAS PubMed.
- A. Kummrow, J. Theisen, M. Frankowski, A. Tuchscheerer, H. Yildirim, K. Brattke, M. Schmidt and J. Neukammer, Lab Chip, 2009, 9, 972–981 RSC.
- J. P. Golden, J. S. Kim, J. S. Erickson, L. R. Hilliard, P. B. Howell, G. P. Anderson, M. Nasir and F. S. Ligler, Lab Chip, 2009, 9, 1942–1950 RSC.
- (a) T. Kato, J. Kataoka, T. Nakamori, T. Miura, H. Matsuda, A. Kishimoto, K. Sato, Y. Ishikawa, K. Yamamura, S. Nakamura, N. Kawabata, H. Ikeda, S. Yamamoto and K. Kamada, Nucl. Instrum. Methods Phys. Res., Sect. A, 2013, 699, 235–241 CrossRef CAS; (b) T. Nakamori, T. Kato, J. Kataoka, T. Miura, H. Matsuda, K. Sato, Y. Ishikawa, K. Yamamura, N. Kawabata, H. Ikeda, G. Sato and K. Kamada, J. Instrum., 2012, 7, 14 Search PubMed; (c) P. Asrar, M. Sucur and N. Hashemi, Biosensors, 2015, 5, 308–318 CrossRef PubMed.
- D. C. Duffy, J. C. McDonald, O. J. A. Schueller and G. M. Whitesides, Anal. Chem., 1998, 70, 4974–4984 CrossRef CAS PubMed.
- (a) N. Hashemi, J. S. Erickson, J. P. Golden, K. M. Jackson and F. S. Ligler, Biosens. Bioelectron., 2011, 26, 4263–4269 CrossRef CAS PubMed; (b) Z. Bai, J. M. Mendoza Reyes, R. Montazami and N. Hashemi, J. Mater. Chem. A, 2014, 2, 4878–4884 RSC; (c) F. Sharifi, Z. Bai, R. Montazami and N. Hashemi, RSC Adv., 2016, 6, 55343–55353 RSC.
- K. Yamamoto, K. Yamamura, K. Sato, T. Ota, H. Suzuki and S. Ohsuka, 2006 IEEE Nuclear Science Symposium Conference Record, 2006, vol. 1–6, pp. 1094–1097 Search PubMed.
- A. Richmond and Q. Hu, Handbook of microalgal culture: applied phycology and biotechnology, John Wiley & Sons, Chichester, UK, 2013, p. xvi + 719 Search PubMed.
- (a) X. L. Miao and Q. Y. Wu, J. Biotechnol., 2004, 110, 85–93 CrossRef CAS PubMed; (b) H. Xu, X. Miao and Q. Wu, J. Biotechnol., 2006, 126, 499–507 CrossRef CAS PubMed; (c) W. Xiong, X. F. Li, J. Y. Xiang and Q. Y. Wu, Appl. Microbiol. Biotechnol., 2008, 78, 29–36 CrossRef CAS PubMed.
- H. Yang, Z.-Y. Huang, J. Li and Y. Hu, Ecol. Indic., 2014, 45, 103–109 CrossRef CAS.
- X. Mao, A. A. Nawaz, S.-C. S. Lin, M. I. Lapsley, Y. Zhao, J. P. McCoy, W. S. El-Deiry and T. J. Huang, Biomicrofluidics, 2012, 63, 024113 CrossRef PubMed.
- N. Hashemi, J. S. Erickson, J. P. Golden and F. S. Ligler, Biomicrofluidics, 2011, 5, 032009 CrossRef PubMed.
| This journal is © The Royal Society of Chemistry 2017 |