DOI:
10.1039/C6RA25754B
(Paper)
RSC Adv., 2017,
7, 9402-9411
A novel perspective for techno-economic assessments and effects of parameters on techno-economic assessments for biodiesel production under economic and technical uncertainties
Received
24th October 2016
, Accepted 7th January 2017
First published on 1st February 2017
Abstract
Various parameters, such as biodiesel price, capital cost, interest rate, operating cost, feedstock price, maintenance rate, biodiesel conversion efficiency and glycerol price, may exhibit variation in the techno-economic assessments of biodiesel production within the project's lifetime due to economic and technical uncertainties. This paper first defines a new indicator for techno-economic assessments of biodiesel production when all uncertain parameters are regarded as being uniformly distributed within their variation ranges. This new indicator is named economical infeasibility probability (EIP), which defines the probability that total profit, payback period and net present value (NPV) of biodiesel production or one of them or two of them do not satisfy the prescribed requirements, and the Monte Carlo Simulation (MCS) method is employed to evaluate EIP. Based on economical infeasibility analysis, the sensitivity analysis of EIP with respect to an individual uncertain parameter is defined, and MCS is utilized to evaluate the effect. It is found that EIP for the studied biodiesel production is 0.3676 under the selected distributions of uncertain parameters, and biodiesel price, feedstock price, biodiesel conversion efficiency and operating cost have significant effects on EIP, while capital cost, maintenance rate, interest rate and glycerol price have negligible effects.
1. Introduction
Many deleterious emissions, such as NOx, greenhouse gases, hydrocarbons and particulate matter, are yielded by the burning of fossil fuels in engines. These harmful substances have caused various adverse impacts on the global climate, environment and local air quality.1–3 In order to reduce such negative effects, many researchers are seeking alternative clean, economic and easy-to-use energy sources. Biodiesel is such an important renewable fuel, which has better environmental friendliness than the conventional fossil fuels.4–7 Many studies have reported biodiesel production using various feedstocks: palm oil,8 vegetable oils,9 waste cooking oil,10 Jatropha curcas L,11 soybean oil,12 etc.
Biodiesel industry is growing rapidly, but various uncertain factors such as variability in feedstock and biodiesel price, can bring about the instability of biodiesel production,13 and can further affect the economical feasibility of biodiesel production. In order to decrease the effects of these factors and obtain a comprehensive understanding on the economical feasibility of biodiesel production, many studies have reported the techno-economic assessments (TEAs) of biodiesel production.14–20 These works have promoted the advancement of the TEAs of biodiesel production with the precondition that all of the parameters were assumed as constants within the project's lifetime. In practical, considering these parameters as constants may not be rational due to the fact that there are numerous inevitable economic and technical uncertainties involved in the TEAs of biodiesel production within the project's lifetime,13 such as the variability in the feedstock and biodiesel prices21 and the variation of the interest rate.22 Some researchers have investigated the TEAs of biodiesel production subjected to uncertain parameters.23–25 They have found that the uncertainties in the parameters can considerably affect the TEAs. The authors also analysed the effects of uncertainties on the TEAs of biodiesel production and identified the key parameters.26
Based on the previous study of the authors,26 this paper will further perform the TEAs of biodiesel production from another perspective. The investment for biodiesel production desires larger net present value (NPV), more total profit and shorter payback period. Thus, both the NPV and total profit should be larger than zero, while the payback period needs to be less than the permitted limit in terms of the economical feasibility. However, diverse economic and technical uncertainties involved in biodiesel production within the project's lifetime can give rise to the variation in the NPV, the total profit and the payback period. Thus, there is a chance that the NPV is less than zero or the total profit is less than zero or the payback period is larger than the prescribed limit, which will lead to the economical infeasibility. Then, the economical infeasibility probability (EIP) is further derived, and the effect of the uncertain parameter on the EIP is also defined and quantified. Finally, the EIP of a crude-palm-oil-derived biodiesel production are obtained, and the influential parameters are identified.
The paper is organized as follows. Section 2 introduces the TEAs of a crude-palm-oil-derived biodiesel production under eight uncertain parameters, the definition of EIP and the effects of uncertain parameters on EIP. Section 3 evaluates EIP and the effects of uncertain parameters for a crude-palm-oil-derived biodiesel production. Conclusions are drawn in Section 4.
2. Materials and methods
In this section, some important concepts in the TEAs of biodiesel production, including life cycle cost, net present value, payback period and total profit, are first introduced, and some uncertain parameters involved in the TEAs are also given. Secondly, EIP is defined when three of them (i.e., net present value, payback period and total profit) or two of them or one of them do not fulfill the permitted requirement. Then, the Monte Carlo Simulation method is introduced to carry out economical infeasibility analysis. Finally, effect of an individual uncertain parameter on EIP is defined.
2.1 Techno-economic assessments of a crude-palm-oil-derived biodiesel production
The TEAs of a crude-palm-oil-derived biodiesel production without considering the economic and technical uncertainties involved in the parameters within the project's lifetime was studied by researchers.19 Here, some basic terminologies related to the TEAs of the research are briefly introduced, and the variation ranges of parameters with uncertainties are also given.
The LCC of a crude-palm-oil-derived biodiesel production within the prescribed project's lifetime can be expressed by
| | |
LCC = CC + FC + OC + MC − SV − BPC,
| (1) |
where LCC represents the life cycle cost; CC is the capital cost; FC represents the feedstock cost; OC is the operating cost; MC denotes the maintenance cost; SV indicates the salvage value and BPC denotes byproduct credit.
In order to avoid the effect of the cash flows at different times within the project's lifetime, LCC needs to be formulated in the form of the present value, which is written by
| |
 | (2) |
where
n represents the project's lifetime,
i.e.,
n = 20 years; FC
i, OC
i, MC
i and BPC
i denote the feedstock cost, the operating cost, the maintenance cost and the byproduct credit of the
ith year, respectively;
r is the interest rate,
i.e.,
r ∈ [4.44%, 13.53%].
27
The following will provide the definitions of CC, FC, OC, MC, SV and BPC. The plant has the annual biodiesel production capacity of 50k tons, i.e., PC = 50k tons, and the corresponding capital cost varies from $9 million to $15 million, i.e., CC ∈ [$9 million, $15 million].19
FC is the major cost of biodiesel production and it generally accounts for 80–90% of LCC.28 The FC of a crude-palm-oil-derived biodiesel production is defined by
| |
 | (3) |
where FP represents the feedstock price or the crude palm oil price, which varied from $200 per ton to $1200 per ton in the past twelve years,
i.e., FP ∈ [$200 per ton, $1200 per ton];
19 FU denotes the annual total feedstock consumption; CE indicates the conversion efficiency from feedstock to biodiesel, which usually takes values from 96% to 99%,
i.e., CE ∈ [96%, 99%].
29
OC is an important ingredient of LCC and it generally comprises less than 15% of LCC within the project's lifetime.30 The OC of a crude-palm-oil-derived biodiesel production is formulated by
| |
 | (4) |
where OR represents the operating rate or the operating cost of per-ton crude-palm-oil-derived biodiesel production. Here, the percentage that FC accounts for in LCC is 80%,
28 and the percentage that OC comprises in LCC takes the value of 15%.
30 Therefore, the operating rate or the operating cost of per-ton crude-palm-oil-derived biodiesel production can be assessed as OR ∈ [$37.5 per ton, $225 per ton] by the feedstock price FP ∈ [$200 per ton, $1200 per ton].
19
The total MC of a crude-palm-oil-derived biodiesel production within the project's lifetime is given by
| |
 | (5) |
where MR is the maintenance rate. MR takes a value of 2% in some works, and it is 1% in other study.
15,19 Here, MR takes values from 1% to 2%,
i.e., MR ∈ [1%, 2%].
Salvage value (SV) is the remaining value of the components and the assets of the plant at the end of the project's lifetime. The SV of a crude-palm-oil-derived biodiesel production is expressed by
| |
 | (6) |
where
d represents the depreciation rate,
i.e.,
d = 5%;
n = 20 years denotes the project's lifetime of the plant; RC indicates the replacement cost,
i.e., RC = $10 million;
19 PWF
n represents the present worth factor in the year
n.
Glycerol is an important byproduct of a crude-palm-oil-derived biodiesel production, and the sale of glycerol can bring byproduct credit. The total byproduct credit within the project's lifetime is given by
| |
 | (7) |
where GP represents the glycerol price,
i.e., GP ∈ [$0.08 per kg, $0.2 per kg];
31 GCF is the glycerol conversion factor,
i.e., GCF = 0.0985.
19
The previous sections have defined LCC and all of the items in LCC. The following will define the total profit, the payback period and the net present value of biodiesel production. The total profit of a crude-palm-oil-derived biodiesel production within the project's time can be defined by
| | |
TotalProfit = (TBS − TAX) × n − LCC = (TBS − TAX) × 20 − LCC,
| (8) |
where TotalProfit is the total profit; TBS is the annual total biodiesel sales when all of the produced biodiesel is sold out; TAX represents the annual total taxation;
n = 20 years is the project's lifetime. TBS and TAX can be defined by
| | |
TBS = PC × 106/ρ × BP,
| (9) |
where BP is the biodiesel price,
i.e., BP ∈ [$0.66 per liter, $1.58 per liter];
32 ρ is the density of the biodiesel,
i.e.,
ρ = 0.95 kg per liter; TR = 15% represents the tax rate,
i.e., 15% of the biodiesel sales.
The payback period of a given investment is defined as the length of time required to recover the initial cost of the investment (i.e., the capital cost). The payback period of a crude-palm-oil-derived biodiesel production is defined by19
| |
 | (11) |
where PP represents the payback period of the biodiesel production; CC denotes the capital cost;
n is the project's lifetime,
i.e.,
n = 20 years.
The mathematical formula for net present value (NPV) of a crude-palm-oil-derived biodiesel production is as follows:
| |
 | (12) |
with TBS
i = TBS and TAX
i = TAX, where TBS
i and TAX
i are the total biodiesel sales and total taxation of the
ith year. Using
eqn (8)–(10), one can obtain NPV as:
| |
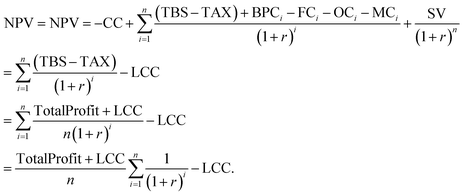 | (13) |
This section involves some uncertain parameters, as summarized in Table 1. Table 1 includes the lower and upper bounds of all of the parameters. The bounds of the capital cost (x1),19 the interest rate (x2),27 the operating rate (x3),19,28,30 the feedstock price (x4),19 the glycerol price (x5),31 the maintenance rate (x6),15,19 the biodiesel conversion efficiency (x7)29 and the biodiesel price (x8)32 are obtained by the available data. All of the uncertain parameters follow the uniform distributions within their bounds. The principle of the selected uniform distribution is given in the following paragraph.
Table 1 Bounds of uncertain parameters for a crude-palm-oil-derived biodiesel production
| Parameters |
Lower bound (xli) |
Upper bound (xui) |
| Capital cost (CC: x1)19 |
$9 million |
$15 million |
| Interest rate (r: x2)27 |
4.44% |
13.53% |
| Operating rate (OR: x3)19,28,30 |
$37.5 per ton |
$225 per ton |
| Feedstock price (FP: x4)19 |
$200 per ton |
$1200 per ton |
| Glycerol price (GP: x5)31 |
$0.08 kg−1 |
$0.2 kg−1 |
| Maintenance rate (MR: x6)15,19 |
1% |
2% |
| Biodiesel conversion efficiency (CE: x7)29 |
96% |
99% |
| Biodiesel price (BP: x8)32 |
$0.66 per liter |
$1.58 per liter |
The maximum entropy principle (MEP)33 was originally proposed to assign numerical values to probabilities in circumstances where certain particle information is available. The main idea associated with MEP is that the probability density function (PDF) of the output response can be estimated by maximizing the entropy subjected to the known partial information like the minimum, the maximum, the statistical moments and so on. In the case where only a minimum and a maximum are known for a variable, the corresponding maximum entropy distribution is a uniform distribution between the specified minimum and maximum for the variable. In this study, we only have the maximum values and minimum values for these uncertain parameters, thus the selection of uniform distribution within the specified minimum and maximum for an uncertain parameter is justified. When more statistical data are gathered, the different maximum entropy distribution may be obtained.
2.2 The definition of the economical infeasibility probability
The total profit of the investment for a crude-palm-oil-derived biodiesel production is desired to be larger than zero, i.e.,
In addition, the payback period is expected to not exceed a prescribed upper limit, i.e.,
| |
 | (15) |
where PP
u is the allowable upper limit. In this paper, PP
u takes value of one third of the project's lifetime,
i.e., PP
u =
n/3 = 20/3 years.
Further, eqn (15) can lead to eqn (16)
| |
 | (16) |
Finally, NPV should be larger than zero in order to ensure the feasibility of crude-palm-oil-derived biodiesel production plant, specifically,
| |
 | (17) |
Further, eqn (17) can lead to eqn (18)
| |
 | (18) |
Therefore, the biodiesel production should simultaneously satisfy eqn (14), (16) and (18) in order to ensure economical feasibility. For the sake of convenience, eqn (14), (16) and (18) are rewritten as
| | |
g1(x1,…, x8) = g1(x) = TotalProfit ≥ 0,
| (19) |
| |
 | (20) |
| |
 | (21) |
where
gj(
x) (
j = 1, 2, 3) represents the limit sate function;
x = (
x1,…,
x8) denotes the vector of the uncertain parameters summarized in
Table 1.
The crude-palm-oil-derived biodiesel production will not be feasible if any one of the three equations does not hold. The uncertainties in the parameters given in Table 1 will result in the variation in the NPV, TotalProfit and payback period, and then one of the three equations (i.e., eqn (19)–(21)) or two of the three equations or all of the three equations may not hold, indicating that biodiesel production is not feasible in terms of economical efficiency. Thus, in order to ensure the economical feasibility, eqn (19)–(21) should simultaneously hold, and then the economical infeasibility probability can further be defined by
| |
 | (22) |
with
| g(x) = min (g1(x), g2(x), g3(x)) |
where the notation “∩” means the intersection of sets; EIP represents the economical infeasibility probability of biodiesel production;
P{·} indicates the probability that the event occurs; min (
g1(
x),
g2(
x),
g3(
x)) is the minimum value of the set consisting of
g1(
x),
g2(
x) and
g3(
x). The following will discuss the significance associated with EIP in detail.
Probability is a measure of likelihood that an event will occur, which is quantified as a number between 0 and 1, in which 0 implies impossibility and 1 implies certainty.34 The higher the probability of an event, the more certain that the event will occur, and vice versa.34 Accordingly, EIP is a measure of likelihood that the crude-palm-oil-derived biodiesel production is economically infeasible. A lower value for EIP corresponds to the more certain that the project will be profitable under the known statistical information in Table 1, and vice versa. A value of one for EIP indicates that the project will certainly not be profitable, while a value of zero for EIP indicates that the project will certainly be profitable under the known partial statistical information in Table 1. More additional statistical data may be needed to help engineers further assess the economical feasibility of the crude-palm-oil-derived biodiesel production.
2.3 Evaluation of the economical infeasibility probability
EIP defined in eqn (22) can further be written by35| |
 | (23) |
with Ω = Ω1 × Ω2 × … × Ω8 and| |
 | (24) |
where EIP represents the economical infeasibility probability of biodiesel production; δI[g(x)] is an indicator function with δI[g(x)] = 1 if g(x) ∈ [0, +∞) and δI[g(x)] = 0 otherwise; and Ωi and pi(xi) are the sample space and the probability density function (PDF) of the ith parameter xi, respectively.
Using Monte Carlo simulation method, eqn (23) can be expressed by35
| |
 | (25) |
where
x = [
x1,…,
x8] are the uncertain parameters;
δI[
g(
x)] denotes the indicator function as defined in
eqn (24);
E[·] represents the expected value of a random variable; and
xj (
j = 1,…,
N) denotes the
jth sample generated by the pseudo-random generator according to the PDFs of the uncertain parameters
x.
2.4 Effect of an individual parameter on the economical infeasibility probability
The expected shift in the EIP due to the elimination of uncertainty in xi can be employed to measure the effect of xi on the output, which is defined bywith| | |
ΔEIP(xi) = |EIP − EIPxi|,
| (27) |
where EIP is the original economical infeasibility probability considering the uncertainties in all of the parameters; EIPxi represents the conditional economical infeasibility probability given xi; Exi[·] represents the mathematical expectation with respect to xi. ΔEIP(xi) measures the absolute difference between EIP and EIPxi, as sketched in Fig. 1. In Fig. 1, pG(g) is the original PDF of the limit state function g, and  represents the condition PDF of the limit state function g when fixing xi to
  , i.e.,
  . Meanwhile, EIP denotes the original EIP that is the area surrounded by OC, CD and DO, while
  indicates the conditional EIP that is the area surrounded by OA, AB and BO.
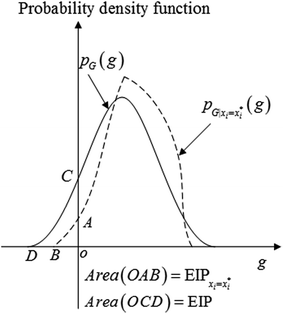 |
| | Fig. 1 Original probability density function pG(g) (solid), conditional probability density function  (dashed), original economical infeasibility probability EIP and conditional economical infeasibility probability (dashed), original economical infeasibility probability EIP and conditional economical infeasibility probability  . . | |
Similar to IMi, the expected shift rate in the EIP due to the elimination of uncertainty in xi can be defined by
| | |
IMRi = Exi[ΔEIPR(xi)]
| (28) |
with
| |
 | (29) |
where ΔEIPR(
xi) measures the absolute difference rate between EIP and EIP
xi with respect to EIP, in which
xi is fixed to one of its realizations.
In this paper, IMi and IMRi will be utilized to identify the influential parameters and the uninfluential parameters. If IMi and IMRi for xi are very small, xi can be considered as an uninfluential parameter and can be fixed to any value within its variation range.
3. Results and discussion
In this section, EIP is first evaluated. Then, IMi and IMRi for xi are further assessed. Finally, the influential parameters and the uninfluential parameters are identified.
For EIP given in eqn (25), 100 independent repeated evaluations are carried out to obtain 100 replicates, and their average  is considered as the final result of EIP. The root mean square error (RMSE) of the 100 replicates is regarded as an indicator of convergence at sample size N, as defined by:
| |
 | (30) |
| |
 | (31) |
where RMSE(
N) represents the root mean square error of the 100 replicates at sample size
N;

denotes the
lth replicate, and

is the average of the 100 replicates.
Similar to EIP, 100 independent repeated calculations are also performed for IMi defined in eqn (26) and IMRi defined in eqn (28), and the averages and the root mean square errors of the 100 replicates are regarded as the final results and the indicators of convergence for them, respectively.
3.1 Evaluation of the economical infeasibility probability
Eight uncertain parameters have been considered for a crude-palm-oil-derived biodiesel production, as shown in Table 1. Fig. 2 shows the PDFs for the net present value defined in eqn (13), the total profit defined in eqn (8) and the limit state functions gi(x) (i = 1, 2, 3) defined in eqn (19)–(21) under these uncertain parameters, in which these PDFs are estimated by the efficient kernel density estimation method.36 Fig. 2 reflects two significant observations. The first is that these uncertain parameters have given rise to the variation in the net present value, the total profit and the limit state functions gi(x) (i = 1, 2, 3). The second observation is that a fraction of the net present value, the total profit and the limit state functions gi(x) (i = 1, 2, 3) have been less than zero due to the effects of these uncertain parameters, indicating the possibility of the economical infeasibility.
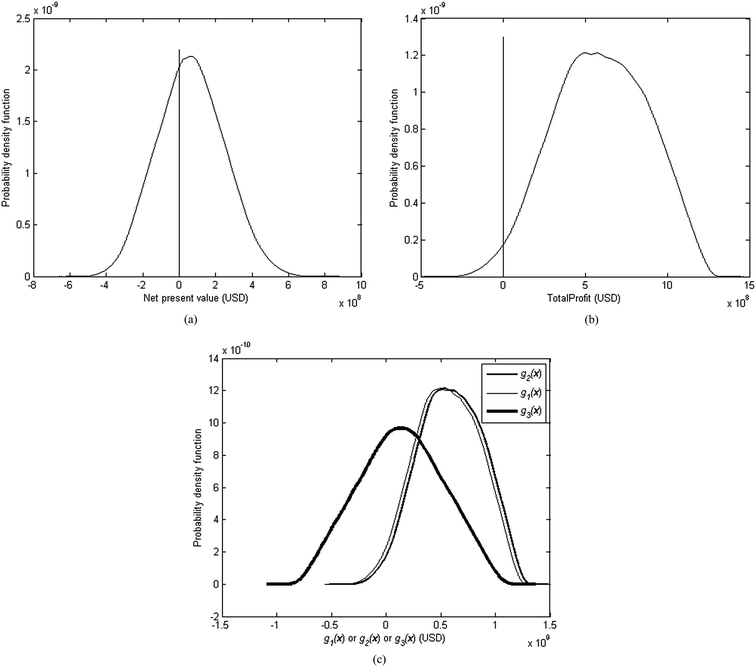 |
| | Fig. 2 Probability density functions (PDFs) for the net present value, the total profit and the limit state functions, (a) PDF for NPV, (b) PDF for TotalProfit and (c) PDFs for gi(x) (i = 1, 2, 3). | |
Fig. 3 depicts the estimated EIP and the RMSE of the estimated EIP with the increasing samples, in which the number of samples is plotted by a log transformation. As revealed by Fig. 3, the sequence of the estimated EIP values converges to the accurate EIP with the increasing samples, and the RMSE of the estimated EIP decreases. Meanwhile, Fig. 3 illuminates that 5 × 10⁴ samples have led to the convergence of the results and the estimated EIP value is 0.3676. A value of 0.3676 for EIP indicates that the project will not be profitable with the probability of 0.3676 (or 36.76%), in other words, 36.76 out of 100 outcomes will not be economically feasible under the known partial statistical information given in Table 1.
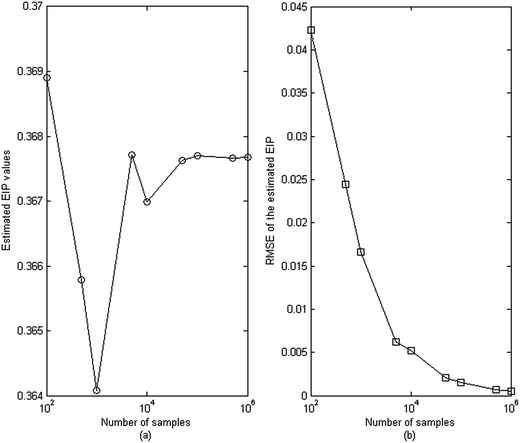 |
| | Fig. 3 Estimated EIP values and RMSE of the estimated EIP with the increasing samples, (a) estimated EIP values and (b) RSME of the estimated EIP. | |
In summary, these uncertain parameters can lead to remarkable impacts on the techno-economic assessments. The uncertainties in these parameters have produced the economical infeasibility of a crude-palm-oil-derived biodiesel production. The following will assess the effect of an individual uncertain parameter on EIP.
3.2 Assessment of the effect of an individual parameter
Fig. 4 shows the estimated sensitivity values and the RMSE of the estimated sensitivities for IM and IMR with the increasing samples. Fig. 4a and c show that 103 samples have yielded good results for IMi (i = 1,…, 8) and IMRi (i = 1,…, 8), while Fig. 4b and d illustrate that 105 samples are required to obtain the reasonable results of these two indicators with low values of RMSE. In addition, Fig. 4a and c indicate that x7 (the biodiesel conversion efficiency), x3 (the operating rate), x4 (the feedstock price) and x8 (the biodiesel price) generate considerable effects on EIP, while the other parameters exert lower influences on EIP. This leads to the importance ranking of the uncertain parameters: x4 > x8 > x3 > x7 > x2 > x1 > x5 > x6. If we take g(x) = g3(x) defined in eqn (21) and (22), we can similarly define the NPV-based sensitivity to uncertainty parameters by eqn (26) and (28). Then, we can similarly evaluate the estimated values for the corresponding NPV-based IMi (i = 1, 2,…, 8) and IMRi (i = 1, 2,…, 8), as summarized in Table 2. According to the results given in Table 2, we can obtain the ranking of the uncertain parameters as x4 > x8 > x3 > x7 > x2 > x1 > x5 > x6. Thus, we have obtained the same ranking of sensitivity parameters for the proposed novel EIP and NPV.
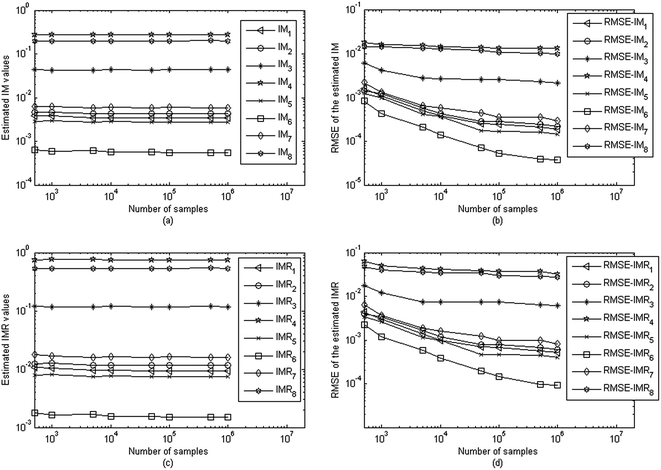 |
| | Fig. 4 Estimated sensitivity values and RMSE of the estimated sensitivities with the increasing samples, (a) estimated IM values, (b) RMSE of the estimated IM, (c) estimated IMR values and (d) RMSE of the estimated IMR. | |
Table 2 The estimated values of the NPV-based sensitivity
| Parameters |
IMi (i = 1, 2,…, 8) |
IMRi (i = 1, 2,…, 8) |
| Capital cost (CC: x1) |
3.5010 × 10⁻³ |
9.5217 × 10⁻³ |
| Interest rate (r: x2) |
4.2695 × 10⁻³ |
1.1606 × 10⁻² |
| Operating rate (OR: x3) |
4.3712 × 10⁻² |
1.1882 × 10⁻¹ |
| Feedstock price (FP: x4) |
2.7550 × 10⁻¹ |
7.4952 × 10⁻¹ |
| Glycerol price (GP: x5) |
2.7324 × 10⁻³ |
7.4317 × 10⁻³ |
| Maintenance rate (MR: x6) |
5.5935 × 10⁻⁴ |
1.5207 × 10⁻³ |
| Biodiesel conversion efficiency (CE: x7) |
5.9706 × 10⁻³ |
1.6246 × 10⁻² |
| Biodiesel price (BP: x8) |
1.9841 × 10⁻¹ |
5.3959 × 10⁻¹ |
The results of IM and IMR shown in Fig. 4a and c and Table 2 can classify the parameters into two categories: the influential parameters and the uninfluential parameters. The influential parameters include x3, x4, x7 and x8, whereas the uninfluential parameters comprise x1, x2, x5 and x6. For these uninfluential parameters, eliminating the uncertainties in them and fixing them to any values within their variation ranges will not bring about distinct effects on EIP and g(x). Fig. 5 shows the original and conditional PDFs of g(x), in which the original PDF is the probability density function of g(x) subjected to all of the eight uncertain parameters, while the condition PDF of g(x) is determined when the uninfluential parameter xi (i = 1, 2, 5, 6) is fixed to a value within its variation range, i.e., xi = xij (i = 1, 2, 5, 6; j = 1, 2, 3). The shifts between the original PDF and the conditional PDF are negligible, which indicates that removing the uncertainties in the uninfluential parameters will not remarkably impact EIP and g(x).
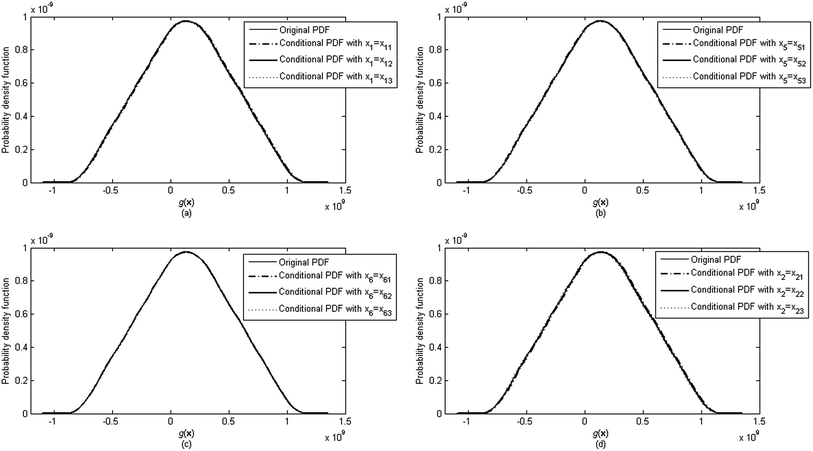 |
| | Fig. 5 Original probability density function and conditional probability density function fixing unimportant parameters for g(x), (a) fixing the capital cost, (b) fixing the glycerol price, (c) fixing the maintenance rate and (d) fixing the interest rate. | |
Fig. 6 depicts the original and conditional PDFs of g(x) when the influential parameters x3, x4, x7 and x8 are fixed to the values within their variation ranges, i.e., xi = xij (i = 3, 4, 7, 8; j = 1, 2, 3). It can be seen that eliminating the uncertainties in the influential parameters can cause distinct variation of g(x) and EIP.
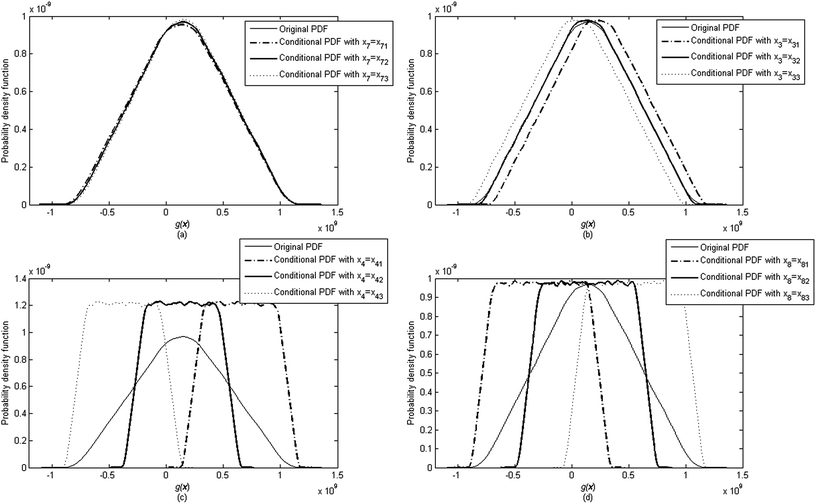 |
| | Fig. 6 Original and conditional probability density functions for g(x), (a) fixing the biodiesel conversion efficiency, (b) fixing the operating rate, (c) fixing the feedstock price and (d) fixing the biodiesel price. | |
As revealed by the previous results, more concern should be focused on these influential parameters during the project's lifetime including x7 (the biodiesel conversion efficiency), x3 (the operating rate), x4 (the feedstock price) and x8 (the biodiesel price) in order to ensure economical feasibility. Meanwhile, these uninfluential parameters can be fixed to any values within their variation ranges without causing distinct influence on EIP.
4. Conclusions
The economical infeasibility probability and the influence of an individual parameter on the economical infeasibility probability have been considered for the techno-economic assessments of a crude-palm-oil-derived biodiesel production with eight random parameters. The final results reveal two important conclusions. The first is that the economical infeasibility probability is 0.3676, and the second is that the biodiesel conversion efficiency, the operating rate, the feedstock price and the biodiesel price can generate major effects on the economical infeasibility probability.
Nomenclature
| BP | Biodiesel price |
| BPC | Byproduct credit |
| BPCi | Byproduct credit of the ith year |
| CC | Capital cost |
| CE | Conversion efficiency from feedstock to biodiesel |
| d | Depreciation rate |
| EIP | Economical infeasibility probability |
| FC | Feedstock cost |
| FCi | Feedstock cost of the ith year |
| FP | Feedstock price |
| FU | Annual total feedstock consumption |
| GCF | Glycerol conversion factor |
| GP | Glycerol price |
| LCC | Life cycle cost |
| MC | Maintenance cost |
| MCi | Maintenance cost of the ith year |
| MCS | Monte Carlo simulation |
| MEP | Maximum entropy principle |
| MR | Maintenance rate |
| NPV | Net present value |
| OC | Operating cost |
| OCi | Operating cost of the ith year |
| OR | Operating rate or operating cost of per-ton crude-palm-oil-derived biodiesel production |
| PC | Production capacity |
| PP | Payback period of the biodiesel production |
| PPu | Allowable upper limit of payback period |
| PWFn | Worth factor in the year n |
| RC | Replacement cost |
| r | Interest rate |
| SV | Salvage value |
| TAX | Annual total taxation |
| TBS | Annual total biodiesel sales |
| TEA | Techno-economic assessments |
| TotalProfit | Total profit |
| TR | Tax rate |
| ρ | Density of the biodiesel |
Acknowledgements
Authors gratefully thank the support of the National Natural Science Foundation of China under Grant Nos. NSFC 51405064.
References
- M. Höök and X. Tang, Energy Policy, 2013, 52, 797–809 CrossRef.
- Energy, climate and society, http://cemusstudent.se/wp-content/uploads/2012/02/Week-49-Energy-Climate-and-Society-Mikael-Höök.pdf, accessed January 3, 2017.
- Y. J. Yan, X. Li, G. L. Wang, X. H. Gui, G. L. Li, F. Su, X. F. Wang and T. Liu, Appl. Energy, 2014, 113, 1614–1631 CrossRef CAS.
- K. S. Chen, Y. C. Lin, L. T. Hsieh, L. F. Lin and C. C. Wu, Energy, 2010, 35, 2043–2048 CrossRef CAS.
- G. Fontaras, G. Karavalakis, M. Kousoulidou, T. Tzamkiozis, L. Ntziachristos and E. Bakeas, Fuel, 2009, 88, 1608–1617 CrossRef CAS.
- H. C. Frey and K. Kim, Transport. Res. Transport. Environ., 2009, 14, 585–592 CrossRef.
- M. A. Kalam, H. H. Masjuki, M. H. Jayed and A. M. Liaquat, Energy, 2011, 36, 397–402 CrossRef CAS.
- A. Obadiah, G. A. Swaroopa, S. V. Kumar, K. R. Jeganathan and A. Ramasubbu, Bioresour. Technol., 2012, 116, 512–516 CrossRef CAS PubMed.
- G. Allesina, S. Pedrazzi, S. Tebianian and P. Tartarini, Bioresour. Technol., 2014, 170, 278–285 CrossRef CAS PubMed.
- C. J. Zou, P. W. Zhao, L. H. Shi, S. B. Huang and P. Y. Luo, Bioresour. Technol., 2013, 146, 785–788 CrossRef CAS PubMed.
- N. N. A. N. Yusuf, S. K. Kamarudin and Z. Yaakob, Biofuels, Bioprod. Biorefin., 2012, 6, 319–334 CrossRef CAS.
- S. K. Tang, H. Zhao, Z. Y. Song and O. Olubajo, Bioresour. Technol., 2013, 139, 107–112 CrossRef CAS PubMed.
- L. F. Sotoft, B. G. Rong, K. V. Christensen and B. Norddahl, Bioresour. Technol., 2010, 101, 5266–5274 CrossRef CAS PubMed.
- F. Delrue, P. A. Setier, C. Sahut, L. Cournac, A. Roubaud, G. Peltier and A. K. Froment, Bioresour. Technol., 2012, 111, 191–200 CrossRef CAS PubMed.
- M. J. Haas, A. J. McAloon, W. C. Yee and T. A. Foglia, Bioresour. Technol., 2006, 97, 671–678 CrossRef CAS PubMed.
- K. R. Jegannathan, C. Eng-Seng and P. Ravindra, Renewable Sustainable Energy Rev., 2011, 15, 745–751 CrossRef CAS.
- I. Lozada, J. Islas and G. Grande, Renewable Sustainable Energy Rev., 2010, 14, 486–492 CrossRef CAS.
- S. Nagarajan, S. K. Chou, S. Cao, C. Wu and Z. Zhou, Bioresour. Technol., 2013, 145, 150–156 CrossRef CAS PubMed.
- H. C. Ong, T. M. I. Mahlia, H. H. Masjuki and D. Honnery, Fuel, 2012, 98, 131–139 CrossRef CAS.
- T. Sakai, A. Kawashima and T. Koshikawa, Bioresour. Technol., 2009, 100, 3268–3276 CrossRef CAS PubMed.
- S. Busse, B. Brümmer and R. Ihle, Agr. Econ., 2012, 43, 545–560 CrossRef.
- N. G. Mankiw, Principles of Economics, South-Western Cengage Learning, 6th edn, 2011 Search PubMed.
- E. Borgonovo and L. Peccati, Int. J. Prod. Econ., 2006, 104, 62–73 CrossRef.
- G. Brownbridge, P. Azadi, A. Smallbone, A. Bhave, B. Taylor and M. Kraft, Bioresour. Technol., 2014, 151, 166–173 CrossRef CAS PubMed.
- U. Abubakar, S. Sriramula and N. C. Renton, Sustainable Energy Technologies and Assessments, 2015, 9, 1–11 CrossRef.
- Z. C. Tang, Z. Z. Lu, Z. W. Liu and N. C. Xiao, Bioresour. Technol., 2015, 175, 502–508 CrossRef CAS PubMed.
- Malaysia interest rate 1996–2014, http://zh.tradingeconomics.com/malaysia/bank-lending-rate, accessed January 3, 2017.
- The Economics of Biofuel Production and Use, http://www.sts-technology.com/docs/Economics-of-biofuel-production-and-use.ppt, accessed January 3, 2017.
- J. Nagi, S. K. Ahmed and F. Nagi, in International Conference on Construction and Building Technology, Malaysia, 2008, pp. 79–94 Search PubMed.
- Costs of biodiesel production, http://www.globalbioenergy.org/uploads/media/0305_Duncan_-_Cost-of-biodiesel-production.pdf, accessed January 3, 2017.
- M. R. Nanda, Z. Yuan, W. Qin, M. A. Poirier and X. Chunbao, Austin Journal of Chemical Engineering, 2014, 1, 1–7 Search PubMed.
- Recent trends in biodiesel prices and production profits, http://farmdocdaily.illinois.edu/2013/09/recent-trends-in-biodiesel.html, accessed January 3, 2017..
- E. T. Jaynes, Phys. Rev., 1957, 106(4), 620–630 CrossRef.
- W. Feller, An Introduction to Probability Theory and Its Applications, Wiley, New York, 3rd edn, 1968, vol. 1 Search PubMed.
- J. S. Liu, Monte Carlo Strategies in Scientific Computing (Springer Series in Statistics), Springer, New York, 2008 Search PubMed.
- Z. I. Botev, J. F. Grotowski and D. P. Kroese, Ann. Stat., 2010, 38, 2916–2957 CrossRef.
|
| This journal is © The Royal Society of Chemistry 2017 |
Click here to see how this site uses Cookies. View our privacy policy here.  Open Access Article
 and
Zhang-Chun Tang
 *
*


 represents the condition PDF of the limit state function g when fixing xi to
  , i.e.,
  . Meanwhile, EIP denotes the original EIP that is the area surrounded by OC, CD and DO, while
  indicates the conditional EIP that is the area surrounded by OA, AB and BO.

 is considered as the final result of EIP. The root mean square error (RMSE) of the 100 replicates is regarded as an indicator of convergence at sample size N, as defined by:

 denotes the lth replicate, and
  is the average of the 100 replicates.


