
 Open Access Article
 This Open Access Article is licensed under a
 Creative Commons Attribution 3.0 Unported Licence
SDS induced dissociation of STY3178 oligomer: experimental and molecular dynamics studies
Paramita Sahaa,
Samapan Sikdara,
Camelia Mannaa,
Jaydeb Chakrabartiab and
Mahua Ghosh *a
*a
aDepartment of Chemical, Biological and Macromolecular Sciences, S. N. Bose National Centre for Basic Sciences, Block JD, Sector III, Salt lake, Kolkata 700106, India. E-mail: mahuaghosh@bose.res.in; mahua.ghosh@gmail.com
bThe Thematic Unit of Excellence on Computational Materials Science, S. N. Bose National Centre for Basic Sciences, Block JD, Sector III, Salt lake, Kolkata 700106, India
First published on 18th January 2017
Abstract
STY3178 is a yfdX protein from Salmonella Typhi. yfdX proteins occur ubiquitously in a number of virulent bacteria but their cellular localization is unknown. Our earlier studies have shown that STY3178 is a trimer and can be a periplasmic chaperone protein. In the present study we show the stability of STY3178 in the presence of the bio-mimetic anionic surfactant sodium dodecyl sulphate (SDS). With increasing concentrations of SDS we observe monomeric STY3178 which reversibly forms the trimer upon decreasing the surfactant concentration. Protein tertiary structure is not perturbed in the presence of SDS. We show using molecular dynamics simulation and conformational thermodynamics data that SDS induces stability of the monomer compared to an isolated monomer of STY3178. This supports our experimental observations.
Introduction
Surfactants mimic cellular membrane properties and hence find application in the isolation and solubilization of proteins.1,2 In particular membrane proteins are often solubilized in surfactants in the absence of lipids. These surfactants sometimes affect protein tertiary or quaternary structure. Ionic surfactants are amphiphilic in nature and show electrostatic interaction with proteins through ionic head groups and hydrophobic interactions using the hydrocarbon tail, whereas the non-ionic surfactants interact only via hydrophobic interactions.3 Protein interaction with surfactants finds applications in many different industries like the chemical, pharmaceutical including drug delivery, food and cosmetic industries.4–6Study of interaction of surfactants with bacterial proteins might provide vital information regarding the host cell surface interactions. It can also provide clue to the intracellular interactions between periplasmic protein and cellular membrane. yfdX proteins are ubiquitously present in virulent bacteria. However, the exact cellular localization for these proteins is still unknown. Importance of these proteins are indicated by the following: (i) its presence in disease causing bacteria, (ii) its up-regulation in E. coli by a multidrug response regulator protein EvgA7 and (iii) its interaction with antibiotics like ciprofloxacin, rifampin and ampicillin for Salmonella Typhi protein STY3178.7 It is also reported that STY3178 show stability in wide range of pH.8 We have shown the thermally stable STY3178 has the chaperone activity capability in absence of ATP like known periplasmic chaperones.9 STY3178 shows reversibility in unfolding in presence of thermal9 and chemical perturbations.8
Here we study the effect of most widely used anionic surfactant sodium dodecyl sulphate (SDS) on the structural stability of STY3178. SDS is known to affect protein structure in a variety of ways. For instance, α-helical and α/β mix proteins appear to be more prone to SDS-induced unfolding than the β-sheeted ones.3 Above the critical micellar concentration (CMC), SDS stabilizes α-helical conformation,10–12 whereas below CMC, it stabilizes β-sheets.12–14 SDS is also reported to alter the tertiary structure keeping the secondary structure unchanged in some proteins such as cytochrome c.12,15–21 It as well affects oligomeric states of various proteins. For instance, EmrE22 from small multidrug resistance (SMR) protein family, BRICHOS23 domain trimer (related to human amyloid disease) and multioligomeric haemoglobin24 are reported to form either monomers or dissociate in presence of SDS. Similarly suppression of aggregation is observed for insulin25 and alcohol dehydrogenase in presence of SDS.
The main objective of the present studies is as follows. The homologues of STY3178 from other virulent bacteria like Salmonella Typhimurium, Escherichia coli, Klebsiella pneumoniae, Salmonella paratyphi yfdX proteins, are all predicted as periplasmic proteins in Cello.26,27 The interactions of yfdX protein with surfactant can possibly mimic the interaction between cell membrane and periplasmic proteins. This leads us to probe the interactions of surfactant with STY3178. Among these yfdX proteins, two are identified as multimers. STY3178 is trimeric in solution as reported in our earlier study.7 The homologue of STY3178 from K. pneumoniae is shown as a tetramer in the deposited structure in PDB. Surfactants at high concentrations are reported to dissociate complex structures of proteins.28–32 Moreover, it is also known that proteins get unfolded in presence of high surfactant concentration.28–32 The key question is: does STY3178 retain its secondary and tertiary structure in SDS?
Structural changes of STY3178 in presence of SDS are monitored using dynamic light scattering (DLS), size exclusion chromatography (SEC), steady state fluorescence, circular dichroism (CD) and isothermal titration calorimetry (ITC) in our present study. DLS measurements show decrease in hydrodynamic size of the protein with increase in SDS concentration, indicating dissociation of STY3178 trimer which is further confirmed by SEC. We find gradual lowering of fluorescence emission intensity without any effect in the peak position in presence of SDS. Near UV-CD spectrum shows loss of broad shoulder in SDS whereas far-UV CD show the α-helical secondary structure remains intact. ITC measurement indicates two regimes during the titration of SDS to the protein, which matches with the DLS observations. To further understand the SDS binding, we perform molecular dynamics simulation. It has been shown that the stabilization of protein–ligand systems can be understood from the conformational free energy and entropy of the system.33,34 Our earlier works show that these quantities can be extracted from the distribution of dihedral angles over the simulated trajectory. Further, the destabilized and disordered residues in a given conformation in reference to another, serve as ligand binding sites in proteins for further activities.35,36 We estimate the conformational thermodynamics changes and observe the SDS induced stability of modeled monomer of the protein compared to that in the absence of SDS. Our data support our experimental observations of SDS interactions with STY3178.
Methods
The protocol used for overexpression, extraction and purification of STY3178 is same as reported in our previous study.7Sample preparation
Dynamic light scattering
Effect of SDS on hydrodynamic size of the protein is monitored using dynamic light scattering in a Nano-S Malvern instrument at 20 °C. The wavelength of the laser and angle of scattering used for all measurements are 632.8 nm and 173°, respectively. Protein concentration of 10 μM is used, all samples are equilibrated over night and measurement is performed using a10 mm path length cell. In another set of experiment, 200 μM protein is first incubated overnight in 173.5 mM (5%) SDS. The SDS concentration is then reduced by various folds of dilution keeping the protein concentration fixed at 10 μM. The measurement for each sample is collected as an average of five scans. The reported data are averaged over two sets of measurement. Error bars represent the standard deviation between the two sets.Size exclusion chromatography
We perform SEC for STY3178 in presence of different SDS concentrations using superdex 75 column as per the protocol described earlier.7 We subject the protein to SEC in presence of 3.48 mM (0.1%) or 69.6 mM (2%) SDS. STY3178 (400 μM) is first incubated in presence of these SDS concentrations before loading onto the column. The column is pre-equilibrated with buffer having 50 mM phosphate (pH 7), 250 mM NaCl, 1 mM PMSF and 3.48 mM (0.1%) or 69.6 mM (2%) SDS. The protein is eluted at a flow rate of 1 ml per minute using a peristaltic pump (GE Healthcare). Various standard proteins such as lysozyme (14.4 kDa), carbonic anhydrase (29 kDa), ovalbumin (43 kDa), BSA (66 kDa) and conalbumin (75 kDa) are used for column calibration as reported earlier.7Circular dichroism
The changes in secondary structure for the above protein samples having different concentration of SDS are monitored in Jasco J-815 CD spectrometer. All measurements at room temperature in the far-UV region (200–250 nm) are performed using a cuvette of 1 mm path length and near UV-CD region (250–330 nm) in 10 mm cell. Scan speed of 100 nm min−1 is used for acquiring the spectra. Data are collected as an average of two scans. Buffer solutions with respective concentration SDS are subtracted from all the data sets.Intrinsic fluorescence measurements
The steady state fluorescence emission experiments in presence of various concentration of SDS are recorded in Jobin Yvon Horiba Fluorolog. Protein incubated in buffers with different SDS concentration are excited at 275, 280 and 295 nm excitation wavelengths using 10 mm path length quartz cell and 3 nm slit width. The buffer containing SDS data for background correction are recorded similarly and subtracted from the respective protein spectra.Isothermal titration calorimetry (ITC)
We perform ITC measurements using MicroCal iTC200 calorimeter (GE healthcare) to determine the dissociation of STY3178 trimer in presence of SDS at 298 K. STY3178 in a buffer containing 30 mM phosphate (pH 7), 150 mM NaCl and 1 mM PMSF is titrated against 500 mM SDS loaded in the syringe. Concentration of protein used in the cell is 497 μM. Reference power used in ITC is 10 μcal s−1. First injection of 0.4 μl and rest 25 injections of 1.5 μl each are injected with 50 rpm constant stirring. Duration of each injection is 3 s with a time difference of 200 s between two consecutive injections and an initial delay of 60 s prior to the first injection. The heat of demicellization upon dilution of SDS is subtracted from that of SDS titration into protein. Integrated data is plotted using MicroCal origin.Docking, simulation and conformational thermodynamics
STY3178 monomer9 is docked with anionic surfactant sodium dodecyl sulphate (SDS) using Autodock4.37 The average structure of the simulated STY3178 monomer is used as a receptor for docking. Residues used for biasing the docking of SDS molecule are N114, R149, Q175, S184 and V185, which are the conformationally destabilized interfacial residues in the trimeric assembly compared to the isolated monomer.8 We choose the best docked complex out of five solutions based on minimum energy criterion. The resulting docked complex is minimized and molecular dynamics (MD) simulation is performed in NAMD38 for 40 ns. All-atom molecular dynamics simulations for STY3178 monomer–SDS complex is carried out using the NAMD38 program in presence of explicit water molecules (TIP3P model) and counter ions. MD simulations is performed using the CHARMM27 (ref. 39) force field parameters at 310 K and 1 atm pressure in isothermal–isobaric (NPT) ensemble, with 1 femto second time step, following standard protocols.33,35,36,40–42We consider the equilibrated ensemble of the docked complex between 10–40 ns for thermodynamic calculations. The conformational thermodynamic changes of SDS bound STY3178 monomer with respect to isolated monomer is calculated using the histogram based method (HBM),33,35,36,40–42 the detailed description of which can be found in a recent study.8,33 The equilibrated MD trajectory is divided into small time windows (10 ns each) to generate dihedral histograms for every time window. The conformational free energy and entropy have been calculated for each window and averaged over them for each monomer. The error has been estimated from the standard deviations of these values.
Results and discussion
Native STY3178 protein has a hydrodynamic diameter of about 6.5 nm in solution as reported earlier.7 This hydrodynamic size of the protein is retained even in presence of 8.7 mM (0.25%) SDS concentration (Fig. 1A). At 17.4 mM (0.5%) SDS, hydrodynamic diameter of the protein decreases to around 6 nm. On further increasing SDS concentration, we observe a gradual decrease in hydrodynamic diameter. At 69.6 mM (2%) SDS, it decreases further to about 4.55 nm (Fig. 1A). The reduced hydrodynamic size is similar to proteins like soyabean trypsine inhibitor and carbonic anhydrase with molecular weights 20 kDa and 29 kDa, respectively.7 This suggests possibility of STY3178 trimer dissociation into monomer subunits in presence of 69.6 mM (2%) SDS. Increasing the SDS concentration further does not change the hydrodynamic size substantially. In presence of 173.5 mM (5%) SDS, the hydrodynamic diameter observed is similar to 69.6 mM (2%) SDS data within error. Upon reducing SDS concentration from the solution containing 173.5 mM (5%) SDS, we observe increase in hydrodynamic size at 52.2 mM (1.5%) SDS concentration (Fig. 1A). The native protein-like hydrodynamic diameter is observed when SDS concentration is reduced to 8.7 mM (0.25%). This indicates that around CMC of SDS, STY3178 remains as a trimer. Thus trimer to monomer conversion of STY3178 induced by SDS is reversible in nature.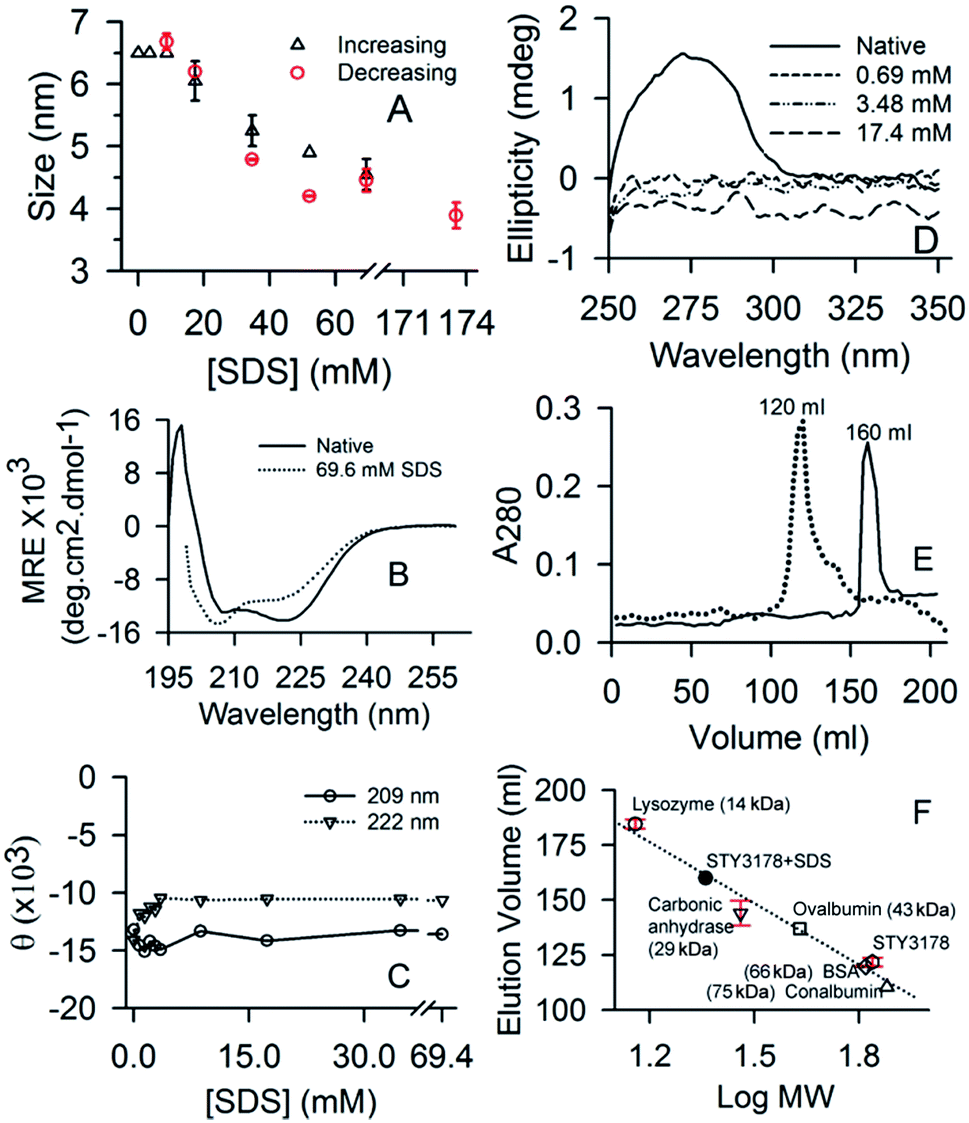 | ||
| Fig. 1 Effect of SDS on STY3178. (A) Shows the plot of hydrodynamic diameter of protein upon increasing (black) and decreasing (red) SDS concentration. Error bars represent the standard deviation between two sets of measurements. (B) CD spectra of protein in native state (solid) and in presence of 69.6 mM (dotted) SDS. (C) The variation in ellipticity values at 209 nm (θ209) and 222 nm (θ222) wavelengths as a function of SDS concentration are shown using triangle and circle, respectively. (D) Shows the near UV-CD (250–350 nm) spectra of STY3178 in presence of 0.69 mM (short dash), 3.48 mM (dash-dot-dot) and 17.4 mM (long dash) SDS concentration. The native protein spectrum is shown in solid. (E) Shows the elution profile of STY3178 in presence of 3.48 mM (dotted) and 69.6 mM (solid) SDS from superdex 75 column. (F) Represents the calibration curve of superdex 75 column showing the plot of elution volume versus logarithm of molecular weight of various standard proteins lysozyme (14 kDa, circle), carbonic anhydrase (29 kDa, inverted triangle), ovalbumin (45 kDa, square), BSA (66 kDa, diamond) and conalbumin (75 kDa, triangle). Elution volume of STY3178 without and with 69.6 mM SDS is shown by hexagon and filled circle, respectively. | ||
Far UV-CD spectrum of SY3178 shows its α-helical nature as reported earlier7 (Fig. 1B). In presence of 69.6 mM SDS (2%), where we obtain a monomer like hydrodynamic size, the CD spectrum is slightly altered. The two minima at 209 and 222 nm show a slight variation in ellipticity. However, the spectrum does not look like an unfolded protein CD signature indicating that the conformation of STY3178 in presence of 69.6 mM SDS (2%) is folded. When we monitor the ellipticity values at 209 and 222 nm for increasing concentration of SDS (0–69.6 mM), we observe ellipticity decreases at 222 nm and increases at 209 nm for 3.48 mM (0.1%) SDS. Beyond this concentration of SDS, no substantial change in ellipticity is observed for these two wavelengths (Fig. 1C). Overall there may be a slight change in helix content compared to the native protein keeping the secondary structure similar. Decrease in helix content in presence of 69.6 mM (2%) SDS compared to native is about 9.3%.
The near UV-CD signature of the protein contains broad shoulder7 in the range 250 nm to 280 nm, which gets altered in presence of 0.696 mM (0.02%) SDS (Fig. 1D). This broad shoulder between 250–280 nm arises due to the presence of phenylalanine and tyrosine in the tertiary structure as reported earlier.7 It has been reported earlier that aromatic residues interact with SDS.43 This might be the reason due to which the broad shoulder of protein is not observed in the near UV-CD spectrum, even at the lowest concentration of SDS. Similarly in fluorescence emission in presence of SDS, we observe decrease in intensity for the three excitation wavelengths 275, 280 and 295 nm (data not shown). There is no change observed in the emission peak position in presence of SDS.
We perform size exclusion chromatography (SEC) using superdex 75 column to confirm the possible dissociation of STY3178 trimer in presence of SDS. SEC is performed in presence of 3.48 mM (0.1%) and 69.6 mM (2%) SDS and elution volumes are compared with that of the native protein. Fig. 1E shows the chromatogram of protein eluted from the column. The elution volume of protein in 3.48 mM SDS is around 120 ml and matches with that of the native STY3178 (Fig. 1E). This confirms that STY3178 remains in trimeric state in presence of 3.48 mM SDS. However, the protein in 69.6 mM SDS elutes at a volume of around 160 ml (Fig. 1E). We compare this elution volume with that of several other standard proteins eluted from the same superdex 75 column. The elution volume of 160 ml corresponds to a protein with molecular weight of about 23 kDa (Fig. 1F), confirming SDS-induced dissociation of trimeric STY3178 into its monomers.
We further perform ITC measurements to determine interaction of STY3178 with SDS. Fig. 2A shows the thermogram of titration of SDS into STY3178 solution at 298 K. The corresponding isotherm is shown in Fig. 2B. There are two regions in the ITC isotherm (Fig. 2B). In the first region (up to 100 molar ratio) up to 14th injection, the final SDS concentration is 33.2 mM (0.95%) (Fig. 2B). In the same SDS concentration range, we find decrease in hydrodynamic diameter from 6.5 nm to 5.6 nm in DLS (Fig. 1A). The second region in ITC isotherm corresponds to SDS concentration of about 63.2 mM (1.8%) at final injection (Fig. 2B), where we observe hydrodynamic diameter (∼4.2 nm) of monomeric protein in DLS (Fig. 1A). The ITC data suggest that SDS binds to the trimeric assembly and the corresponding monomer differently.
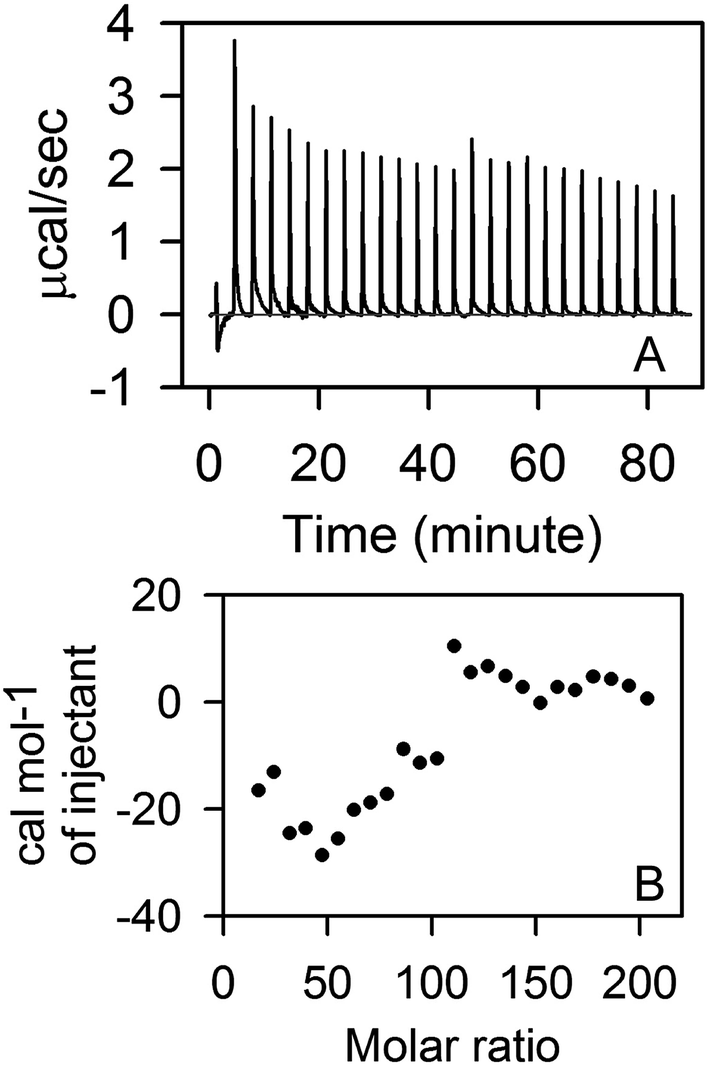 | ||
| Fig. 2 ITC measurement in presence of SDS. (A) Shows the thermogram of titration of 500 mM SDS into STY3178. (B) Shows the isotherm of SDS binding with STY3178. | ||
To further understand qualitatively the SDS binding and stabilization of the monomer in presence of SDS, we perform molecular dynamics (MD) simulation on model system. We consider a monomeric STY3178 and one SDS molecule in our model studies. A couple of points are noteworthy on the construction of our model system: (1) SDS interaction takes place with both monomeric and trimeric protein. For simplicity of the calculation we restrict only to the monomeric state. (2) We have considered one SDS molecule, even though the experiments indicate that the protein monomers are stable for large SDS concentrations much above the CMC where the SDS molecules form micelles. The SDS molecules are amphiphilic in nature, containing negatively charged head-group and hydrophobic tail. Due to amphiphilic nature, even in the micelles the head groups are solvent exposed which can interact with protein as in a single SDS molecule. Thus the interactions responsible for SDS and the protein interactions have been adequately taken into account in our model calculations.
We have shown earlier a simulated monomer model structure which can explain experimentally observed thermal stability.9 In a recent study we have shown the MD simulated trimeric conformations of STY3178 and compared its stability over the monomer structure.8 We observe that the trimeric conformation is more stable compared to the monomer. However, there are some interfacial residues in the trimer which are destabilized with respect to the monomer.8 The changes in conformational free energy, ΔGconfi and entropy, TΔSconfi of these destabilized interfacial residues between two monomers are shown in Table 1 where the data is averaged over all the three chains. ΔGconfi and TΔSconfi in the table are quoted in units of kJ Mol−1. The estimated error for ΔGconfi is approximately 4% and that for TΔSconfi is 5%. Within this error bar the conformational free energy of the lowest magnitude still remains positive (0.02 ± 0.0008) indicating destabilization, albeit with very small magnitude. The total destabilization conformational free energy of the relevant residues add up to about 1kBT.
| Interfacial residues | ΔGconfi | TΔSconfi |
|---|---|---|
| N114 | 0.1 | −0.5 |
| R149 | 0.02 | −2.3 |
| Q175 | 0.06 | −0.02 |
| S184 | 0.8 | 0.6 |
| V185 | 0.7 | 1.2 |
| E187 | 0.3 | 0.3 |
The destabilized and disordered polar, basic or hydrophobic residues can bind to amphiphilic SDS molecule. If we consider the destabilized and disordered residues as shown in Table 1, we observe that the majority of the residues are polar, along with basic and hydrophobic ones as well. The destabilized and disordered polar, basic or hydrophobic residues can bind amphiphilic SDS molecule with negatively charged head group. This is because of the amphiphilic nature of SDS containing negatively charged head-group and hydrophobic tail. If we consider the destabilized and disordered residues as shown in Table 1, we observe 66% of them are polar, 17% is basic and 17% is hydrophobic.
We perform biased docking of SDS molecule with a simulated monomer of STY3178 using N114, R149, Q175, S184 and V185 as active residues. The docked monomer–SDS complex is then simulated to obtain ensemble of structures. We estimate conformational thermodynamic changes of SDS bound monomer with respect to SDS-free monomer. The simulated docked complex is shown in Fig. 3A. The SDS molecule after simulation stabilizes near the residues V180, S182, Q183, S184, V185, Q186 and S188, which forms the binding region. The SDS bound monomer shows overall gain in conformational stability, ΔGconf = −100.3 kJ mol−1 and ordering TΔSconf = −431.8 kJ mol−1 with respect to an isolated monomer. A residue wise conformational thermodynamics analysis upon SDS binding show that in the SDS–monomer complex, residues V180, S182, Q183, S184, V185, Q186 and S188 get stabilized. The conformational free energy changes, ΔGconfi, shown in black, in Fig. 3B, are computed for monomer–SDS complex with respect to the free monomer. We compare the ΔGconfi (grey) for these residues in the trimeric assembly, where we compute conformational free energy changes of the trimer with respect to monomer. The residue-wise conformational free energy changes in the trimer is computed by taking an average over the three units (Fig. 3B). ΔGconfi of V180, Q186 and S188 are negative in both the trimeric assembly as well as in the monomer–SDS complex, albeit the degree of stabilization of Q186 is more upon SDS binding. The other residues, S182, Q183, S184 and V185, which are destabilized (ΔGconfi > 0) in the trimeric assembly, undergo conformational stabilization upon SDS binding.
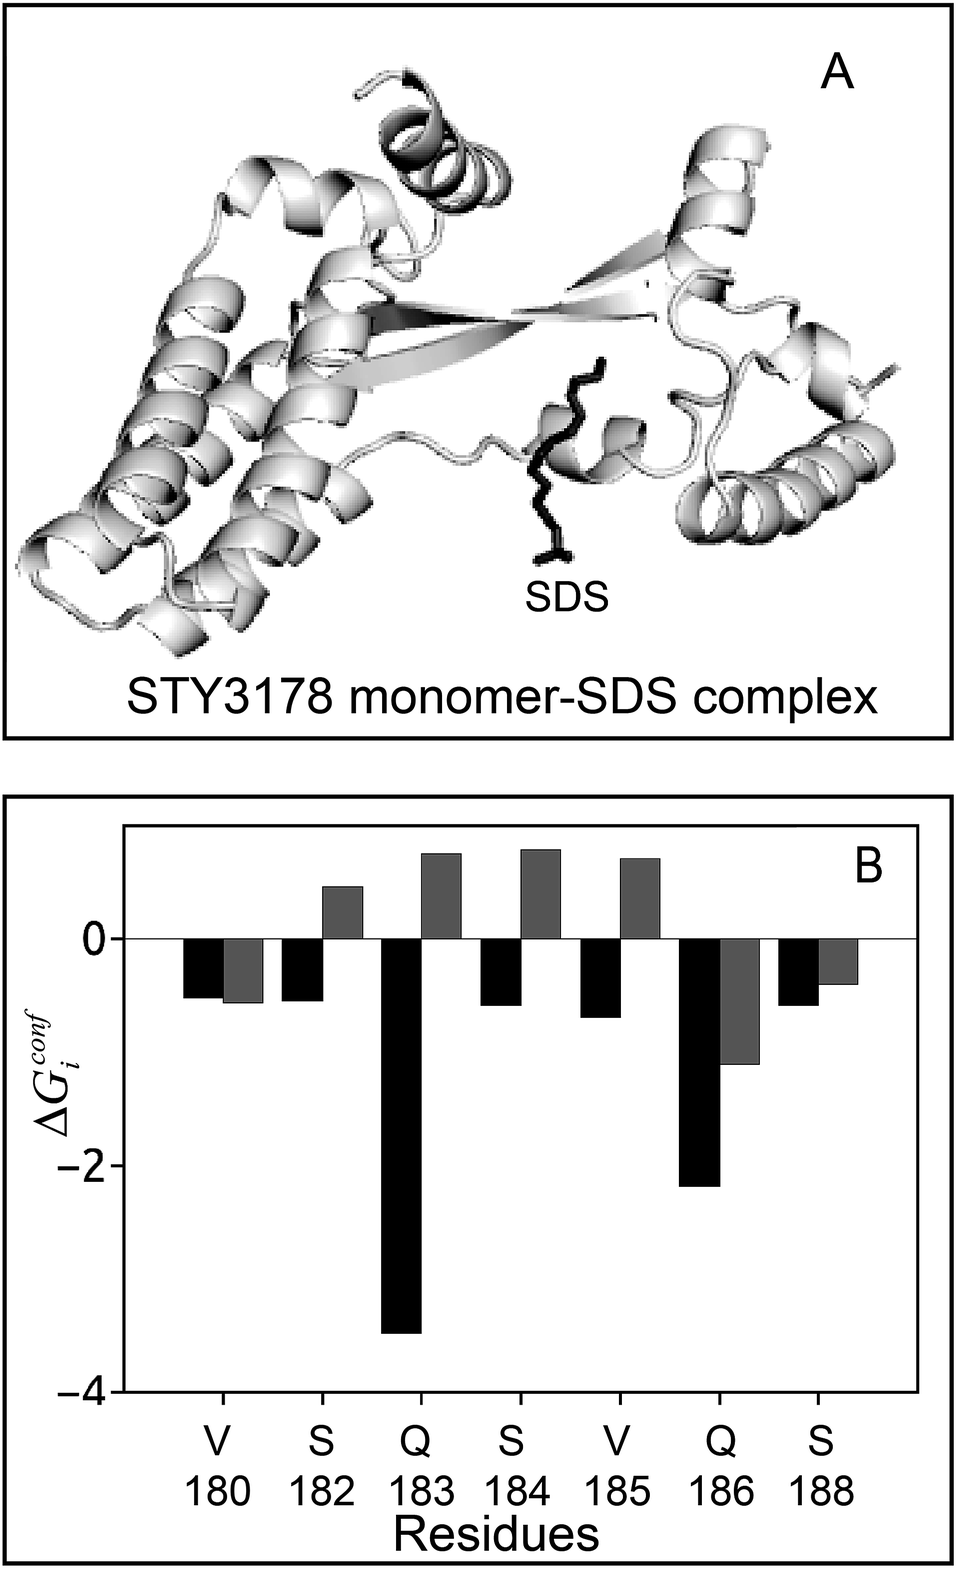 | ||
| Fig. 3 STY3178-SDS docked structure and free energy change (in units of kJ mol−1). (A) Final simulated structure of STY3178 monomer–SDS complex. (B) The conformational free energy changes, ΔGconfi of SDS binding residues in monomer–SDS complex (black). The ΔGconfi of same residues in the trimer assembly (grey) calculated as an average over three monomers. The thermodynamic calculations are performed with respect to an isolated monomer. | ||
The simulation results indicate that SDS binding stabilizes monomeric STY3178. This is in qualitative agreement to our experimental observations that high concentration of SDS dissociates trimeric STY3178 and stabilizes the monomer. These observations are similar to the interactions between surfactants and multimeric proteins reported earlier.28–32 We also show that monomer–monomer interface of the trimeric assembly is suitable binding surface for SDS. Since the exposed charged head groups are more in number in SDS micelles, the electrostatic interactions with the destabilized polar residues will be enhanced compared to the single SDS molecules. This may lead to difference between the binding of SDS with STY3178 for high and low concentrations of SDS.
Conclusion
Anionic surfactant SDS at high concentration induces slight secondary structural changes and major tertiary or quaternary changes in STY3178. Trimeric assembly of STY3178 dissociates reversibly in presence of 69.6 mM (2%) or higher concentration of SDS. However, no SDS induced unfolding of this protein is observed. Our experimental results are substantiated by docking and simulation studies. We observe SDS molecule binds polar and hydrophobic residues present in monomer–monomer interface of the trimer. SDS upon binding the monomeric protein surface induces conformational stability over isolated monomer. These results also indicate that in the vicinity of cell membrane environment as mimic by SDS, STY3178 or other multimeric yfdX proteins might exist as a monomer.Acknowledgements
M. G., P. S. and C. M. thank the DBT-CU-IPLS facility for ITC and Souvik Roy for his assistance during ITC measurement. S. S. thanks the UGC for funding. M. G. and J. C. thank the DST for funding. We thank Sutapa Dutta for help in preparing the manuscript.References
- M. Aivaliotis, P. Samolis, E. Neofotistou, H. Remigy, A. K. Rizos and G. Tsiotis, Biochim. Biophys. Acta, 2003, 1615, 69–76 CrossRef CAS.
- A. Helenius and K. Simons, Biochim. Biophys. Acta, 1975, 415, 29–79 CrossRef CAS.
- M. M. Nielsen, K. K. Andersen, P. Westh and D. E. Otzen, Biophys. J., 2007, 92, 3674–3685 CrossRef CAS PubMed.
- X. F. Wei, Z. D. Chang and H. Z. Liu, J. Surfactants Deterg., 2003, 6, 107–112 CrossRef CAS.
- H. Z. Liu, W. J. Yang and J. Y. Chen, Biochem. Eng. J., 1998, 2, 187–196 CrossRef CAS.
- X. F. Wei and H. Z. Liu, J. Surfactants Deterg., 2000, 3, 491–495 CrossRef CAS.
- P. Saha, C. Manna, S. Das and M. Ghosh, Sci. Rep., 2016, 6, 21305 CrossRef CAS PubMed.
- P. Saha, S. Sikdar, J. Chakrabarti and M. Ghosh, RSC Adv., 2016, 6, 91256–91264 RSC.
- P. Saha, C. Manna, J. Chakrabarti and M. Ghosh, Sci. Rep., 2016, 6, 29541 CrossRef PubMed.
- S. Mammi and E. Peggion, Biochemistry, 1990, 29, 5265–5269 CrossRef CAS PubMed.
- J. Rizo, F. J. Blanco, B. Kobe, M. D. Bruch and L. M. Gierasch, Biochemistry, 1993, 32, 4881–4894 CrossRef CAS PubMed.
- Q. Xu and T. A. Keiderling, Protein Sci., 2004, 13, 2949–2959 CrossRef CAS PubMed.
- L. Zhong and W. C. Johnson Jr, Proc. Natl. Acad. Sci. U. S. A., 1992, 89, 4462–4465 CrossRef CAS.
- D. V. Waterhous and W. C. Johnson Jr, Biochemistry, 1994, 33, 2121–2128 CrossRef CAS PubMed.
- K. Hiramatsu and J. T. Yang, Biochim. Biophys. Acta, 1983, 743, 106–114 CrossRef CAS.
- E. L. Gelamo and M. Tabak, Spectrochim. Acta, Part A, 2000, 56, 2255–2271 CrossRef.
- E. L. Gelamo, C. H. Silva, H. Imasato and M. Tabak, Biochim. Biophys. Acta, 2002, 1594, 84–99 CrossRef CAS.
- L. Gebicka and J. L. Gebicki, J. Protein Chem., 1999, 18, 165–172 CrossRef CAS PubMed.
- T. K. Das, S. Mazumdar and S. Mitra, Eur. J. Biochem., 1998, 254, 662–670 CAS.
- A. Muga, H. H. Mantsch and W. K. Surewicz, Biochemistry, 1991, 30, 7219–7224 CrossRef CAS PubMed.
- K. Takeda, K. Takahashi and P. P. Batra, Arch. Biochem. Biophys., 1985, 236, 411–417 CrossRef CAS PubMed.
- D. C. Bay, R. A. Budiman, M. P. Nieh and R. J. Turner, Biochim. Biophys. Acta, 2010, 1798, 526–535 CrossRef CAS PubMed.
- H. Biverstal, L. Dolfe, E. Hermansson, A. Leppert, M. Reifenrath, B. Winblad, J. Presto and J. Johansson, Biochim. Biophys. Acta, 2015, 1854, 835–843 CrossRef PubMed.
- E. L. Gelamo, R. Itri and M. Tabak, J. Biol. Chem., 2004, 279, 33298–33305 CrossRef CAS PubMed.
- Y. M. Kwon, M. Baudys, K. Knutson and S. W. Kim, Pharm. Res., 2001, 18, 1754–1759 CrossRef CAS.
- C. S. Yu, C. J. Lin and J. K. Hwang, Protein Sci., 2004, 13, 1402–1406 CrossRef CAS PubMed.
- C. S. Yu, Y. C. Chen, C. H. Lu and J. K. Hwang, Proteins: Struct., Funct., Bioinf., 2006, 64, 643–651 CrossRef CAS PubMed.
- K. Gimpl, J. Klement and S. Keller, Biol. Proced. Online, 2016, 18, 4 CrossRef PubMed.
- G. G. Prive, Methods, 2007, 41, 388–397 CrossRef CAS PubMed.
- C. Breyton, C. Tribet, J. Olive, J. P. Dubacq and J. L. Popot, J. Biol. Chem., 1997, 272, 21892–21900 CrossRef CAS PubMed.
- B. Mandal, S. Ghosh and S. P. Moulik, New J. Chem., 2016, 40, 4617–4624 RSC.
- U. Anand and S. Mukherjee, Phys. Chem. Chem. Phys., 2013, 15, 9375–9383 RSC.
- A. Das, J. Chakrabarti and M. Ghosh, Biophys. J., 2013, 104, 1274–1284 CrossRef CAS PubMed.
- K. K. Frederick, M. S. Marlow, K. G. Valentine and A. J. Wand, Nature, 2007, 448, 325–329 CrossRef CAS PubMed.
- S. Sikdar, J. Chakrabarti and M. Ghosh, Mol. BioSyst., 2014, 10, 3280–3289 RSC.
- S. Sikdar, J. Chakrabarti and M. Ghosh, Mol. BioSyst., 2016, 12, 444–453 RSC.
- G. M. Morris, R. Huey, W. Lindstrom, M. F. Sanner, R. K. Belew, D. S. Goodsell and A. J. Olson, J. Comput. Chem., 2009, 30, 2785–2791 CrossRef CAS PubMed.
- J. C. Phillips, R. Braun, W. Wang, J. Gumbart, E. Tajkhorshid, E. Villa, C. Chipot, R. D. Skeel, L. Kale and K. Schulten, J. Comput. Chem., 2005, 26, 1781–1802 CrossRef CAS PubMed.
- B. R. Brooks, C. L. Brooks 3rd, A. D. Mackerell Jr, L. Nilsson, R. J. Petrella, B. Roux, Y. Won, G. Archontis, C. Bartels, S. Boresch, A. Caflisch, L. Caves, Q. Cui, A. R. Dinner, M. Feig, S. Fischer, J. Gao, M. Hodoscek, W. Im, K. Kuczera, T. Lazaridis, J. Ma, V. Ovchinnikov, E. Paci, R. W. Pastor, C. B. Post, J. Z. Pu, M. Schaefer, B. Tidor, R. M. Venable, H. L. Woodcock, X. Wu, W. Yang, D. M. York and M. Karplus, J. Comput. Chem., 2009, 30, 1545–1614 CrossRef CAS PubMed.
- A. Das, S. Sikdar, M. Ghosh and J. Chakrabarti, J. Phys.: Conf. Ser., 2015, 638, 012013 CrossRef.
- A. Das, J. Chakrabarti and M. Ghosh, Chem. Phys. Lett., 2013, 581, 91–95 CrossRef CAS.
- A. Das, J. Chakrabarti and M. Ghosh, Mol. BioSyst., 2014, 10, 437–445 RSC.
- S. M. Kelly, T. J. Jess and N. C. Price, BBA Proteins and Proteomics, 2005, 1751, 119–139 CrossRef CAS PubMed.
| This journal is © The Royal Society of Chemistry 2017 |