 Open Access Article
Creative Commons Attribution 3.0 Unported Licence
In situ TEMPO surface functionalization of nanocellulose membranes for enhanced adsorption of metal ions from aqueous medium†
Zoheb Karimab,
Minna Hakalahtic,
Tekla Tammelinc and
Aji P. Mathew *ad
*ad
aDivision of Materials Science, Luleå University of Technology, 97187, Luleå, Sweden. E-mail: aji.mathew@mmk.su.se; Fax: +46 8152187; Tel: +46 8161256
bDepartment of Civil, Environmental and Natural Resources Engineering, Division of Sustainable Process Engineering, 97187, Luleå, Sweden
cVTT Technical Research Centre of Finland, P. O. Box 1000, VTT, FIN-02044, Finland
dDepartment of Materials and Environmental Chemistry, Stockholm University, 10691 Stockholm, Sweden
First published on 17th January 2017
Abstract
The current work demonstrates an innovative approach to develop nanocellulose based membranes with high water permeability, mechanical stability and high functionality via (1) tailoring the composition of the support layer of sludge microfibers/cellulose nanofibers (CNFSL) and (2) in situ TEMPO functionalization of the thin functional layer of cellulose nanocrystals (CNCBE) to enhance the metal ion adsorption capacity. SEM studies showed a porous network structure of the cellulose support layer and a denser functional layer with CNCBE embedded within gelatin matrix. AFM studies indicated the presence of a nanoscaled coating and increased roughness of membranes surface after TEMPO modification whereas FT-IR and conductometric titration confirmed the introduction of carboxyl groups upon TEMPO oxidation. The contact angle measurement results showed improved hydrophilic nature of membranes after in situ TEMPO functionalization. High networking potential of CNFSL made the membrane support layer tighter with a concomitant decrease in the average pore size from 6.5 to 2.0 μm. The coating with CNCBE further decreased the average pore size to 0.78 and 0.58 μm for S/CNCBE and S–CNFSL/CNCBE, respectively. In parallel, a drastic decrease in water flux (8000 to 90 L MPa−1 h−1 m−2) after coating with CNCBE was recorded but interestingly in situ functionalization of top CNCBE layer did not affect water flux significantly. The increase in adsorption capacity of ≈1.3 and ≈1.2 fold was achieved for Cu(II) and Fe(II)/Fe(III), respectively after in situ TEMPO functionalization of membranes. Biodegradation study confirmed the stability of layered membranes in model wastewater and a complete degradation of membranes was recorded after 15 days in soil.
1. Introduction
Cellulose-based nanomaterials are offering important competitive advantages in the field of nanotechnology and functional materials, not only because of their renewability, biocompatibility, sustainability, and carbon-neutral nature, but also because of their low density, high aspect ratio, high tensile strength and reactive surfaces.1,2 Nanocellulose in the fibril or crystal form has been studied extensively during the past decade as a reinforcing phase in polymers and is an area of growing interest.3–6The use of nanocellulose in water purification is a relatively new research area. Saito et al.7 reported in 2005 that (2,2,6,6-tetramethylpiperidin-1-yl)oxyl or (2,2,6,6-tetramethylpiperidin-1-yl)oxidanyl (TEMPO) mediated oxidized cellulose nanofibers have the capacity to adsorb a variety of heavy metal ions in aqueous solutions. Micro–nano structure poly(ether sulfones)/poly(ethyleneimine) nanofibrous membranes were fabricated by Chu and coworkers from Stony Brook University and have shown that TEMPO oxidized cellulose nanocrystals with negative functional groups can be used to functionalise electrospun membrane layer which provides a route to reject bacteria via size exclusion and reject virus, anionic dyes and heavy metal ions from aqueous solution via adsorption.8–10 Our recent study also demonstrated stand-alone and fully biobased electrospun membranes of cellulose acetate with high flux as well as antifouling performance obtained via impregnation using chitin nanocrystals.11
We have also shown in the recent years that native nanocellulose and modified nanocellulose have capability to adsorb metal ions from aqueous medium as a function of pH, surface charge/charge density and chemistry of surface groups. The adsorption capacity was found to be the highest for nanocrystals with phosphoryl groups (72.8 mg g−1), followed by carboxyl groups (30.15 mg g−1) and sulphonic acid groups (25.5 mg g−1).12 In spite of the good performance of phosphorylated nanocellulose, the processing and the purification of the modified nanocellulose is difficult and demands new processing and modification routes to achieve optimal adsorption performance. In this context, the optimal design of nanocellulose membranes that allows accessibility of the functional entities for interaction with contaminants is crucial. We have attempted to address this issue by developing layered membranes utilizing cellulose nanocrystals with carboxyl as functional layer to capture metal ions13 which showed good permeability when used on cellulose microfiber support, but had relatively moderate mechanical strength in wet conditions and lower metal adsorption capacity for Cu(II), Fe(III)/Fe(II) and Ag(I), ions. Therefore, the current study was an attempt to increase the adsorption capacity of these membranes without losing the mechanical strength, porosity, water permeability and adsorption selectivity towards metal ions.
In situ functionalization of the nanocellulose membrane after fabrication is a new concept, where direct functionalization of membrane surface provides higher concentration of the functional entities on the surface and increased accessibility for interaction with the pollutants. This approach may provide a possibility to increase or control the charge density of the membranes without changing the bulk structure of the membranes. This is extremely relevant for nanocellulose based membranes where the network formation in the membranes is crucial in tailoring the mechanical properties and water flux. Furthermore, modified membranes may be used in static as well as in cross-flow mode without losing the adsorption performance.
In the current study an attempt was made to increase the adsorption capacity of layered membranes using in situ functionalization of top layer made up of cellulose nanocrystals. Bi-layered membranes with two different base layers (with and without cellulose nanofibers on structural as well as functional properties of membranes). The tailoring of flux through the membrane was also attempted by controlling the grammage (weight in grams per unit area of the membrane) and also cellulose microfiber to nanofiber ratio in the support layer. It was expected that the networking potential of microscale fibers can be combined with adsorption potential of nanocellulose to tailor efficient water cleaning membranes. The support layer of cellulose sludge cuts down the cost of membranes, but provides mechanical as well as dimensional stability.
A comparative study of morphology, pore structure/distributions, water flux through the membranes, wettability and adsorption performance were evaluated to understand the effect of in situ modification on membrane performance from structural and functional points of view. The adsorption selectivity and capacity of the membranes (before and after modification) towards metal ions in mirror industry effluents were performed in cross-flow mode and the water samples were analysed using inductively coupled plasma optical emission spectrometry (ICP-OES).
2. Experimental
2.1. Materials and methods
TEMPO and all other chemicals were obtained from Sigma-Aldrich and used as received unless otherwise stated. Sodium hydroxide solution (0.1 M) was received from Fluka Analytical. Water was purified using a Millipore Synergy UV unit (Milli-Q water) prior to use.Cellulose sludge, consisting of shorter cellulose microfibers, a residue from cellulose production process, was supplied by Domsjö Fabrikerna AB, Örnsköldsvik, Sweden and was used as the raw material for the preparation of cellulose nanofibers (CNFSL). The cellulose sludge was reported to be high in cellulose (95%) with some hemicellulose and trace amounts of lignin.14 The cellulose sludge was used without any pre-treatment for the isolation into nanofibers. Isolation of CNFSL was reported in detail in our earlier publication.14
Pure cellulose was extracted from unbarked wood by a dilute acid hydrolysis in a bioethanol pilot plant followed by solvent extraction and bleaching and was supplied by SP Processum, Örnsköldsvik, Sweden as water suspensions of 17 wt%. The purified cellulose from bioethanol process was made into 2 wt% suspensions, mixed by shear mixture and passed through the homogenizer 10 times to obtain a thick gel of nanocrystals (CNCBE), as reported by Mathew et al. (2014).15
Cellulose nanofibers and crystals were characterized using Atomic Force Microscopy (AFM). The diameter of CNFSL is in the range of 6–9 nm, while the length is estimated to be several microns, as an accurate measurement using AFM was not possible. CNCBE shows typical cellulose nanocrystal structure and the diameter was measured using Nanoscope 5 software to be in the range of 5–10 nm. The diameters are in similar range as earlier reports from our laboratory for nanocrystals isolated from wood resources by sulphuric acid hydrolysis.16
2.2. Membrane processing
Two types of support layers were prepared by vacuum filtration of 2 wt% suspensions of sludge and mix with 1 wt% suspension of CNFSL in 1![[thin space (1/6-em)]](https://www.rsc.org/images/entities/char_2009.gif) :
:![[thin space (1/6-em)]](https://www.rsc.org/images/entities/char_2009.gif) 0.12 ratio, using a Buchner funnel set up having an area of 143 cm2. After the draining off of the water, the functional layer was fabricated (1 wt% of CNCBE and 1 wt% of gelatin in 3
0.12 ratio, using a Buchner funnel set up having an area of 143 cm2. After the draining off of the water, the functional layer was fabricated (1 wt% of CNCBE and 1 wt% of gelatin in 3![[thin space (1/6-em)]](https://www.rsc.org/images/entities/char_2009.gif) :
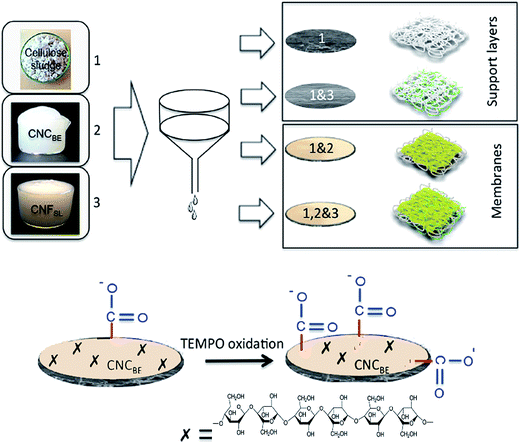
:![[thin space (1/6-em)]](https://www.rsc.org/images/entities/char_2009.gif) 1 ratio) using second filtration as shown in Fig. 1. Drying of fabricated bi-layer membrane was performed at room temperature for 4 days. Filter papers were changed every 5–6 h for fast drying. A low load of 5 kg was used for compacting during drying to maintain high porosity. Final drying was performed in an oven at 80 °C for 24 h using 5 kg weight. Finally, two types of membranes (with and without CNFSL in support layer) were prepared and stored until further use. The details of the nomenclature of the support layers, fabricated membranes and surface modified membranes are summarized in Table 1.
1 ratio) using second filtration as shown in Fig. 1. Drying of fabricated bi-layer membrane was performed at room temperature for 4 days. Filter papers were changed every 5–6 h for fast drying. A low load of 5 kg was used for compacting during drying to maintain high porosity. Final drying was performed in an oven at 80 °C for 24 h using 5 kg weight. Finally, two types of membranes (with and without CNFSL in support layer) were prepared and stored until further use. The details of the nomenclature of the support layers, fabricated membranes and surface modified membranes are summarized in Table 1.
| Types | Compositions | Nomenclatures | Surface zeta potential (mV) |
|---|---|---|---|
| Supports | Sludge | S | — |
| Sludge–CNFSL | S–CNFSL | — | |
| Un-oxidized membranes | Sludge/CNCBE | S/CNCBE | −40.1 (1.5) |
| Sludge–CNFSL/CNCBE | S–CNFSL/CNCBE | −47.9 (0.7) | |
| In situ TEMPO oxidized membranes | Sludge/TEMPO–CNCBE | S/TEMPO–CNCBE | −57.0 (1.4) |
| Sludge–CNFSL/TEMPO–CNCBE | S–CNFSL/TEMPO–CNCBE | −65.5 (2.4) |
2.3. In situ surface functionalization via TEMPO oxidation
The processed membranes were surface oxidized with the concept described by Orelma et al. (2012)17 using the 2,2,6,6,-tetramethylpiperidine-1-oxyl radical (TEMPO)–NaBr–NaClO system.18 In brief, 0.0156 g TEMPO and 0.10289 g NaBr were dissolved in 100 ml of water and 3.722 ml of 10% NaClO was added to the solution. The pH of the solution was adjusted to 10 using 1 M HCl and the membranes were submerged in the solution for 3 minutes. The reaction was quenched by submerging the samples into 25% ethanol–water mixture for 5 minutes and subsequently washed using Milli-Q water. The samples were dried between blotting boards.3. Characterization
3.1. Conductometric titration
Conductometric titration was carried out for unoxidized sludge–CNF/CNCBE membranes and in situ TEMPO-oxidized sludge–CNF/CNCBE membranes to determine the effect of the TEMPO oxidation on the total acidic group content of the material. The measurements were performed using conductometric titrator 712 Conductometer combined with 765 Dosimat (Metrohm, Utrecht, The Netherlands). Membranes were soaked in 0.1 M HCl for 30 minutes and washed with Milli-Q water. 0.25 g of each sample was cut into small pieces and mixed with 100 ml of distilled water. The mixture was sonicated using Digital Sonifier (Branson Ultrasonics, Danbury, CO, USA) (power 40%) for 10 minutes followed by dispersion using CAT Ultra Turrax (IKA, Staufen, Germany) until complete disintegration of the membranes. The conductometric titration was carried out by adding 0.1 M NaOH at rate of 0.1 ml min−1 using 15 second intervals. The total acidic group content was calculated as average of two individual measurements as described in the standard method SCAN-CM 65:02.3.2. Fourier transform infrared spectroscopy (FT-IR)
A Nicolet iS50 FT-IR spectrometer (ThermoScientific, USA) with a built-in diamond iS50 ATR was used to characterize the in situ TEMPO oxidized membranes. Spectra were scanned within the range of 350 to 4000 cm−1, with a total of 32 scans and resolution of 4 cm−1. At least three areas were scanned and the presented spectra are average values thereof.3.3. Surface zeta potential
Malvern Zetasizer Nanoseries in combination with a surface zeta potential cell (zen1020) was used to measure the surface charge on the membranes before and after tempo-modification. 0.05 M polyacrylic acid (PAA) at pH 7.58 was used as the tracer. The zeta potential measurements were done in 5 steps with increments of 125 of microns from the sample surface and the tracer zeta potential was measured at a distance of 1000 microns form the sample surface. 5 measurements were done at each step and the correlation co-efficient was >0.98 or above in all cases. The zeta potential at the surface is calculated by extrapolating the graph to zero displacement and applying the following formula| Surface zeta potential = −intercept + tracer zeta potential |
3.4. Contact angle
Static water contact angles were measured on membranes using the sessile drop technique. A dynamic Absorption Tester (68-96 DAT) was used to record the contact angle of the water sessile drops on the membranes (before and after TEMPO functionalization) as function of time.3.5. Microscopy
An atomic force microscope (Nanoscope V, Veeco Instruments, Santa Barbara, CA, USA) was used to examine the morphologies of the CNFSL, CNCBE. A drop of diluted suspension of each nanoparticle was deposited onto freshly cleaved mica and left to dry at room temperature and was imaged in tapping mode to collect height, amplitude and phase images. The cantilever resonance frequency was 350 kHz and the spring constant was 10–200 nm−1. The diameter measurements were conducted with the aid of Nanoscope V software. Surface of fabricated membranes were also characterized to understand the effect of functionalization on membrane using AFM in tapping mode.To study nanostructured morphology of membranes, an extreme high-resolution scanning electron microscope, MAGELLAN 400, SEM (FEI Company) was used. The membranes were fractured in liquid N2 and sputter coated with tungsten for 20 s and were observed in the SEM at an acceleration voltage of 5 kV.
3.6. Pore size distribution
Pore size and pore size distribution was measured by capillary flow porosimeter, CFP-1500-A. The pressure setting was in the range of 0–90 psi. Pore sizes from minimum up to maximum were recorded, where the mean flow pore diameter (MFP) was considered to be the main pore size. The sample was placed in a holder, with wetting liquid placed on the topside of the membrane.3.7. Water permeability and flux
The water permeability of the support layers and membranes was measured in a dead-end cell (Sterlitech HP4750 Stirred cell, U.S.A). Prior to the measurements, discs with a diameter of approx. 50 mm were cut out from the membranes and soaked in water for at least 2 h to ensure equilibration of the membrane. The conditioned membranes were placed in the dead-end cell on a stainless steel porous support disk and water was passed through the membranes at room temperature at a pressure of 0.45 MPa maintained using N2 gas. The quantity of water that passed through the membrane for a defined time interval was measured accurately and the flux was calculated (L h−1 m−2) for the active filtration area (14.6 cm2).3.8. Adsorption experiments
The contaminated water samples containing Ag(I), Cu(II)/Fe(III)/Fe(II) ions collected from a mirror making industry in Europe were used for the adsorption studies in cross-flow mode. All membranes were placed in dead end cell apparatus to measure adsorption capacity in continuous mode. 50 ml of polluted water was allowed to pass through the porous membranes at a pressure of 0.45 MPa. The concentration of metal ions in the water collected after passing through the membranes was determined using ICP-OES. Adsorption capacity of membranes was calculated with respect to metal ions concentration before treatment with contaminated water.Metals ions adsorbed on membranes were studied using a scanning electron microscope (SEM, JSM-6460 LV, JEOL, USA), equipped with energy dispersive X-ray elemental spectrometer (EDS). TEMPO oxidized membranes were selected for the study and SEM-EDS was performed before and after adsorption.
3.9. Membrane stability/biodegradability
Experiments were carried out to understand the stability and/or rate of biodegradation of membranes in water and soil. Bi-layered membranes before and after in situ functionalization were dipped in model waste water having different pH values (2.0, 7.0 and 9.0) at 37 °C. In another experiment, all four membranes were embedded in soil at 37 °C. The membranes were removed from water or soil and weighed at different time intervals. The degradation rate was calculated using the weight of control composite membranes as 100%. The weight loss of treated membranes was measured after 24 h drying at room temperature. All samples were imaged using a digital camera to visually compare the degradation.4. Results and discussion
4.1. Effect of TEMPO oxidation on membrane functionality
The effect of in situ TEMPO oxidation on the acid group content of the membranes was investigated using conductometric titration and FT-IR. Conductometric titration revealed that the total acidic group content of the membranes increased from ∼7 to ∼42 mmol kg−1 upon in situ TEMPO oxidation of sludge–CNF/CNCBE membranes, corresponding to a significant 6-fold charge increase. This result was in correlation with FT-IR results (Fig. 2), which revealed a new band at 1605 cm−1 attributed to –COONa due to the C![[double bond, length as m-dash]](https://www.rsc.org/images/entities/char_e001.gif) O stretching of carboxyl groups19 in the spectra of surface TEMPO oxidized membranes. FT-IR spectra of oxidized membranes were similar for both support layers. Quantitative analysis using conductometric titration and qualitative analysis by FT-IR demonstrate the effectiveness of the direct in situ TEMPO oxidation approach for assembled membrane structures. Although the gradient of acidic group content across the film thickness is not evident from the measurements, the primary hydroxyl groups on the surface of the film can be expected to be the most readily available for in situ oxidation and therefore most prone to undergo TEMPO catalysed oxidation reactions. The similar successful surface oxidation procedure has also been previously reported by Orelma et al. (2012)17 for the assembled film structures prepared using cellulose nanofibrils. The data from conductometric titration as well as FTIR spectroscopy confirms the concept of increase in carboxyl functional groups on the membranes, schematically shown in Fig. 1.
O stretching of carboxyl groups19 in the spectra of surface TEMPO oxidized membranes. FT-IR spectra of oxidized membranes were similar for both support layers. Quantitative analysis using conductometric titration and qualitative analysis by FT-IR demonstrate the effectiveness of the direct in situ TEMPO oxidation approach for assembled membrane structures. Although the gradient of acidic group content across the film thickness is not evident from the measurements, the primary hydroxyl groups on the surface of the film can be expected to be the most readily available for in situ oxidation and therefore most prone to undergo TEMPO catalysed oxidation reactions. The similar successful surface oxidation procedure has also been previously reported by Orelma et al. (2012)17 for the assembled film structures prepared using cellulose nanofibrils. The data from conductometric titration as well as FTIR spectroscopy confirms the concept of increase in carboxyl functional groups on the membranes, schematically shown in Fig. 1.
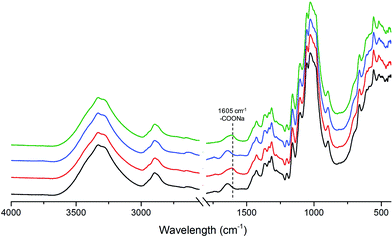 | ||
| Fig. 2 FT-IR spectra of unmodified S/CNCBE (black curve), surface TEMPO oxidized S/CNCBE (red curve) and unmodified sludge (blue curve) membranes. | ||
4.2. Surface characteristics of the membrane
The surface zeta potential of the membranes was studied before and after in situ TEMPO oxidation and are given in Table 1. The zeta potential values were more negative for S–CNCBE (−40 to −48 mV) as well as S–CNFSL/CNCBE (−57 to −65.5 mV) after TEMPO oxidation. The increase in negative potential of the membranes gives a direct indication of increased negative surface functionality of the membranes after in situ TEMPO modification.Contact angle measurement is commonly used to assess the wettability of a surface. Wettability is known to be dependent on the surface morphology of the substrate and its chemical composition.20 To understand the effect of in situ TEMPO functionalization on the membrane surface, static contact angles of S/CNCBE membranes before and after functionalization were studied.
Unmodified membranes have higher contact angle (33°) compared to modified (20°) ones, after 10 s, indicating an increase in hydrophilicity/wettability after modification which might be attributed to increase in the functional groups content (–COO−) after modification (as shown in Fig. 2). Our results were in agreement with the earlier published study, where contact angle of TEMPO oxidized membranes having different concentration of carboxylic groups was studied. A decrease in contact angle was reported with increase in the –COO− contents (20–15° at carboxylate contents of 0.7–0.8 mmol g−1).14 In the current work, the measurement of contact angle for support layers alone was not possible due to the swelling of the samples and therefore not available for comparison.
4.3. Micro- and nanostructure of the membranes
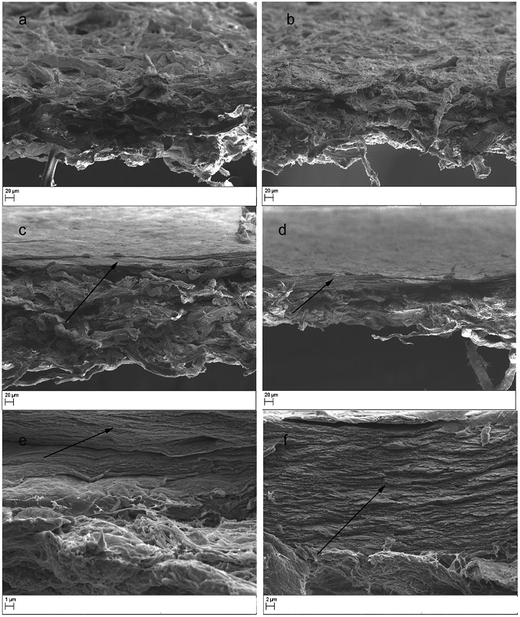
The thicknesses of the support layers of sludge and S–CNFSL were 154 and 190 μm, respectively (determined by digital calipers), which increased to 166 and 208 μm after the impregnation with CNCBE functional layer. The thickness of functional layer determined based on the thickness difference was 12 μm for sludge support and 18 μm for S–CNFSL based membranes. The thickness difference for the functional layers may be related to the degree of impregnation of gelatin–CNCBE suspension into support layers. The higher thickness of functional layer while using S–CNFSL as the support layer might be caused by limited impregnation of CNCBE into the tight layer of CNFSL network.The morphology of supports and membranes at micro-/nanometer length scale were observed using SEM and are shown in Fig. 3. The surface and the cross-section of the sludge support layer are given in Fig. 3a where microsized fibers were clearly visible and the fibers are loosely bound together in a 3D network. In the case of S–CNFSL, surface and cross-section clearly indicate a mixed 3D network with tightly bound sludge fibers with CNFSL (Fig. 3b). The idea to use CNFSL within the support layer is drawn from our previous publication where low metal ion adsorption capacity was recorded for CNFSL.21
SEM images in Fig. 3c and d, show a surface functional layer (indicated by an arrow) on the support layers. The bi-layered membrane cross-sections shown are in agreement with our previous reports of SEM images.13 However, the depth of impregnation varied based on the pore distribution pattern of support layers and it was not possible to see any nanocrystals impregnated into support layer at this magnification.
The high-resolution SEM image of functional layer (Fig. 3e and f) showed the dense and layered structure of the CNCBE within the gelatin matrix. The good dispersion of nanocrystals and absence of agglomerates in gelatin matrix indicates positive interaction between gelatin matrix and nanocrystals. The micro-scaled porosity of the support layer and low thickness of the functional layer confirmed by SEM was expected to provide high flux during water purification in crossflow mode.
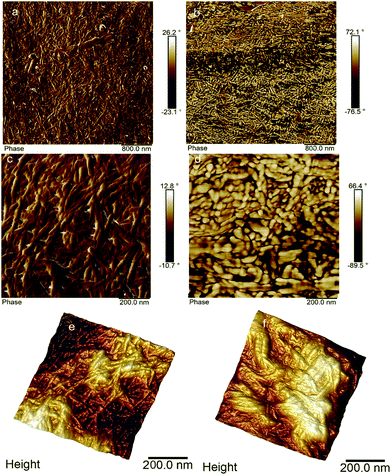
To understand the effect of functionalization on the CNCBE layer, SEM and AFM were used. SEM studies did not show any notable difference before and after in situ functionalization (images not shown). AFM images shown in Fig. 4 however, gave some insight into the topography changes after in situ TEMPO functionalization. The network structure formed by CNCBE is clearly visible in Fig. 4a, c and e. Fig. 4b (overview) after in situ modification also shows the network structure. The detailed view of the network after in situ modification of CNCBE layer (Fig. 4d) has some morphological differences compared to the network (Fig. 4b). The fibrils in Fig. 4d look coarser after the modification. The 3D images (Fig. 4e and f) also showed a weakly defined network structure after the in situ modification, probably due to the covering of the CNCBE network with a non-fibrous layer. The roughness of the membrane surface increased slightly after the modification (Rmax, 90 nm to 115 nm). Although no clear evidence of in situ surface functionalization is available from SEM or AFM study, some changes in morphology and topography are observable after the modification.
4.4. Pore-size distribution of membranes
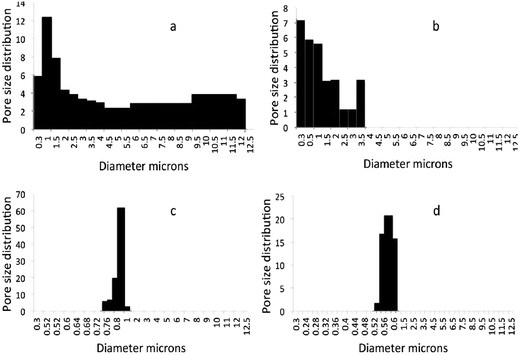
Bubble point method is a very accurate and effective method for pore measurement, especially in industries. However, it may be noted that this test is performed in the dry state, which is different from the wet state where swelling to some extent can be expected for cellulose based membranes. Also the pressure used during testing may lead to compression of the membrane and change of pore sizes22 compared to that measured in the dry state. The average pore size of sludge support layer was 6.5 μm and a slight decrease (0.5 μm) was recorded after the introduction (1 wt%) of CNFSL. The coating with functional layer further decreased the average pore size to 0.82 μm (S/CNCBE) and 0.61 μm (S–CNFSL/CNCBE) respectively, and confirmed the microfiltration range of the membranes. Pore size distribution graphs in Fig. 5 show that sludge support has a low pore volume and pores below 12 μm with a large percentage of pores ranging from 5.5–12 μm. S–CNFSL support membranes showed smaller pores with the largest fraction centered at 0.9–2.3 μm, although the relative pore volume of CNFSL base membrane is very close to that of sludge support membrane. The driving force that makes the pore-size distribution narrow is the introduction of cellulose nanofibers within the support layer. The obtained results were further supported by SEM images as discussed in Fig. 3a and b. It is clearly shown that sludge support has more open voids compared to S–CNFSL support membrane.S/CNCBE membrane showed very narrow pore-size distribution with major faction at 0.76–0.82 μm. The highest pore volume was recorded for pore having 0.82 μm of diameter. A pore size distribution in the range of 0.56–0.60 μm was recorded for S–CNFSL/CNCBE membrane, which confirms smaller pores compared to S/CNCBE, as expected. This also shows that the support layer morphology is the dominant factor controlling the pore-size distribution and pore volumes in the membranes. Cellulose nanocrystals used in this study, that have a diameter of 5–10 nms, have more possibilities of infusion within the support layers, as shown in SEM images in our previous study.13 The narrow pore distribution of S–CNFSL/CNCBE compare to S/CNCBE can be explained by (a) introduction of CNFSL in support layer and (b) smooth/rough distribution of functional layer makes dense/loose networking potential of membranes.
The present work aims for water contaminant retention (metal ions) via adsorption mechanism and narrow pore size distribution with high pore volume is requirement for effective adsorption. The large distribution of pore sizes was however noticed and may require further process optimization to improve the pore homogeneity.
4.5. Water permeability
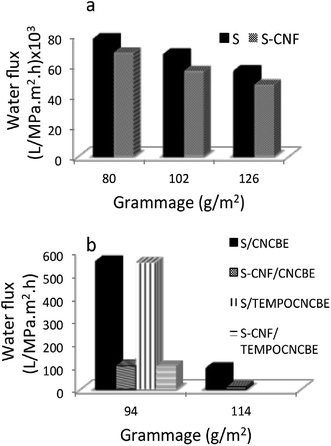
Water permeability of the support layers having different grammages of the support layers was studied in cross-flow mode.Sludge support layer showed the highest water permeability (77 × 103 L m−2 h−1 MPa−1) followed by S–CNFSL layer of same grammage. The water permeability decreased with increasing grammage for both supports (Fig. 6a) as expected, due to increase in the thickness of the layers. The low water permeability of S–CNFSL compared to corresponding sludge alone support layers is attributable to the tight networking potential of CNFSL. SEM images as shown in Fig. 3a and b as well as the pore size data are in the agreement of our observation that the presence of CNFSL decreases the network porosity.
Ma et al. (2012)24 had reported the flux through a microfiltration membrane using CNCs as functional entity within PAN nanofibrous scaffold was 0.59 L m−2 h−1 bar−1 and much higher than commercial membrane, GS0.22 (0.25 L m−2 h−1 bar−1). Thin-layered composite membranes fabricated in the current study have significantly higher water flux compared to the previous reported membranes as well as the commercially available membranes. Also the flux reported in the current study is higher than our earlier report where a nanocellulose based hybrid membrane was fabricated using freeze-drying.25
4.6. Adsorption characterization
To understand the membrane performance towards metal adsorption, the removal efficiency of Ag(I), Cu(II) and Fe(II)/Fe(III) ions from industrial effluent were studied in cross-flow mode (Table 2). Cross-flow mode of operation is known to provide more surface area for adsorption compared to static mode operation due to high penetration power of pollutants and bulk adsorption possibility, and is therefore, considered to be the efficient mode while using at industrial level in real waste water purification.13In the case of Ag(I), very low adsorption capacity of membrane was recorded before and after in situ functionalization and could be explained based on the low concentration of Ag(I) in the industrial effluent (1.48 mg L−1). A maximum of 0.87 mg g−1 adsorption capacity was recorded after in situ functionalization of membranes. It is worth mentioning that the adsorption capacity was calculated after a single cycle, and a higher volume of effluent can be cleaned before reaching to saturation limit of the membrane.
In the case of CNCBE coated membranes, sorption capacity of Cu(II) and Fe(II)/Fe(III) was higher for membranes having CNFSL in support layer indicating that CNFSL also contributes to the adsorption capacity. An adsorption of 254 mg g−1 and 396 mg g−1 was recorded for Cu(II) and Fe(II)/Fe(III), respectively for S–CNFSL membranes. The use of CNFSL as functional entity for the removal of metal ions was reported in our previous publication.20 Another accountable reason for the increase in the adsorption capacity in current study compared to our previous study13 is the concentration of CNCBE used for the fabrication of membranes. In our previous study, unmodified functional layer on sludge support having functional nanocellulose CNCBE in 1![[thin space (1/6-em)]](https://www.rsc.org/images/entities/char_2009.gif) :
:![[thin space (1/6-em)]](https://www.rsc.org/images/entities/char_2009.gif) 1 ratio with gelatin (1 wt% of CNCBE and gelatin) were used as functional entity for the removal of metal ions.13 In the current study threefold higher amount (3
1 ratio with gelatin (1 wt% of CNCBE and gelatin) were used as functional entity for the removal of metal ions.13 In the current study threefold higher amount (3![[thin space (1/6-em)]](https://www.rsc.org/images/entities/char_2009.gif) :
:![[thin space (1/6-em)]](https://www.rsc.org/images/entities/char_2009.gif) 1 ratio at 1 wt% of CNCBE and gelatin) of CNCBE was used for fabrication of functional layer i.e. 0.125 g and 0.375 g of CNCBE per gram of membrane compared to our earlier reports.
1 ratio at 1 wt% of CNCBE and gelatin) of CNCBE was used for fabrication of functional layer i.e. 0.125 g and 0.375 g of CNCBE per gram of membrane compared to our earlier reports.
About 1.4 fold increased in copper adsorption capacity was recorded for S/CNCBE and S–CNFSL/CNCBE based membranes, respectively after in situ functionalization of membranes. An increase in adsorption capacity (≈65 mg g−1) after TEMPO oxidation was reported in case of Fe(II)/Fe(III) also. The higher adsorption capacity of functionalized membranes could be explained based on increased carboxylic group contents as shown by analysis using FT-IR and conductometric titration. Furthermore, our previous study showing the increase in the adsorption capacity with increase in the charge contents on CNFSL after TEMPO oxidation.12
Membrane samples, before and after incubating with polluted water, were used for elemental constitution analysis and the spectrum is shown in ESI (Fig. S1†). Only elements of membranes i.e. Si, S, C and O can be observed on the surface of membranes before incubation with polluted water. The EDS spectrums of membranes treated with contaminated water showed the introduction of new peaks from Cu(II) and Fe(II)/Fe(III), which confirms the presence of the respective metal ions on the membrane surface.13
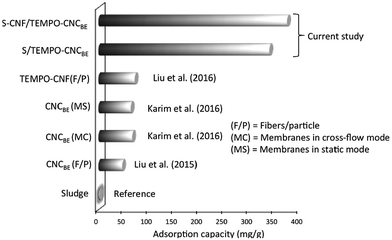
A comparative study for copper ion adsorption found in literature and the current study is given in Fig. 7. Sludge was taken as reference in the current study, only 2 mg g−1 of adsorption capacity was recorded for the adsorption of Cu(II). When TEMPO oxidized CNFSL were used in the form of nanofibers to capture Cu(II) (surface charge 1.6 mmol g−1), only 72 mg g−1 sorption capacity of fibers was recorded for water containing 250 mg L−1 initial concentration of Cu(II).26 In the current study, 339 and 374 mg g−1 of Cu(II) was captured by nanocellulose fraction in S/TEMPO–CNCBE and S–CNF/TEMPO–CNCBE (Table 2). Thus, in situ functionalization of nanocellulose after membrane fabrication is more effective for capturing metal ions in term of adsorption capacity. Another advantage of in situ functionalization is the easy availability of anchoring sites on the surface of membranes for binding of metal ions and the limited impact of the operation mode (static or cross-flow) on the adsorption performance. In spite of these advantages, the adsorption capacity of modified membranes in current study is lower than enzymatically modified cellulose nanocrystals (CNCSL) based membranes reported earlier by us.13
It may be noted that the pH of effluent containing silver metal ions was 9.2 and copper/iron metal ions was 2.3, which confirms the effectiveness and versatility of the membranes in acidic as well as basic conditions. Furthermore, the membranes were found to be efficient in different concentration ranges and for different metal ions, which can be of advantage in real applications.
4.7. Evaluation of biodegradability
The biodegradation of all membranes was evaluated during 1 month and the results are summarized in Fig. 8. In the case of model waste water having different pH conditions, no degradation was observed for unmodified as well as modified membranes based on sample weight or visual appearance, up to 30 days. For the degradation of membranes in soil, a different trend was observed. The membranes degraded rapidly in soil confirmed by weight loss as well as via visual appearance. Complete degradation was recorded for unmodified membranes within 15 days. 92% and 87% degradation was recorded for modified S/CNCBE and S/CNFSL–CNCBE membranes, respectively (Fig. 8).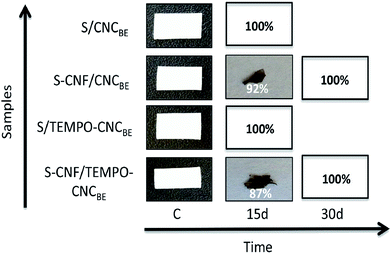 | ||
| Fig. 8 Photographs from different stages of degradation in waste water and soil. Complete degradation was recorded for unmodified membranes within 15 days. | ||
It was observed that temperature variation impacts the degradation rate.27 The used temperature was suitable for microbial growth and colonization. Thus, microbial role seems to be the major mode of degradation of the natural membranes in soil. In this study, the soil was purchased from local market and contains living microbes. Our results are also in agreement with previously published data; in a current study composite membranes/films were incubated with soil to check the rate of biodegradation where more than 50% degradation was observed within 30 days.28
5. Conclusion
The study demonstrates the potential of fully bio-based micro filtration membranes for metal ions capture from industrial effluents. The addition of CNFSL to the sludge resulted in support layers with a tighter network, which translated into a decreased average pore diameter, pore volume and a drastic drop of water permeability. The bilayered structure was confirmed using SEM for the CNCBE coated membranes which further decreased the water permeability. In situ TEMPO surface treatment is employed as an innovative route to increase the membrane functionality without changing the bulk network structure. The total acidic group content of the membranes increased from ∼7 to ∼42 mmol kg−1 upon in situ TEMPO oxidation. The increased roughness of the network structure of the CNCBE top layer, increase in wettability recorded using contact angle measurement and the increase in negative surface zeta potential was considered as evidence for changes in surface characteristics of the membranes after in situ TEMPO functionalization. In spite of the changes in surface characteristics the in situ functionalization had no significant effect on water permeability.Industrial effluent contaminated with Ag(I), Cu(II) and Fe(II)/Fe(III) was used to characterize adsorption capacity of fabrication membranes. A significant increase in adsorption efficiency was recorded after in situ functionalization of CNCBE layer. Biodegradation studies in water and soil indicate the potential of these membranes in real applications where possible biodegradation at end-of-life are crucial for economical, efficient and environmental friendly membranes.
Acknowledgements
The authors gratefully acknowledge the financial support by European Commission, under NanoSelect project, EU FP7-NMPA-SL-2012-280519. Prof. Allan Holmgren, LTU, is highly acknowledged for guidance of contact angle measurement. Ms Mari Leino is acknowledged for excellent laboratory assistance.Notes and references
- M. Mariano, N. E. Kissi and A. Dufresne, J. Polym. Sci., Part B: Polym. Phys., 2014, 52, 791–806 CrossRef CAS.
- A. W. Carpenter, C. F. de-Lannoy and M. R. Wiswener, Environ. Sci. Technol., 2015, 49, 5277–5287 CrossRef CAS PubMed.
- K. Missoum, M. N. Belgacem and J. Bras, Materials, 2013, 6, 1745–1766 CrossRef CAS.
- N. Lavoine, I. Desloges, A. Dufresne and J. Bras, Carbohydr. Polym., 2012, 90, 735–764 CrossRef CAS PubMed.
- F. W. Brodin, O. W. Gregersen and K. Syverud, Nord. Pulp Pap. Res. J., 2014, 29, 156–166 CAS.
- C. W. Miao and W. Y. Hamad, Cellulose, 2013, 20, 2221–2262 CrossRef CAS.
- T. Saito and A. Isogai, Carbohydr. Polym., 2015, 61, 183–190 CrossRef.
- H. Ma, C. Burger, B. S. Hsiao and B. Chu, ACS Macro Lett., 2012, 1, 723–726 CrossRef CAS.
- H. Ma, C. Burger, B. S. Hsiao and B. Chu, J. Mater. Chem., 2011, 21, 7507–7510 RSC.
- A. W. Carpenter, C. De Lannoy and M. R. Wiesner, Environ. Sci. Technol., 2015, 49, 5277–5287 CrossRef CAS PubMed.
- L. A. Goetz, B. Jalvo, R. Rosal and A. P. Mathew, J. Membr. Sci., 2016, 510, 238–248 CrossRef CAS.
- P. Liu, P. F. Borrell, M. Bozic, V. Kokol, K. Oksman and A. P. Mathew, J. Hazard. Mater., 2015, 294, 177–185 CrossRef CAS PubMed.
- Z. Karim, A. P. Mathew, V. Kokol, J. Wei and M. Grahn, RSC Adv., 2016, 6, 20644–20653 RSC.
- M. Jonoobi, A. P. Mathew and K. Oksman, Ind. Crops Prod., 2012, 40, 232–238 CrossRef CAS.
- A. P. Mathew, K. Oksman, Z. Karim, P. Liu, S. A. Khan and N. Naseri, Ind. Crops Prod., 2014, 58, 212–219 CrossRef CAS.
- D. Bondeson, A. P. Mathew and K. Oksman, Cellulose, 2006, 13, 171–180 CrossRef CAS.
- H. Orelma, I. Filpponen, L. S. Johansson, M. Österberg, O. Rojas and J. Laine, Biointerphases, 2012, 7, 61–73 CrossRef CAS PubMed.
- A. Isogai and Y. Kato, Cellulose, 1998, 5, 153–164 CrossRef CAS.
- S. Fujisawa, Y. Okita, H. Fukuzumi, T. Saito and A. Isogai, Carbohydr. Polym., 2011, 84, 579–583 CrossRef CAS.
- G. Rodionova, O. Eriksen and O. Gregersen, Cellulose, 2012, 19, 1115–1123 CrossRef CAS.
- P. Liu, H. Sehaqui, P. Tingaut, A. Wichser, K. Oksman and A. P. Mathew, Cellulose, 2014, 21, 449–461 CrossRef CAS.
- P. Orsolini, B. Michen, A. Huch, P. Tingaut, W. R. Caseri and T. Zimmermann, ACS Appl. Mater. Interfaces, 2015, 46, 25884–25897 Search PubMed.
- B. H. Jeong, E. M. V. Hoek, Y. S. Yan, A. Subramani, X. F. Huang, G. Hurwitz, A. K. Ghosh and A. Jawor, J. Membr. Sci., 2007, 294, 36–43 CrossRef.
- H. Ma, C. Burger, B. S. Hsiao and B. Chu, Biomacromolecules, 2012, 13, 180–186 CrossRef CAS PubMed.
- Z. Karim, A. P. Mathew, M. Grahn, J. Mouzon and K. Oksman, Carbohydr. Polym., 2014, 112, 668–676 CrossRef CAS PubMed.
- P. Liu, K. Oksman and A. P. Mathew, J. Colloid Interface Sci., 2016, 464, 175–182 CrossRef CAS PubMed.
- H. Qi, C. Chunyu and L. Zhang, Green Chem., 2009, 11, 177–184 RSC.
- W. Rhim and P. K. W. Ng, Crit. Rev. Food Sci. Nutr., 2007, 47, 411–433 CrossRef PubMed.
Footnote |
| † Electronic supplementary information (ESI) available. See DOI: 10.1039/c6ra25707k |
| This journal is © The Royal Society of Chemistry 2017 |

